Participants
Fifteen healthy younger adults (18–35 years) and fourteen older adults (> 65 years) participated (Table 1). Participants had no neurological impairment or leg injuries. Each participant provided written informed consent approved by the University of North Carolina at Chapel Hill Biomedical Sciences Institutional Review Board before participating. Before performing walking trials, each participant answered a questionnaire asking how many times on average they perform strenuous (heart beats rapidly; e.g., running, vigorous bicycling), moderate (not exhausting; e.g., fast walking, easy bicycling), or mild exercise (minimal effort; e.g., yoga, easy walking) for more than 15 min to contextualize their physical activity level. Although older adults tended to participate in lesser physical activity than younger adults, on average, these differences were not statistically significant.
Table 1 Participant demographicsExperimental procedure
We measured each participant’s self-selected walking speed as the average of three 30-m walks using two timing gates (Bower Timing Systems, Draper, UT, USA). Participants then walked on a dual-belt treadmill (Bertec Corp., Columbus, OH) at their preferred walking speed for a 5-min acclimation period. Then, they walked at 1.2 m/s for two minutes, which we later used as a baseline for EMG normalization (Kwon et al. 2023). Finally, in a prolonged walking trial, participants walked at their self-selected walking speed for 30 min.
Measurements
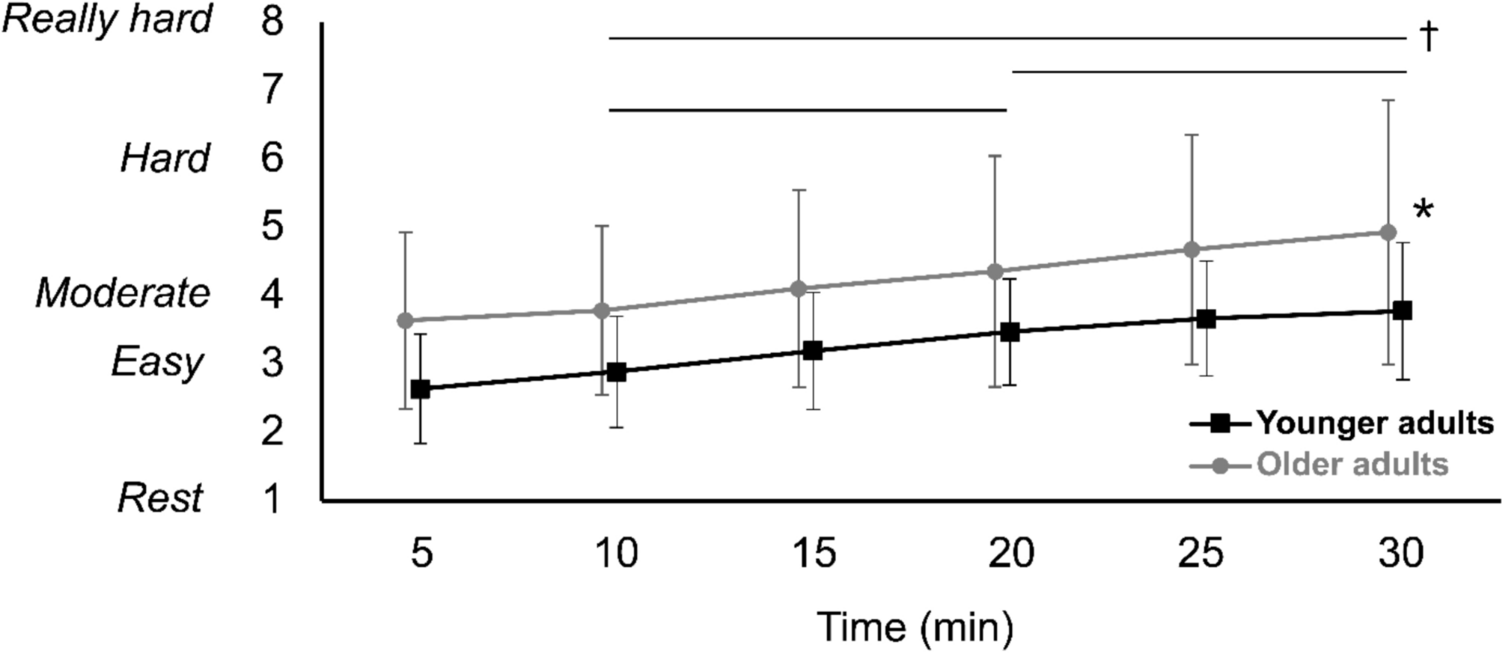
Wireless surface electromyography (EMG) recorded muscle excitations of 12 dominant-leg muscles (Trigno, Delsys Inc., Natick, MA) at 1000 Hz. Leg dominance of each participant was defined by asking the leg they would use to kick a ball. The twelve muscles included: Shank (SOL, soleus; LGAS, lateral gastrocnemius; MGAS, medial gastrocnemius; TA, tibialis anterior; PL, peroneus longus), Thigh (VL, vastus lateralis; VM, vastus medialis; RF, rectus femoris; BIFEM, biceps femoris; ST, semitendinosus), and Hip (GMAX, gluteus maximus; GMED, gluteus medius). Before attaching electrodes to each muscle, the site was shaved if needed and wiped with alcohol to minimize impedance. All electrodes were placed on the respective muscle bellies according to the SENIAM guidelines (seniam.org). Synchronously, we collected the trajectories of 36 retroreflective markers placed on the trunk and lower extremities at 100 Hz using a 15-camera 3D motion capture system (Motion Analysis Corporation, Santa Rose, CA) and bilateral ground reaction force (GRF) data at 1000 Hz using instrumented dual-belt treadmill (Bertec Corp., Columbus, Ohio, USA). Anatomical markers were placed bilaterally on the acromion, posterior superior iliac spine, anterior superior iliac spine, lateral knee joint, lateral malleoli, heel, and 1st and 5th metatarsophalangeal joint, as well as on the 7th cervical and 10th thoracic vertebrae, the posterior sacrum, right scapula, suprasternal notch, and sternum. In addition, rigid plates with 3–4 tracking markers were placed on the lateral thighs and shanks. During the 30-min walking trial, participants verbally reported their rate of perceived exertion (RPE) on a 10-point Borg scale every ten minutes. We secured EMG sensors and markers with Coban self-adherent wrap (3 M, St. Paul, MN, USA) to prevent them from falling off during the prolonged walking trial.
EMG analysis
Raw EMG signals were bandpass filtered between 20 and 400 Hz using a Butterworth 4th order filter. We then analyzed EMG signals in both time and frequency domains using wavelet transformations. The detailed method of the analysis is described in our previous papers (Kwon et al. 2023; Kim and Franz 2021). Briefly, we created 11 nonlinearly scaled Morlet wavelets (Cohen 2019) and converted each Morlet wavelet and EMG signals to the frequency domain with fast Fourier transforms (FFT). After multiplying them (i.e., Morlet wavelet and EMG signals) element by element, inverse FFT was used to calculate the EMG intensity data for each Morlet wavelet in the time domain. In the stacked EMG intensities of all wavelets, instantaneous mean frequency (\(_\)) of each gait cycle was calculated (Eq. 1).
$$_= \frac_^__}_^_}$$
(1)
where \(m\) is the muscle, \(k\) is the Morlet wavelet number (e.g., 1 ~ 11), \(i\) is the time point of the gait cycle (e.g., 1 ~ 100), \(cf\) is the central frequency of each wavelet, and \(I\) is the EMG intensity. Finally, we calculated mean \(_\) of the gait cycle by averaging all \(_\).
Here, we distinguish “intensity” from “amplitude” to describe signal analyses in the frequency domain. For the EMG amplitude analysis, EMG signals underwent bandpass filtering, fully rectification and filtering with a 4th order Butterworth filter with a cutoff frequency of 10 Hz. The EMG intensities and amplitudes were normalized to 100% of the gait cycle. The normalized EMG intensity and amplitude data were then normalized to their mean values obtained from the first 1 min of the baseline walking trial. Finally, instantaneous mean frequency (\(_\)) and the normalized amplitude data were averaged for four 1-min time blocks every ten minutes (i.e., 0–1 min; 9–10 min; 19–20 min; 29–30 min). All data analysis were conducted using a custom-written code in Matlab (MathWorks Inc., Natick, MA, USA).
Net joint moments
The GRF and the marker data were filtered using a 4th order Butterworth filter with a cutoff frequency of 20 Hz and 6 Hz, respectively. The motion and GRF data were then imported and processed in OpenSim musculoskeletal modelling software (version 4.5) (Delp et al. 2007) to estimate lower limb joint net joint moments. To create each participants’ model, we first linearly scaled the segment lengths of the Gait2392 model using anthropometrics (height and body mass) and marker pairs for each body segment (e.g., lateral epicondyle and lateral malleolus for the tibia segment) obtained during a static trial. Joint angles were computed via an inverse kinematics approach that minimized the position error between the model’s and measured marker. Then, we used the inverse dynamics tool to calculate the net joint moments of the ankle and hip joints on the dominant leg, based on joint angles obtained from inverse kinematics and ground reaction force (GRF) data measured by the instrumented treadmill. To analyze emergence of a distal-to-proximal redistribution over time, we calculated peak ankle plantarflexor moments (distal joint) and peak hip flexor and extensor moments (proximal joint) for each stride. Finally, all moment data were averaged for all gait cycles taken within four 1-min time blocks every 10 min as we did for the EMG data.
Statistical analysis
Principal component analysis (PCA) was used to reduce the dimensionality and capture patterns of variance of the high-dimensional EMG intensity data matrices (mean intensities of each muscle * 101 time points * 11 Morlet wavelets for 4 time blocks). By transforming the original complex dataset into a smaller set of principal components (PCs) that explain the most relevant patterns of variance, we can more effectively identify dominant activation trends and compare differences across conditions/populations. PCA calculated PCs and scores for PCs that had the biggest variance. The first three PCs were chosen which accounted for more than 5% of the total variance (VAF).
A two-way mixed ANOVA was performed on the following variables, with time as a within-subject repeated measure and age group as a between-subject factor. The effect of time and age group was tested on the variables: PC scores of each PC, mean EMG frequency, mean EMG amplitudes, net joint moments and RPE scores. To test the assumption of sphericity of the data, Maulchly’s test of sphericity was used. When the assumption was violated, a Greenhouse–Geisser correction was performed.
For significant main effects, the Bonferroni correction was used for pairwise comparisons. Participant demographics were compared using two sample t test. Therefore, the significance level was 0.05 for main effects and \(\alpha\) = 0.0125 (0.05/4) for pairwise comparisons to control the experiment-wise error rate. We used R (Rstudio, Boston, MA) for all statistical analyses.

Comments (0)