
Remember me

T1-weighted whole head MRI images acquired on a 1.5 T MRI scanner (Symphony, Siemens Medical, Erlangen, Germany) as part of a standard clinical MRI protocol were sourced from the MRI database of the Department of Neurology, University of Ulm, Germany. For this study, we utilized the same dataset as in the previous study [15] which includes 108 MRI volumes from 66 patients with ALS (mean age 61 ± 9 years, 58% male) and 42 healthy controls (mean age 53 ± 17 years, 50% male) without any neurological/psychiatric disease or other medical condition. These 108 MRI volumes were used for training and validation of the hypothalamus segmentation pipeline. For the ICV segmentation, we used 10 MRI volumes from the previous study for training [15].
The original T1-weighted MRI scans were acquired in sagittal orientation with an in-plane resolution of 1.0 mm and a slice thickness of 1.0–1.2 mm, depending on acquisition parameters. As part of the previous study, the images were reconstructed into 3D volumes with an isotropic resolution of 1.0 mm and reoriented to coronal orientation following rigid brain normalization using the Tensor Imaging and Fiber Tracking (TIFT) software [17]. During that process, the data were upsampled to higher resolutions, and manual annotations for both hypothalamus and ICV were generated based on these preprocessed images following the well-established manual delineation procedure, which has been used in the previous studies [4], demonstrating a high level of reproducibility. In contrast to our prior study, which employed a data augmentation pipeline involving generation of varying contrast images, the current approach applies a standardized preprocessing step using z-score intensity normalization—based on the mean and standard deviation of the means across all subjects—to reduce intensity variations across images while maintaining the original dataset size. The processed DICOM images were then reformatted into two sets of 2D slices stored in PNG format for training the segmentation networks:
(1)Hypothalamus segmentation—each subject’s MRI was stored as 50 pre-selected slices at a resolution of 0.125 × 0.125 × 0.5 mm3 (matrix: 512 × 512 pixels).
(2)ICV segmentation—full 3D volumes were stored as 512 slices per subject at a resolution of 0.5 × 0.5 × 0.5 mm3 (matrix: 512 × 512 pixels).
Dataset splits and models’ trainingFor hypothalamus segmentation, the available MRI volumes were subdivided into training and test sets, with a gender- and aged-matched test group of 30 subjects, including 15 ALS patients and 15 controls, consistent with the previous study’s methodology [15] to allow for the direct comparison of the models. In contrast to the previous study, we adopted a five-fold cross-validation strategy, where 20% of the data was held out at each fold as a validation set, for model evaluation instead of using a single model, thus ensuring a more robust performance assessment by the mitigation of potential biases from specific data splits. This approach maximizes the training data available to the model, enhancing its ability to learn complex features and improve generalization. By preserving a fixed test set, we ensure that model performance is evaluated consistently across each fold, providing a reliable assessment of its robustness and reducing variability in test results. This balance between training and testing data enables an effective trade-off, allowing the model to fully leverage the available data while maintaining an unbiased evaluation on a separate test set.
For training, we used a U-Net model with EfficientNetB0 backbone pre-trained on The ImageNet dataset. The training was performed along 25 epochs using early stopping where the training was stopped when the validation loss was observed to have ceased improving for 10 consecutive epochs with a batch size of 4 images per pass on a Nvidia GeForce GTX 1060 6 GB GPU. The loss function was based on the sum of the categorical Cross Entropy and Jaccard loss and Adaptive Moment Estimation (Adam) with the learning rate of 10–4 and remaining hyperparameters kept with their default Keras values was used as the optimizer. Mean Intersection over Union (IoU) was used as metric to evaluate the model.
For inference, the weighted ensemble of the five models obtained from five-fold cross-validation, was used for hypothalamus segmentation, with fixed weights derived from the normalized validation IoU scores at each fold. Additionally, each individual model from five folds was independently evaluated on the test set, which included both ALS patients and healthy controls, to provide a comprehensive understanding of model variability and generalization across different training subsets and different clinical conditions.
Given the robustness of the most frequently used open-source automated ICV estimation tools, such as FreeSurfer (eTIV/sbTIV)Footnote 1 [18, 19], SPM12Footnote 2 [19, 20], CAT12Footnote 3 [19], or FSLFootnote 4 [19], the segmentation of ICV from MRI images can be considered as a relatively straightforward and well-defined task for CNN-based approaches due to excellent contrast between brain tissue, cerebrospinal fluid, and surrounding structures. Moreover, ICV is a clearly defined anatomical region with consistent boundaries across individuals, which simplifies the segmentation process. Therefore, since only 10 MRI volumes (512 slices each) were available with the corresponding ground truth for training of the ICV model, we employed a single-validation scheme for training, leaving one case as a validation set. All other training parameters were kept consistent with those used for the hypothalamus model. Additionally, we utilized four MRI volumes that were already part of the hypothalamus test dataset and manually generated corresponding ICV annotations for them using identical delineation protocol as this applied in the training data using visual intensity-based three-dimensional marking tool within the TIFT software. This independent test set included scans from two healthy control subjects and two ALS patients, enabling quantitative and qualitative evaluation of the models’ generalizability across both subject groups.
Performance estimationPerformance metrics, including Dice score, 95th quantile Hausdorff distance, and volume similarity [21], were assessed to evaluate the segmentation accuracy of the hypothalamus and ICV in the test datasets. Dice score measures the overlap between the predicted and ground truth segmentation and is defined as:
$$ } = \frac \right|}} = \frac}}}} + } + }}}, $$
where \(A\) is the predicted segmentation and \(B\) is the ground truth, and \(\text\), \(\text\), and \(\text\) denote true positives, false positives, and false negatives.
To assess boundary accuracy, we included the 95th quantile Hausdorff distance (\(}_\)) which mitigates sensitivity to extreme outliers and is defined as:
$$ }_ \left( \right) = \max \left\ \left( \right),h_ \left( \right)} \right\}, $$
where \(_\left(A,B\right)\) is the 95th percentile of the minimum Euclidean distance between points in \(A\) and the closest points in \(B\).
Additionally, volume similarity (\(\text\)) was calculated to assess the consistency of volumetric measurements, using the formula:
$$ } = 1 - \frac \right|}} = 1 - \frac} - }} \right|}}} + } + }}} $$
These metrics are reported as the mean and standard deviation across cross-validation folds, including results for each individual model and the averaged ensemble of all five models.
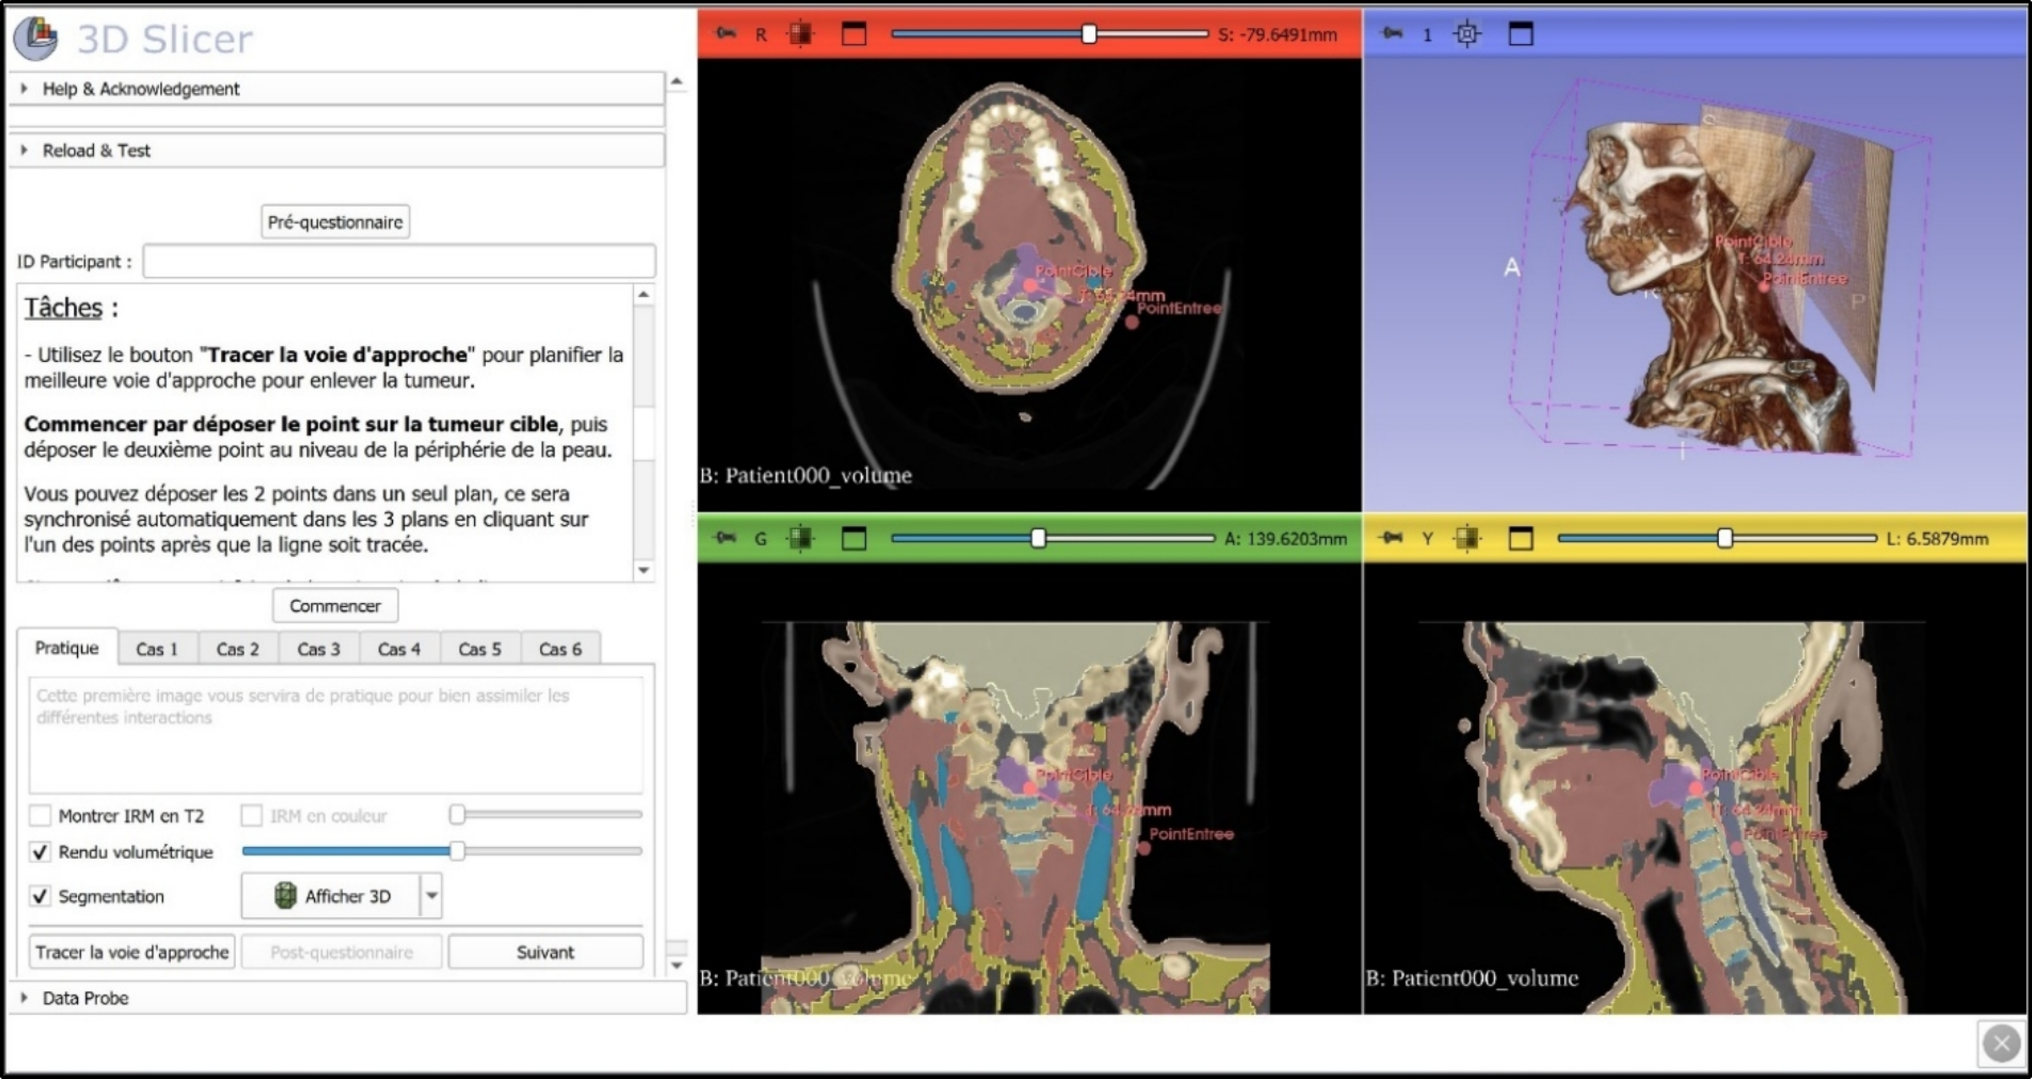
Segmentation GUITo facilitate the automated and semi-automated segmentation of the hypothalamus and ICV, we have developed a GUI using GradioFootnote 5 framework, which provides a user-friendly and consistent workflow for both segmentation tasks, incorporating the following key functionalities, which are depicted in Fig. 1:
File upload and preprocessing: Users can upload preprocessed 2D PNG image slices in bulk, which are generated from T1-weighted MRI scans using the TIFT software or any other preprocessing software, provided the output matches the input format required by the networks as specified. Upon upload, the files are automatically unpacked, renamed, and sorted according to patient identifiers and slice indices to ensure structured and traceable organization. This preprocessing step minimizes the risk of errors associated with manual file handling and supports scalability for larger datasets.
Model selection and automated segmentation: The interface allows users to choose from a selection of single pre-trained model or an averaged ensemble of five models for segmentation of hypothalamus. The single model is used for prediction of ICV. Then, using the selected model, the GUI performs an automatic segmentation of the hypothalamus or ICV from a batch of input images or a single selected image.
Quantitative analysis: For each segmented image, the system calculates the positive pixel counts, which are then used to estimate the hypothalamic volume or ICV per patient. The results are aggregated and stored in a comprehensive CSV file for downstream analysis. This automated calculation minimizes manual intervention, enhances reproducibility, and provides valuable quantitative insights.
Result storage: The GUI stores individual segmentation masks as grayscale PNG images for each corresponding input image, ensuring traceability and enabling further analysis. The calculated volumes and related metrics are also securely saved in structured formats for integration into broader research workflows.
Manual segmentation tool: Recognizing the need for manual adjustments in cases where automated methods may fall short, the GUI includes an additional segmentation panel equipped with a range of tools for manual refinement. Users can adjust or completely re-segment specific regions to ensure accuracy in challenging cases. Updated segmentation results from the manual adjustment panel can be saved, replacing or complementing the original results. This iterative functionality allows for improved segmentation quality and tailored analysis based on expert input.
Fig. 1
Gradio user interface displaying the hypothalamus segmentation tab
The segmentation models are hosted on a high-performance remote system and integrated with a Gradio-based web user interface (UI). External access is enabled through a secure tunnel established using ngrok, which generates a public URL linked to the remote computer. End users can connect to the segmentation tool from any local device via a standard web browser, without the need for software installation or network configuration. This setup ensures platform-independent accessibility, simplifies user interaction, and facilitates seamless collaboration across research teams. The diagram illustrates the complete communication flow from model execution to browser-based interaction (Fig. 2).
Fig. 2
Overview of the remote deployment and access workflow for the CNN-based segmentation tool
GUI performance evaluationEvaluation of the GUI was conducted using MRI data from a group of healthy controls (n = 39, mean age 68 ± 5 years, 64% male) and patients with Parkinson’s disease (n = 90, mean age 69 ± 10 years, 61% male), a neurodegenerative condition known to affect hypothalamic volumes similarly to controls [3]. Segmentation was performed via a shared link, and the quantified hypothalamic volume and ICV were analyzed using descriptive statistics and boxplot visualizations. Additionally, the average prediction time per image was recorded to assess the computational efficiency of the application. In total, 129 MRI volumes from these two groups were included in this pilot case series to evaluate the proposed approach.
Comments (0)