
Remember me
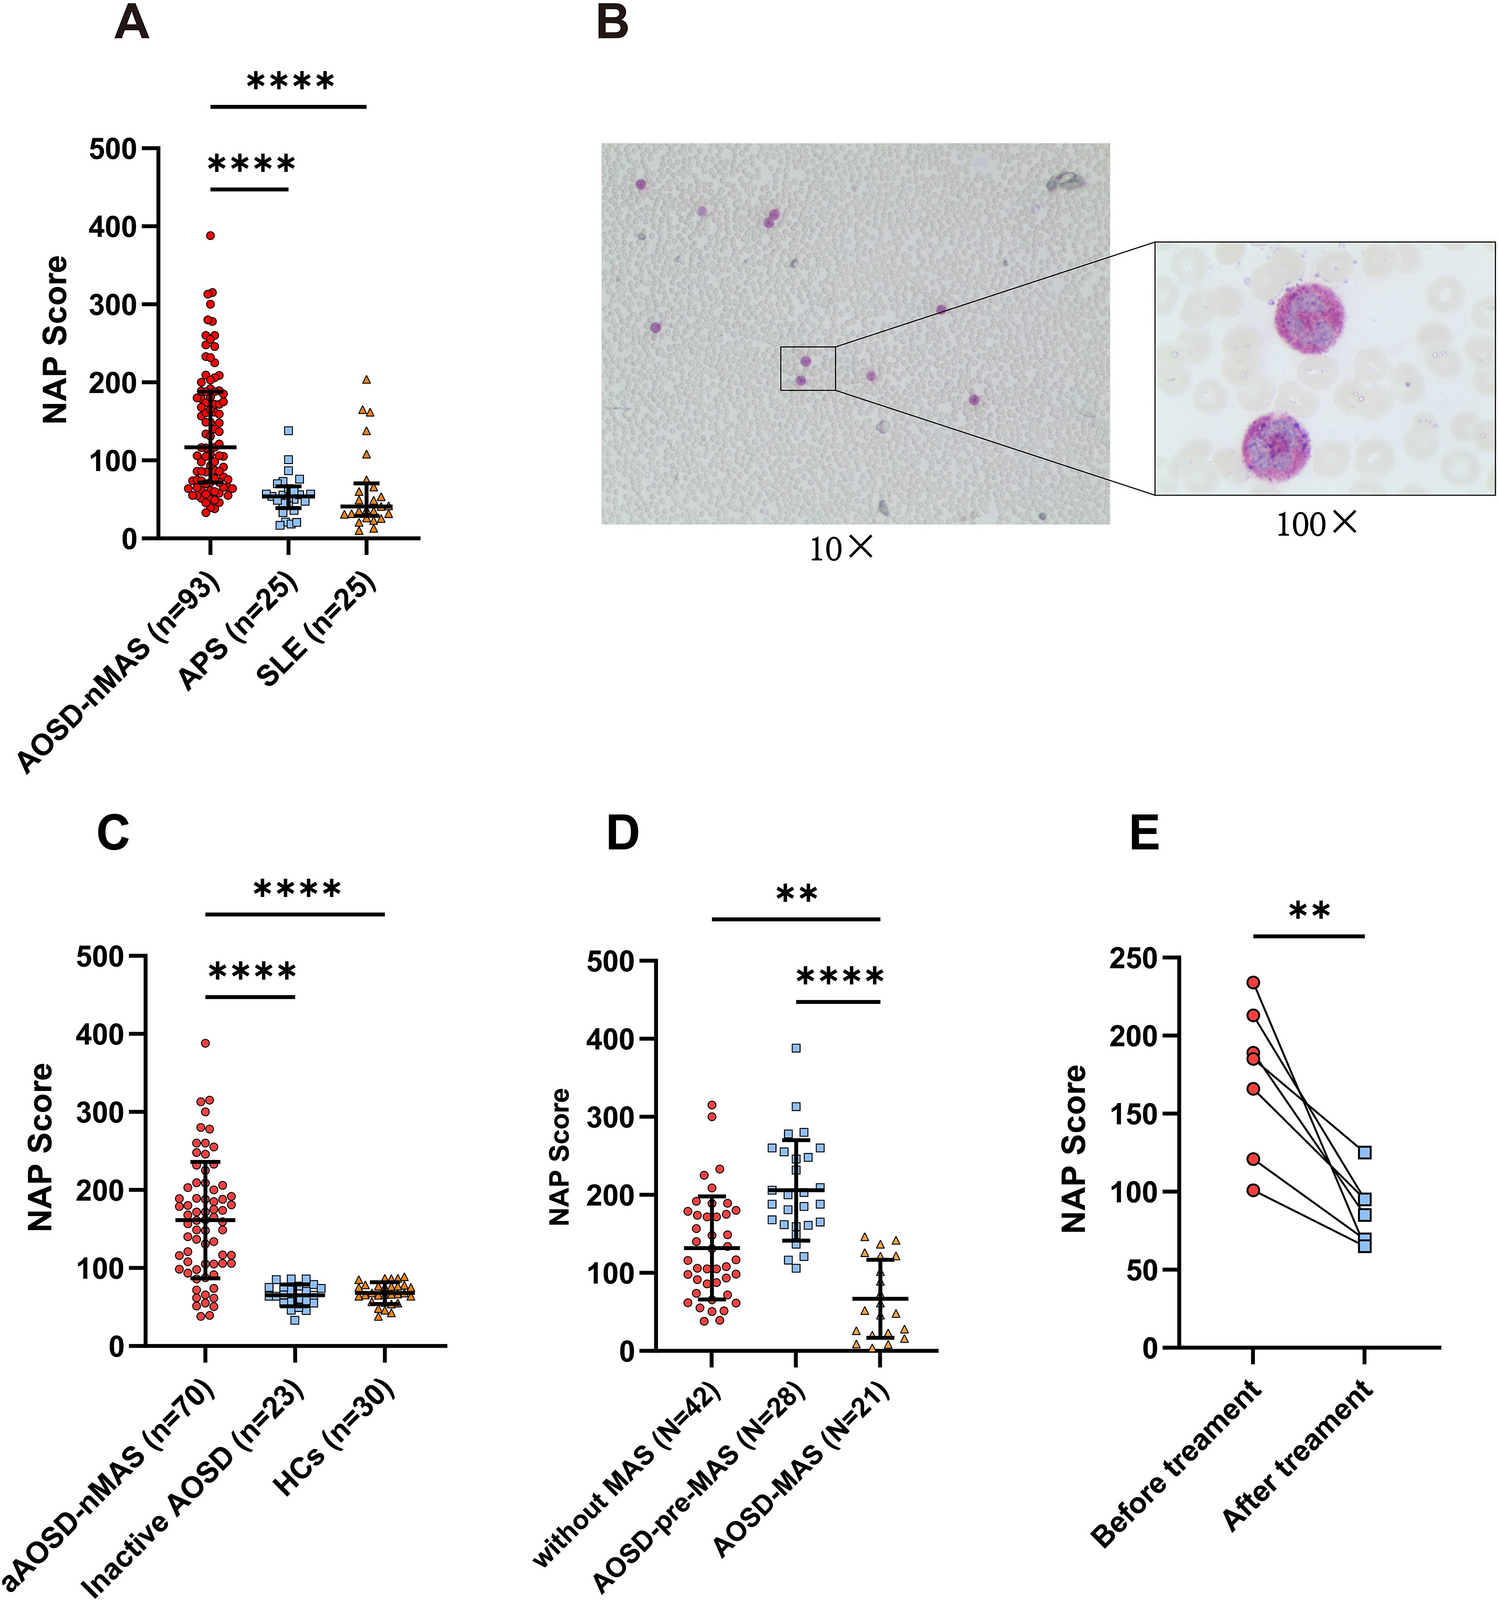
Clinical manifestations, laboratory tests, and other information of all individuals are presented in Table 1. As shown in Fig. 1A, NAP scores were elevated in patients with AOSD-nMAS compared to APS (P < 0.0001) and SLE (P < 0.0001). Figure 1B shows a peripheral blood smear image of a patient with AOSD-pre-MAS, with a NAP score of 260, depicting NAP staining under both low power and oil immersion lenses. The NAP staining of neutrophils under oil immersion is classified as “ + + + ”. To further investigate the association between the NAP score and disease activity, we compared the NAP score in patients with aAOSD-nMAS and inactive AOSD. As shown in Fig. 1C, patients with aAOSD-nMAS exhibited elevated NAP scores relative to inactive AOSD (P < 0.0001) and healthy controls (HCs, P < 0.0001). In Fig. 1D, we show that the NAP score was significantly lower in patients with AOSD-MAS compared to those with active AOSD without MAS (P < 0.01) and AOSD-pre-MAS (P < 0.0001). Additionally, as shown in Fig. 1E, we found a significant decrease in NAP scores before and after treatment (P < 0.01). We also explored the correlations between NAP scores and various clinical parameters in patients with AOSD-nMAS. Significant positive correlations were found between the NAP score and WBC (Fig. 2A, P < 0.0001, R = 0.5725), neutrophil ratio (NE%) (Fig. 2B P < 0.0001, R = 0.5348), absolute neutrophil count (ANC) (Fig. 2C, P < 0.0001, R = 0.5994), ferritin (Fig. 2D, P < 0.0001, R = 0.5879), C-reactive protein (CRP) (Fig. 2E, P < 0.0001, R = 0.5958), Pouchot score (Fig. 2F, P < 0.0001, R = 0.7116), alkaline phosphatase (ALP) (Fig. 2G, P < 0.0001, R = 0.3971), and erythrocyte sedimentation rate (ESR) (Fig. 2H, P < 0.0001, R = 0.5223). However, no significant correlation was found between NAP scores and platelet counts (PLT) (Fig. 2I, P = 0.1398, R = 0.1543). To further investigate the relationship between NAP scores and clinical manifestations, we compared NAP scores between patients with and without specific symptoms. We identified patients with AOSD-nMAS as those with inactive AOSD, active AOSD without MAS, and AOSD-pre-MAS. As shown in Supplementary Fig. 1, our analysis revealed that the NAP score was elevated in patients with AOSD-nMAS presenting with fever (Supplementary Fig. 1A, P < 0.0001), skin rash (Supplementary Fig. 1B, P < 0.0001), arthralgia (Supplementary Fig. 1C, P < 0.001), lymphadenopathy (Supplementary Fig. 1D, P < 0.0001), sore throat (Supplementary Fig. 1E, P < 0.01), myalgia (Supplementary Fig. 1F, P < 0.001), pericarditis (Supplementary Fig. 1G, P < 0.01), pneumonia (Supplementary Fig. 1H, P < 0.01), and pleuritis (Supplementary Fig. 1I, P < 0.001). Subsequently, we found that patients with AOSD-nMAS with ferritin levels exceeding 3000 ng/ml exhibited higher NAP scores (Supplementary Fig. 1 J, P < 0.0001), and those patients whose WBC exceeding 15*109/l also had higher NAP scores (Supplementary Fig. 1 K, P < 0.0001).
Table 1 Clinical characteristics of patients with adult-onset Still’s disease (AOSD) and control groups in this studyFig. 1
Neutrophil alkaline phosphatase (NAP) score was elevated in patients with AOSD-nMAS compared to patients with antiphospholipid syndrome (APS) and systemic lupus erythematosus (SLE). A NAP score in patients with AOSD-nMAS (n = 93), APS (n = 25) and SLE (n = 25). B Example of a peripheral blood smear from a patient with AOSD-pre-MAS. C Comparison of NAP score between patients with aAOSD-nMAS, inactive AOSD, and healthy control (HC). D NAP score in patients with active AOSD without MAS, AOSD-pre-MAS, and AOSD-MAS. E NAP score in patients with AOSD before and after treatment. ****P < 0.0001, **P < 0.01 Data are presented as mean ± SD. AOSD adult-onset Still’s disease, MAS macrophage activation syndrome. Patients with AOSD-nMAS: patients with inactive AOSD, patients with active AOSD without MAS and AOSD-PRE-MAS
Fig. 2
Correlations between neutrophil alkaline phosphatase (NAP) score and laboratory tests in patients with AOSD-nMAS. A-I. Correlations between NAP score and white blood cell (WBC), neutrophil% (NE%), acute neutrophil (ANC), ferritin, C-reactive protein (CRP), Pouchot score, alkaline phosphatase (ALP), erythrocyte sedimentation rate (ESR) and platelets (PLT) in patients with AOSD. AOSD adult-onset Still’s disease, MAS macrophage activation syndrome. Patients with AOSD-nMAS: patients with inactive AOSD, patients with active AOSD without MAS and AOSD-PRE-MAS
Elevated NAP Score in patients with AOSD-pre-MASWe next investigated the Utility of the NAP score in distinguishing AOSD-pre-MAS from patients with active AOSD without MAS. Significantly higher NAP scores were observed in patients with AOSD-pre-MAS (Fig. 3A, P < 0.0001). Additionally, increased levels of ferritin (P < 0.05) and sIL-2R (P < 0.05) were noted in this group (Fig. 3B, C). We then observed the associations between NAP scores and several laboratory markers for MAS. NAP scores were positively correlated with sIL-2R (Fig. 3D, P = 0.0046, R = 0.3449), a marker of MAS. Furthermore, significant differences in NAP scores and ferritin levels were observed in the low and high systemic score subgroups of active AOSD without MAS (Fig. 3E, F). However, no significant differences were observed in sIL-2R, WBC, and ANC levels in these two groups (Fig. 3G, Supplementary Fig. 2A, B). When comparing patients with AOSD-pre-MAS and active AOSD without MAS among patients with high systemic score, the NAP score (P < 0.01) was more pronounced compared to ferritin (P > 0.05), sIL-2R (P > 0.05), WBC (P > 0.05) and ANC (P > 0.05) (Fig. 3E–G, Supplementary Fig. 2A, B). We next applied receiver operating characteristic (ROC) curves to compare the utility of the NAP score, ferritin, and sIL-2R for differentiating patients with AOSD-pre-MAS from those with active AOSD without MAS. As shown in Fig. 3H, ROC curves indicated that the NAP score emerged as a great marker of patients with AOSD-pre-MAS, with area under the curve (AUC) of 0.7985 (P < 0.0001), indicating high sensitivity (82.14%) and moderate specificity (66.67%). However, ferritin and sIL-2R displayed lower AUC values of 0.6688 (sensitivity: 57.14%, specificity: 80.95%, P = 0.0173) and 0.6543 (sensitivity: 55.56%, specificity: 84.62%, P = 0.0341), respectively. We integrated the NAP score, ferritin, WBC, and sIL-2R into a nomogram designed to predict the risk in patients with AOSD-pre-MAS (Fig. 3I). Calibration curves confirmed the predictive reliability of the multivariable logistic regression model (Fig. 3J), which demonstrated the highest C-index when compared to other models (Fig. 3K). Furthermore, decision curve analysis (DCA) revealed that this model offers significant net benefits (Fig. 3L).
Fig. 3
Neutrophil alkaline phosphatase (NAP) scores were elevated in patients with AOSD-pre-MAS. A–C NAP scores, ferritin levels, and soluble interleukin-2 receptor (sIL-2R) levels in patients with AOSD-pre-MAS and active AOSD without MAS. D Correlations between NAP scores with the levels of sIL-2R in patients with aAOSD-nMAS. E–G Comparison of NAP scores, ferritin, and sIL-2R levels in patients with active AOSD without MAS with low systemic score, high systemic score, and patients with AOSD-pre-MAS. H Receiver operating characteristic (ROC) curve of NAP score, ferritin, and sIL-2R to clarify patients with active AOSD without MAS from patients with AOSD-pre-MAS. I, L Nomogram, calibration plot, C-index and decision curve analysis (DCA) of the multivariable logistic regression model. ****P < 0.0001, ***P < 0.001, **P < 0.01, *P < 0.05. Data are presented as mean ± SD. AOSD adult-onset Still’s disease, MAS macrophage activation syndrome. Patients with aAOSD-nMAS: patients with active AOSD without MAS and AOSD-PRE-MAS
To further investigate the factors for disease activity of AOSD, we conducted an ordinal logistic regression analysis (Supplementary Table 1). Disease activity was assessed using the Pouchot score, a widely recognized clinical scoring system for AOSD. NAP score (OR 1.011, 95% CI [0.005–0.018], P = 0.0008), WBC (OR 1.200, 95% CI [0.096–0.270], P < 0.0001), ferritin > 1500 ng/ml (OR 4.185, 95% CI [0.354–2.509], P = 0.0092), fever (OR 14.876, 95% CI [1.034–4.366], P = 0.0015), skin rash (OR 6.824, 95% CI [0.756–3.085], P = 0.0012), arthralgia (OR 3.899, 95% CI [0.371–2.350], P = 0.0070) and lymphadenopathy (OR 11.198, 95% CI [1.025–3.806], P = 0.0007) were observed significant differences. We next observed the level of NAP score in patients with AOSD-MAS, revealing a significant decrease compared to patients with active AOSD without MAS (P < 0.01) and AOSD-pre-MAS (P < 0.0001) (Fig. 1D). Ferritin and sIL-2R levels displayed significant differences only between patients with active AOSD without MAS and AOSD-MAS (Supplementary Fig. 3A, B). We hypothesized that the decrease in NAP score of patients with AOSD-MAS may be related to reduced WBC count. To verify this hypothesis, the NAP score was assessed in patients with AOSD-MAS who had WBC ≤ 4 × 10⁹/l and those with WBC > 4 × 10⁹/l (Supplementary Fig. 3C). Our findings demonstrated that NAP scores were significantly lower in patients with AOSD-MAS with WBC counts below the normal range and a trend also observed in those with ANC counts below the normal range (Supplementary Fig. 2D). Subsequently, we simulated the dynamic changes of NAP score at different disease activity in patients with AOSD (Supplementary Fig. 4).
NAP Score was Positively Correlated with Maximum Glucocorticoid DosageAfter a comprehensive evaluation of the patients’ condition, including NAP score assessment, we developed a robust treatment plan for each patient. To further assess the indicative role of NAP scores in treatment decisions, we recorded the highest steroid dose administered during the subsequent treatment process. Our analysis revealed a strong association between the maximum glucocorticoid dosage and NAP scores (P = 0.0041, R = 0.3392, Fig. 4A). Moreover, patients with aAOSD-nMAS receiving MP > 80 mg/day exhibited significantly higher NAP scores compared to those receiving MP ≤ 80 mg/day (P = 0.0085, Fig. 4B). Additionally, elevated NAP level was observed in patients with aAOSD-nMAS treated with dexamethasone (DEX) versus those not treated with DEX (P = 0.0292).
Fig. 4
Correlations between neutrophil alkaline phosphatase (NAP) score and the treatment of glucocorticoid in patients with aAOSD-nMAS. A Correlations between NAP score and maximum glucocorticoid dosage in patients with aAOSD-nMAS (n = 70). B NAP score in patients with aAOSD-nMAS with methylprednisolone (MP) ≤ 80 mg/day and MP > 80 mg/day. C NAP score in patients with aAOSD-nMAS with dexamethasone (DEX) and without DEX. This glucocorticoid therapy was initiated after the NAP score detected. **P< 0.01, *P < 0.05. Data are presented as mean ± SD. AOSD adult-onset Still’s disease, MAS macrophage activation syndrome. Patients with aAOSD-nMAS: patients with active AOSD without MAS and AOSD-PRE-MAS
NAP Score as a Potential Marker for Differentiating DLBCL from aAOSD-nMASUltimately, we explored whether NAP score was elevated in patients with aAOSD-nMAS compared with those with DLBCL. Our findings demonstrated a significant elevation in NAP scores among patients with aAOSD-nMAS (P < 0.0001, Fig. 5A). ROC curve analysis demonstrated that the NAP score emerged as a superior marker compared with interleukin-10 (IL-10) (AUC = 0.6580, P = 0.0043, Fig. 5B), interleukin-8 (IL-8) (AUC = 0.6928, P = 0.0005, Fig. 5B), maximum standardized uptake value (SUVmax) of bone marrow (AUC = 0.8155, P < 0.0001, Fig. 5C) and spleen (AUC = 0.7424, P = 0.0001, Fig. 5C) as measured by PET/CT.
Fig. 5
Neutrophil alkaline phosphatase (NAP) score was elevated in patients with aAOSD-nMAS compared to patients with DLBCL. A NAP score in patients with aAOSD-nMAS (n = 70) and DLBCL (n = 47). B, C Receiver operator characteristic (ROC) curve to clarify patients with AOSD-nMAS from patients with diffuse large B cell lymphoma (DLBCL). ****P < 0.0001. Data are presented as mean ± SD. AOSD adult-onset Still’s disease, MAS macrophage activation syndrome. Patients with aAOSD-nMAS: patients with active AOSD without MAS patients and AOSD-PRE-MAS. ****P < 0.0001. SUVmax the max of standard uptake value, AUC area under the curve
Comments (0)