
Remember me
We initially identified 56 patients with multiple myeloma, 33 were males and 23 females. The median age at diagnosis was 66.5 years (range: 40.3−82.7). Most were Caucasian (51/56) with two patients being African American and three Hispanic. Six patients had a concomitant diagnosis of diabetes mellitus. The median body mass index (the mass in kilogram divided by height in meters squared) was 28.6 (range: 20.4−45.2). The median number of PET/CT per patient was 4 (range: 1−24). High-risk cytogenetics were documented in 32 (57%) patients at some time point during the life history with the disease while 16 patients (28.6%) had evidence of EMD at some time during follow up of their multiple myeloma. Of the 16 patients with evidence of EMD based on imaging, histological confirmation of the diagnosis was confirmed in 13 of these patients. EMD was confirmed in the liver (3 patients), perinephric space (3 patients), soft tissues (4 patients), lymph nodes (3 patients) and pleural mass (1 patient). Some patients had evidence of EMD in more than one site and on multiple PET/CT imaging sets.
Initially, we wanted to determine the impact of the area of the ROI on the measurements of average pixel intensity. As can be seen from Fig. 1, the variability in pixel intensity between the largest and smallest ROI was 0.26% in the liver. Subsequently, we determined the intra-patient and inter-patient variability in pixel intensity in the brain and liver of patients in remission. We reasoned that the patients in remission would have the least variability and provide a useful baseline to evaluate the viability of our approach. There was very limited variability either in the brain or liver (Supplementary Fig. 1) across patients while in remission. We did not observe differences in the activity between the 5 ROI chosen in the brain and liver for patients in remission, with relapsed disease, in a partial response or with EMD (Supplementary Figs. 2 and 3). Within an individual patient, the pixel intensity in the brain and liver and the calculated B2LR remained stable if the disease was in remission, at least over a 2-year interval (Supplementary Fig. 4). We found no correlation between the brain pixel intensity due to glucose uptake and age for the range of 40 to 82 years (Pearson’s ρ = -0.09982, p = 0.4684) but liver uptake positively correlated with age (ρ = 0.3016, p = 0.0252). This led to an overall negative correlation of the B2LR with age (ρ = −0.2965, p = 0.0279). The BMI had an impact on the B2LR: a higher BMI was associated with less liver glucose uptake (ρ = −0.1694, p = 0.2119), higher uptake of radioactive glucose in the brain (ρ = 0.2377, p = 0.0778) and a positive correlation between the BMI and the B2LR (ρ = 0.2771, p = 0.0387). These results are likely compatible with the metabolic syndrome and insulin resistance that reduces hepatic glucose uptake, leading to higher blood glucose concentrations and perhaps higher glucose uptake in the brain. Normalization of the B2LR for the BMI at the time of the PET/CT resulted in an improvement in statistical significance when comparing the B2LR of patients in CR versus those with relapsed disease (p = 0.045), with all the other comparisons remaining significant with p values of < 0.05.
We divided the imaging data into 4 cohorts: remission, partial response, relapsed disease and EMD and compared the median B2LR between the groups. These results are summarized in Table 1. The B2LR is highest in patients in remission (median: 2.8296) and lowest in patients with the presence of EMD (median 2.7209), while patients with partial response or relapsed disease had intermediate values (2.7661 and 2.7802, respectively). Pairwise comparisons of the B2LR between groups show that the differences are highly statistically significant (except for medians comparing patients in a remission compared to those with relapse of their disease (Table 2). Given that the patients with partial response and relapsed disease have radiologic evidence of disease activity, we pooled these two groups together as ‘residual disease’ and compared them with patients in remission or with EMD. The results are reported in Table 3. The difference with patients who have EMD remains and there is statistically significant difference between patients in remission and those with residual disease (p = 0.0337).
Table 1 The brain to liver ratio (B2LR) across disease states in multiple myeloma.Table 2 Statistical comparison of of the B2LR means and medians across the disease states in multiple myeloma.Table 3 Statistical comparison of the B2LR across pooled data.The B2LR changes in individual patients as a function of disease activity. In Fig. 2 we provide a representative example of a patient with serial PET/CT imaging data. In remission, the B2LR was 2.977 which decreased to 2.801 with relapse, improved again to 2.868 with a response and dropped to 2.631 with the second relapse. As can be seen from Figs. 3 and 4, evaluation of the activity in the brain can mirror the disease state in all possible scenarios (from response, to stable disease and relapse) with distinct changes in intracerebral glucose uptake that are often identifiable with a visual inspection alone but can be better quantified using the ROI analysis described of the pixel intensity due to 18F-FDG activity in the brain and liver for comparison. Serial measurements of activity in the brain and liver with the B2LR calculation matches the disease activity in patients as shown in Fig. 5 and Supplementary Fig. 5.
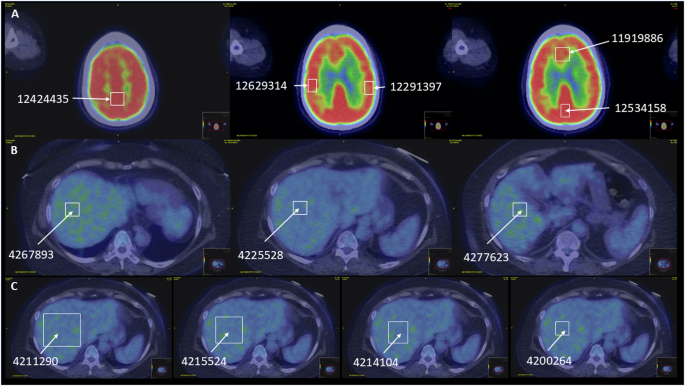
Fig. 2: The B2LR correlates with disease activity.
Serial PET/CT imaging in the same patients at various time points in their disease showing how the pixel intensity due to radioactive glucose uptake and the B2LR change with the value being highest while in remission (A), the value decreases with relapse (B), increases again as the disease comes under control (C), and decreases further with the second relapse (D).
Fig. 3: Generalizability of B2LR in response to changes in disease activity.
A, B provide examples from other patients where the brain uptake of glucose is low with active disease and improves with response to therapy.
Fig. 4: Disease stability and relapse.
Representative examples from additional patients showing stability of glucose uptake in a patient with stable disease in response to therapy (A) while in B decreased glucose uptake due to progressive disease is represented.
Fig. 5: B2LR and relapsed disease.
A representative set of images from a patient with a high B2LR while in remission and serial reduction in the ratio with worsening disease progression.
A comparison of the B2LR in remission versus residual disease across the patient population suggests that there is no specific B2LR threshold that is able to distinguish patients as being in remission or with any residual active disease (Table 2) or partial response across patients; the ratio appears to be dependent on the individual patient. However, when the B2LR is less than 2.5, the probability that the patient is in remission is only 3.6% at best, implying that most patients with a B2LR ≤ 2.5 have active disease. Moreover, our analysis suggests that B2LR ≤ 2.5 is associated with a high probability of EMD given that 13 of the 41 (31.7%) PET/CT images with evidence of this condition had such a B2LR value or lower. In contrast, only 8 out of 109 (7.3%) PET/CT with active disease (χ2 = 14.69, p = 0.000126) and 7 out of 91 (7.6%) with a partial response had such a low B2LR (χ2 = 12.6799, p = 0.00037). This threshold cannot distinguish between patients with partial response or active disease. The comparison between all 4 groups showed highly statistically significant differences and returned a χ2 = 25.2039, p = 0.000014.
In Fig. 6, it also appears that patients with a B2LR ≥ 3.0 are unlikely to have evidence of EMD. Only 1 patient with radiologic evidence of EMD had such a high B2LR compared to patients in remission (14/56, χ2 = 9.2163, p = 0.002399) or patients with active disease (χ2 = 9.2563, p = 0.002347) or patients with a partial response χ2 = 2.7049, p = 0.10004). This threshold can also imply a state of remission versus partial response (χ2 = 4.9816, p = 0.02562) since only 11% of patients in a partial response will have such a high B2LR compared to 25% of patients in remission. Finally, a comparison across the 4 groups gives a χ2 = 14.5366, p = 0.002259. We also combined the patients with partial response and relapsed disease using this B2LR ≥ 3 threshold. An analysis between the 3 groups (remission, residual disease and EMD), yields a χ2 = 8.7662, p = 0.012487.
Fig. 6: Distributions of the B2LR as a function of disease status.
The values of the B2LR for individual patients at each state of disease: A disease in remission, B relapsed disease, C partial response to therapy and D in the presence of EMD are plotted based on rank. The statistical comparisons between the groups are presented in Table 2.
As an internal check on the data, we estimated the impact of high-risk cytogenetics on the outcome of patients with multiple myeloma. As expected, patients with no evidence of high-risk cytogenetics had a median survival of 3613 days, compared to a median of 2896 days for patients who had high-risk cytogenetics at any time point in their disease (p = 0.05) (data not shown). Given the dichotomy in results with 2.5 < B2LR < 3.0 we sought to determine whether these thresholds have an impact on survival. The initial analysis was restricted to patients who underwent therapy with chimeric antigen receptor T cells (CAR-T). If the B2LR immediately before CAR-T therapy was ≤2.5, the median duration of response was 231 days, compared to 328 days for patients whose B2LR > 2.5 (p = 0.05) (Supplementary Fig. 6A). Subsequently, we divided the patients into those who at any time had a B2LR ≤ 2.5 and those whose B2LR > 2.5 at all-time points. We found that patients with a B2LR > 2.5 at all-times had a median OS of 3480 days compared to 2896 days for patients who at any time had a B2LR ≤ 2.5 (Gehan Breslow p = 0.0375) (Supplementary Fig. 6B). However, a B2LR > 3.0 at any time point had no impact on OS: median OS for patients who at any time had a B2LR > 3.0 was 3246 days compared to 3,301 days for patients who always had a B2LR < 3.0 (p = 0.31). Finally, we compared OS in patients who at any time had a B2LR ≤ 2.5 and B2LR > 3.0 with all other patients who had B2LR between 2.5 and 3.0 at all-time points. Patients with 2.5 ≤ B2LR < 3.0 had a median OS of 3480 days, while those patients who had B2LR ≤ 2.5 and B2LR > 3.0 at any time in their disease course had a median OS of 2896 days (p = 0.12).
Given the impact of the B2LR on this heterogenous population of patients, we wanted to test its validity using a larger cohort of patients with multiple myeloma who were treated with commercial CAR-T at Mayo Clinic in Rochester. We included all patients treated between June 2021 and May 2024 to provide us with at least 6-month of follow up. The demographic, clinical and laboratory characteristics of this cohort of patients is provided in Supplementary Table 1. Sixty-one patients received Ide-cel while 73 were treated with Cilta-cel. The two groups were well matched for gender and age at the time of treatment. More than 95% of patients were lenalidomide refractory and 77.1% of them had high-risk disease based on FISH. All patients had been treated with immunomodulatory agents, proteasome inhibitors and CD38 targeting monoclonal antibodies as required by the FDA label at the time of therapy. Bridging therapy was prescribed to 87% of patients and there was evidence of EMD in 23.3% of patients prior to CAR-T therapy. Twenty patients had a B2LR ≤ 2.5 prior to the start of lymphoid depletion chemotherapy. Patients treated with Ide-cel had a median of 5 (range: 3–13) prior lines of therapy, while patients treated with Cilta-cel had a median of 4 (range 3–9) prior lines of treatment (p = 0.019). There was no difference in the serum LDH (p = 0.7478), ferritin (p = 0.2746) bone marrow plasma cell burden (p = 0.292) and plasma cell labeling index (p = 0.9671) between the two cohorts prior to CAR-T.
We determined the impact of various established parameters and the B2LC ≤ 2.5 on both PFS and OS in this cohort using the Cox proportional hazard method. On univariate analysis, the serum ferritin (HR:13.49, p = 0.0002) [14, 15], the presence of EMD (HR:1.94, p = 0.0464), bone marrow MRD negativity at 1-month (HR: 2.36, p = 0.0125), MRD negativity at 3-months (HR: 3.96, p = 0.0123) and B2LR ≤ 2.5 (HR:3.02, p = 0.0027) were significant. On multivariate analysis for PFS, only the B2LR ≤ 2.5 (HR: 3.74, p = 0.0118) and being MRD negative at 3-months (HR: 1.55, p = 0.0476) retained significance. With respect to OS, on univariate analysis, the presence of EMD (HR: 2.38, p = 0.0333), B2LR ≤ 2.5 (HR: 5.52, p < 0.0001) and MRD negativity at 3-months (HR: 13.5, p = 0.0306) were significant. On multivariate analysis only the B2LR ≤ 2.5 remained significant (p = 0.0234) with respect to overall survival. In our analysis the use of neither Ide-cel nor Cilta-cel) had an impact on PFS (p = 0.4942) or OS (p = 0.4375) in the univariate analysis. Patients with a B2LR > 2.5 had a median PFS of 12 months while those with B2LR ≤ 2.5 has a median PFS of 4 months (log-rank test, p = 0.0026) (Fig. 7A). Similarly, patients with a B2LR > 2.5 had a median OS of 23 months compared to 8 months for patients with B2LR ≤ 2.5 (log-rank test, p < 0.001) (Fig. 7B).
Fig. 7: Survival analysis of 134 patients as a function of the B2R before CAR-T therapy.
In (A), the progression free survival as a function of the B2LR is presented. Patients with B2LR > 2.5 had a median PFS of 12 months compared to 4 months for patients with B2LR ≤ 2.5 (p = 0.0026). In (B), overall survival for patients with B2LR > 2.5 was 23 months versus 8 months for those patients with B2LR ≤ 2.5 before CAR-T (p < 0.001).
Comments (0)