
Remember me
Recent developments in categorization based on cell-of-origin (COO) [1] or comprehensive genetics-based analyses [2] have shown the remarkable heterogeneity of diffuse large B-cell lymphoma (DLBCL). Activated B-cell-like DLBCL (ABC-DLBCL), a subtype in COO-based classification, is characterized by the constitutive activation of NF-κB and JAK/STAT3 pathways, which could be attributed to recurrent mutations in B-cell receptor and toll-like receptor (TLR)/MYD88 signaling such as MYD88L265P [3]. Because of an inferior prognosis of this subtype to germinal center B-cell-like DLBCL (GCB-DLBCL) [4], tumorigenesis-specific strategies have been studied to make a clinical breakthrough [5].
Thus, we have recently focused on tumor progression locus 2 (TPL2), encoded by the MAP3K8 gene, which is activated upon stimulation of TLRs/MYD88 pathway in macrophages or B-lymphocytes [6]. Once TPL2 is activated downstream of MYD88, the TPL2/p105/ABIN2 complex is destabilized, promoting the proteasomal degradation of p105 to p50, which enhances NF-κB nuclear translocation [7]. Disengaged TPL2 also activates multiple MAPK pathways, upregulating transcription factors, such as c-Jun and ERK1/2, and orchestrating diverse cellular functions [8]. In addition to its pathogenic roles in inflammatory disorders [7], TPL2 has been implicated in neoplasms [6], including blood cancers, where the TLRs/MYD88 pathway may contribute to pathogenesis [9].
A previous study showed that TPL2 promotes cell proliferation and survival in TLR4/MYD88-activated B-cells [10], a putative COO of ABC-DLBCL. Recently, we have shown the oncogenic role of TPL2 using ABC-DLBCL cell line with MYD88L265P [11]. Therefore, we hypothesized that TPL2 could serve as a prognostic indicator and therapeutic target in MYD88 mutation-driven ABC-DLBCL. For this purpose, we utilized immunohistochemistry (IHC) to analyze the prognostic relevance of TPL2 protein expression in 79 DLBCL cases. Moreover, we investigated how TPL2 contributes to ABC-DLBCL tumorigenesis using DLBCL cell lines harboring MYD88L265P.
Description of SUBJECTS AND METHODS is provided in the Supplementary Information.
First, we evaluated TPL2 protein expression levels by IHC in 79 formalin-fixed paraffin-embedded samples of DLBCL cases (48 non-GCB and 31 GCB based on Hans’ classifier [12]). The determination of the threshold values for High- and Low-TPL2 is explained in the Supplementary Information. Twenty-seven and 52 cases were classified as Low- and High-TPL2, respectively. The results of IHC staining for representative cases of Low- and High-TPL2 are shown in Fig. 1a, b, respectively. The High-TPL2 percentage was similar among the COO-based diagnostic groups (67% for non-GCB vs. 64% for GCB). By contrast, an analysis using open-access, RNA-seq data of DLBCL specimens [2] indicated that higher MAP3K8 mRNA expression tended to be associated with ABC subtype in COO-based [1, 4] and MCD subtype (enriched in MYD88 and/or CD79B mutation) in genetics-based classification [2] (Fig. SA, B).
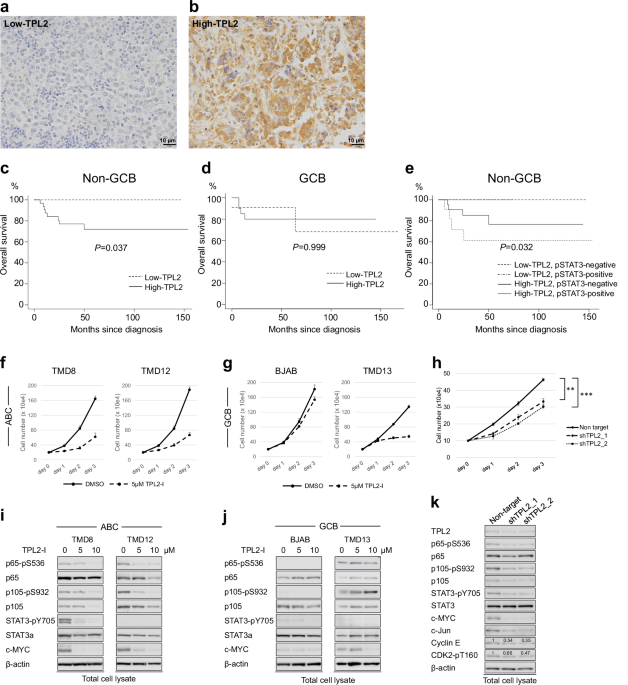
Fig. 1: Impact of TPL2 Expression on Prognosis and Survival in ABC-DLBCL.
a, b IHC analysis for TPL2 in DLBCL cases. Images of DLBCL tissues with relatively low (Low-TPL2) (a) and high (High-TPL2) (b) TPL2 protein expression levels by IHC staining, where the lymphoma cells were weakly and strongly immune-reactive (light brown) to cytoplasmic TPL2. Magnification of all images, ×400; Scale bar = 10 μm. c–e Kaplan–Meier curve analysis. Association between TPL2 protein expression level, which was analyzed by IHC, and survival time of patients with DLBCL with non-GCB (c) and GCB (d) subtypes, based on Hans’ classifier. Association between TPL2 protein expression level combined with STAT3 phosphorylation status of the tyrosine at position 705 (pSTAT3) using IHC and the survival time of patients with non-GCB-DLBCL (e). P-values were calculated using the log-rank test. STAT3, signal transducer and activator of transcription 3; TPL2, tumor progression locus 2. f, g The cell growth of ABC-DLBCL (TMD8 and TMD12) (f) and GCB-DLBCL (BJAB and TMD13) (g) cells treated under a specific TPL2 inhibitor (TPL2-I). The four kinds of cells, as indicated respectively, were cultured with DMSO as the control or the TPL2-I at a concentration of 5 μM for the indicated number of days. Viable cell numbers were counted and plotted. h Cell growth of TMD8 with TPL2 knockdown. The cell growth of TMD8 cells, which were lentivirally induced with nontarget shRNA as the control or two different MAP3K8 shRNAs (shTPL2_1 and shTPL2_2), respectively. After infection and selection with puromycin, the control and TPL2 knockdown cells, as indicated respectively, were cultured for the indicated number of days. Viable cell numbers were counted and plotted. i, j Immunoblot analysis of DLBCL cells under TPL2 inhibition. Immunoblot analysis of ABC-DLBCL cells (TMD8 and TMD12, as indicated) (i) and GCB-DLBCL cells (BJAB and TMD13, indicated above) (j) treated with the TPL2-I. The cells were incubated in the presence or absence of TPL2-I at the indicated concentrations for 22 h. The cells were then harvested, lysed, and subjected to an immunoblot analysis. The transferred membrane was repeatedly immunoblotted with specific antibodies against the proteins indicated in the panel. p65-pS536, phospho-S536-NF-κB p65; p105-pS932, phospho-S932-NF-κB1 p105; STAT3-pY705, phospho-Y705-STAT3. k Immunoblot analysis of TMD8 cells with TPL2 knockdown. TMD8 cells were lentivirally induced with nontarget shRNA as the control or two different MAP3K8 shRNAs (shTPL2_1 and shTPL2_2), respectively, in the same fashion as described above. After selection with puromycin for 6 h, the cells were harvested, lysed, and subjected to an immunoblot analysis. The transferred membrane was repeatedly immunoblotted with specific antibodies against the proteins indicated in the panel. By densitometric analysis, we determined the relative expression levels of Cyclin E and phosphorylated CDK2 at T160; the results are displayed in each panel.
Subsequently, we evaluated the relationship between TPL2 levels and clinical features (Table S1). High-TPL2 was positively associated with the presence of B symptoms (42% vs. 11%, P < 0.01) and extranodal involvement (75% vs. 52%, P < 0.05) compared with Low-TPL2. Kaplan–Meier analysis shows that the High-TPL2 group had a significantly inferior survival than Low-TPL2 in non-GCB (P < 0.05) but not in GCB (P = 0.999) (Fig. 1c, d). Additional analysis combined with phosphorylated STAT3 (pSTAT3) staining stratified the non-GCB-DLBCL cases into three groups with different prognoses (P < 0.05). High-TPL2 with positive and negative pSTAT3 had the worst and a moderate clinical course, respectively. Besides, the Low-TPL2 group had the most favorable survival, regardless of STAT3 activation (Fig. 1e).
TPL2 was expressed across DLBCL samples and a wide range of B-cell tumors, as reported previously (Fig. SC, SD) [13]. Hallmarks of ABC-DLBCL, such as enhanced IRF4 expression and NF-κB activation, confirmed by phosphorylated p65 (pp65) or p105 (pp105), were detected in non-GCB-DLBCL clinical samples and ABC-DLBCL cell lines. Additionally, the activation of c-Jun was more specifically associated with ABC subtype.
Next, we examined how specific TPL2 inhibition affects cell proliferation using two ABC-DLBCL (TMD8 and TMD12, harboring MYD88L265P) and two GCB-DLBCL (TMD13 and BJAB) cell lines. Consistent with our recent report [11], a specific TPL2 inhibitor (a potent ATP-competitive small-molecule Tpl2 inhibitor: TPL2-I) suppressed the cell growth of both ABC-DLBCL cell lines (Fig. 1f), where dose-response studies for cell survival (Fig. SE) and the effect on the TPL2/p105/ABIN2 complex (Fig. SF) determined the range of TPL2-I concentrations. Conversely, we observed inconsistent effects on the GCB-DLBCL cell lines (Fig. 1g). Besides, TPL2-silencing with MAP3K8-shRNAs similarly suppressed the cell proliferation of TMD8 cells (Fig. 1h). Moreover, the TPL2-I inactivated p65, p105, and STAT3 and significantly downregulated c-MYC in a concentration-dependent manner in ABC-DLBCL cells (Fig. 1i); however, these effects were equivocal in GCB-DLBCL cells (Fig. 1j).
The TPL2-overexpression experiments, which show that TMD8 cells stably expressing Flag-TPL2 counteract TPL2-I and increase p50 expression, also support our findings. Furthermore, TPL2-I suppressed c-Jun expression in a concentration-dependent manner, indicating c-Jun’s involvement in TPL2/p105 axis (Fig. SG). Additional experiments using inhibitors of pathways associated with TPL2/p105, including TLRs/MYD88/IKK and MAPKs, indicated that the ABC subtype depends on these pathways (Fig. SH). MAP3K8 knockdown consistently inactivated p65, p105, and STAT3 and downregulated MYC and c-Jun expression; furthermore, cell-cycle-related molecules, such as Cyclin E and CDK2, were also affected (Fig. 1k).
Consistently, TPL2-I induced G1 cell-cycle arrest in TMD8 cells in a time-dependent manner (Fig. 2a, left panel), peaking at 22 h post-treatment (right panel). Furthermore, quantitative PCR analysis shows that TPL2 inhibition caused CCNE, MYC, and CDK2 mRNA downregulation and CDKN1B (encoding p27) mRNA upregulation (Fig. 2b), compatible with results presented in Fig. 1k. These findings suggest that pharmacological inhibition or genetic silencing of TPL2 hindered cell proliferation by regulating Cyclin E and CDK2 expression, thereby inhibiting the cell-cycle transition from the G1 to S phase. Regarding this, MAP3K8 mRNA expression was moderately correlated with CCNE and CDK2 mRNA expression (Fig. SI, J) in the above-described RNA-seq datasets [2].
Fig. 2: The Mechanisms Involving TPL2 in the Tumorigenesis of ABC-DLBCL.
a Cell-cycle analysis of TMD8 cells treated with TPL2-I. TMD8 cells were incubated with DMSO as the control or TPL2-I at 5 μM for 0, 8, 16, or 22 h. The cells were then harvested and stained with a PI-based buffer for the cell-cycle analysis. Flow cytometry (FCM) was used to analyze the cellular DNA contents. The percentages of cells in the G1/S phase were recorded at each time point after treatment as indicated and are shown as columns (left panel, error bars = SE) obtained from three independent assays. Histograms of DNA contents from representative experiments under DMSO or TPL2-I treatment at indicated time points (right panel). *P < 0.05 vs. control by unpaired two-tailed Student’s t-test. b Quantitative real-time PCR (qPCR) for the genes in TMD8 cells affected by the treatment with TPL2-I. TMD8 cells were treated with DMSO as the control or the TPL2-I at 2.5 μM for 12 h, then harvested, and mRNA was extracted for cDNA synthesis. The mRNA expression levels of CCNE, CDKN1B, MYC, and CDK2 genes relative to TUBB gene as reference were analyzed using qPCR and are shown as columns (error bars = SE) obtained from three independent assays. *P < 0.05, ***P < 0.001 vs. control, by unpaired two-tailed Student’s t-test. c Immunoblot analysis of TMD8 cells treated with TPL2-I. The cells were incubated in the presence of TPL2-I at 5 μM for 0, 1, 2.5, 5, 10, and 21 h. The cells were then harvested, lysed, and subjected to an immunoblot analysis. The transferred membrane was repeatedly immunoblotted with specific antibodies against the proteins indicated in the panel. d ELISA for IL-6 and IL-10 concentrations in the cell-culturing media of TPL2 overexpressed ABC-DLBCL cells treated with TPL2-I. TMD8 cells were seeded at 2.5 × 10e5 cells/ml and incubated with DMSO as the control or in the presence of TPL2-I at 5 μM for 18 h. The supernatants of culturing media were then collected and subjected to ELISA for human IL-6 and IL-10, with quintuplication. IL-6 (left panel) and IL-10 (right panel) concentrations are displayed as box-and-whisker plots. The results are representative of experiments repeated at least thrice. ****P < 0.0001 vs. control, by unpaired two-tailed Student’s t-test. e QPCR for the genes in TMD8 cells affected by the treatment with TPL2-I. TMD8 cells were treated with DMSO as the control or the TPL2-I at 2.5 μM for 12 h, then, mRNA was harvested for cDNA synthesis. We analyzed IL6, IL10, STAT3, and JUN mRNA expression levels relative to the TUBB gene (as a reference) using qPCR; the results are displayed in columns (error bars = SE) and depict three independent assays. *P < 0.05, **P < 0.01, ***P < 0.001, ****P < 0.0001 vs. control, by unpaired two-tailed Student’s t-test. f Interaction between TPL2 and MYD88L265P. Immunoblot analysis of HEK293T cells stably expressing wild type (WT) or activating-mutant (MYD88L265P) in the presence or absence of Flag-TPL2 coexpression, as indicated in the panel, compared with HEK293T cells transfected with empty vector (EV) as a control. For each cell type, 1 × 10e6 cells exponentially growing were harvested, lysed, and subjected to an immunoblot analysis. The transferred membrane was repeatedly immunoblotted with specific antibodies against the proteins indicated in the panel. The expression levels of total proteins (p65, p105, and STAT3, respectively) and phosphorylated proteins (p65-pS536, pp65; p105-pS932, pp105; STAT3-pY705, and pSTAT3, respectively) were determined by densitometric analysis using ImageJ software (National Institutes of Health, Bethesda, Maryland, USA). The relative intensities of phosphorylated bands to those of corresponding total proteins are shown as bar graphs with values. The arrows indicate the position of Flag-TPL2. These procedures were performed in the same manner in the following experiments (Fig. 2g and Fig. SO), unless otherwise specified. g Dominant-negative TPL2 and its downstream signaling. Immunoblot analysis of HEK293T cells stably expressing mutant MYD88L265P proteins in the presence or absence of Flag-TPL2 WT or dominant-negative mutants (TPL2D270A, TPL2DA; TPL2T290A, TPL2TA) coexpression, indicated in the panel. h, i TPL2 inhibition in combination with other antitumor agents. Cell viability assay (CCK-8) results for TMD8 cells treated with etoposide (a topoisomerase II inhibitor) or ruxolitinib (a specific JAK1/2 inhibitor), cotreated with or without the TPL2-I. h TMD8 cells were incubated for 72 h with DMSO (control), or 25 nM etoposide, in the presence or absence of TPL2-I at the indicated concentration, respectively, and then subjected to a colorimetric assay. i TMD8 cells were incubated for 72 h with DMSO (control), or 2.5 μM ruxolitinib, in the presence or absence of TPL2-I at the indicated concentration, respectively, and then subjected to a colorimetric assay. For each column, the mean of triplicate assays was expressed as a percentage of the control; error bars = SE. A one-way ANOVA and Dunnett’s post-hoc testing were used to calculate differences between means. *P < 0.05, ***P < 0.001 vs. control. j A schematic model of molecular mechanisms by which the TPL2/p105/ABIN2 signaling complex is involved in ABC-DLBCL tumorigenesis with aberrant TLRs/MYD88 signaling. TPL2 kinase upregulates the transcription factor c-Jun through MAPK signaling activation and functionally promotes the constitutive NF-κB activation, which upregulates IL-6/IL-10 and induces JAK/STAT3 signaling activation in an autocrine-like manner, cooperatively leading to cell survival and proliferation of ABC-DLBCL cells. A star indicates recurrent MYD88L265P mutation.
Consistent with the IHC analysis showing a relationship between TPL2 expression and pSTAT3 with prognostic significance, TPL2-I induced time-dependent suppression of pSTAT3, where the STAT3 inactivation was induced at a later phase than that of pp65 or pp105 (Fig. 2c). As a previous report suggested that the IL-6/IL-10 secretion by DLBCL cells enhanced tumorigenicity by activating the JAK/STAT3 pathway in an autocrine-related manner [14], we subsequently focused on the mechanisms associated with IL-6/IL-10 production, triggering the activation of JAK/STAT3 signaling. IL-6 and IL-10 concentrations in the culture media were markedly decreased by the TPL2-I treatment (Fig. 2d). Furthermore, quantitative PCR analysis showed a significant reduction in IL6, IL10, STAT3 and JUN mRNA in TPL2-I treated TMD8 cells (Fig. 2e). A repeat study involving TPL2-overexpression further supported these results (Fig. SK). Another study that used the RNA-seq datasets [2] in which MAP3K8 was significantly correlated with IL6 and IL10 mRNA expression (Fig. SL, M), was also consistent with our results. Relatedly, an immunoprecipitation analysis implied a direct interaction between STAT3 and the TPL2/p105 complex (Fig. SN).
To explore the specific role of TPL2 in MYD88-driven malignancies, we evaluated the association between TPL2 and MYD88 via immunoblot using HEK293T cells. To better illustrate how the enzymic activity of TPL2 impacts hypothetical interaction, we utilized dominant-negative (DN, DA and TA) and constitutive-activated (ΔC) mutants of TPL2. Although TPL2 induction by itself did not elicit NF-κB and STAT3 activation, TPL2 activated these pathways when coexpressed with MYD88L265P (Fig. 2f). Moreover, TPL2 and MYD88 coexpression enhanced c-Jun expression. By contrast, these interplays were offset by the exogenous expression of TPL2-DNs, even under the coexpression of MYD88L265P, whereas the TPL2ΔC mutant significantly alters coexpression-induced activation (Fig. 2g and SO). These results suggested that TPL2 could exert its tumorigenicity in MYD88L265P- and kinase activity-dependent manner.
Lastly, we probed the therapeutic efficacy of TPL2-I against ABC-DLBCL cells combined with other anti-tumor agents in clinical use, i.e., etoposide and ruxolitinib, which induce G2 cell-cycle arrest and STAT3 inactivation, respectively (Fig. 2h, i). The cell proliferation assay showed that pretreatment with TPL2-I significantly enhanced the cell growth inhibition induced by etoposide and ruxolitinib, underscoring its potential as a therapeutic target.
The role of TPL2 in ABC-DLBCL harboring MYD88L265P remains unclear in blood cancers. Rousseau et al. demonstrated that Erk1/2 activation was induced by MYD88L265P mutant in TPL2 expression-dependent manner in B-cell malignancies with TLRs/MYD88 activation [15]. Consistent with our recent report [11], this work demonstrates the utility of IHC for TPL2 expression plus pSTAT3 as a prognostic indicator in ABC-DLBCL. Importantly, this study is the first to describe TPL2 as a bridging molecule that could tune the activation between TLRs/MYD88 and JAK/STAT3 pathways via IL-6/IL-10 regulation (Fig. 2j). Considering the importance of IL-6/IL-10 autocrine which enhances the interplay between NF-κB and STAT3 pathways [14], the TPL2/p105 axis may provide a clue to the biology of ABC-DLBCL.
Nevertheless, we should not overinterpret the above results. First, the range of TPL2-I concentrations used in the assays was relatively wide, potentially leading to unexpected off-target effects and exaggerated phenotypes. Second, the expression levels of TPL2 protein in the IHC study do not necessarily reflect its kinase activity.
Comprehensive multiomic studies will help address our remaining questions about this data. TPL2 could serve as a meaningful prognostic marker and a novel therapeutic target in ABC-DLBCL.
Comments (0)