
Remember me
The majority of the TP53mut MN (n = 603) were MDS (n = 374, 62.0%) followed by AML (n = 229, 38.0%). The median age at diagnosis was 69.0 years (interquartile range, IQR 62.0, 75.0) and 63.4% (n = 382) were male (Table 2).
Table 2 Clinical characteristics of TP53mut MDS and AML cohort.Compared to TP53 wild type (TP53wt), the median OS of TP53mut MN was poor independent of CK and blast categories (Supplementary Fig. 1A). In TP53mut cohort, allogeneic stem cell transplant was associated with longer OS compared to patients treated with intensive chemotherapy or hypomethylating agents with or without venetoclax (Supplementary Fig. 1B).
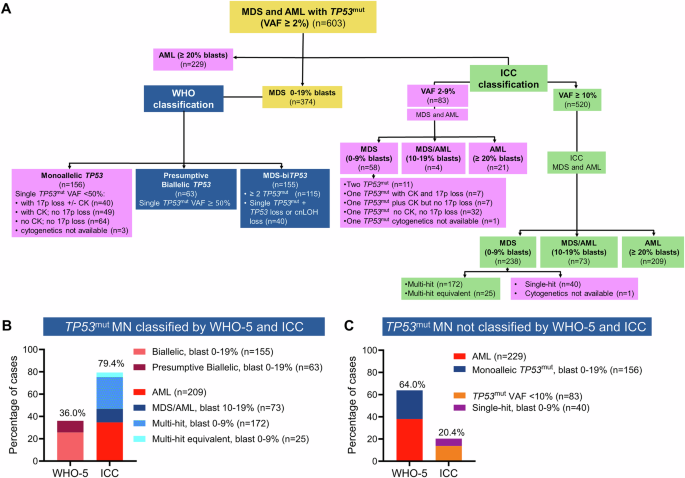
The majority of MDS and AML harboring TP53 mut are NOT acknowledged as TP53 mut MN by the WHO-5 classificationAccording to WHO-5 criteria, 155 MDS (25.7%) were classified as MDS-biTP53 as they harbored \(\ge\)2 TP53mut (n = 115) or 1 TP53mut plus confirmed LOH or cnLOH of the TP53 locus (n = 40). Additionally, 63 (10.4%) TP53mut MDS with VAF \(\ge\)50% were classified as presumptive MDS-biTP53 (Fig. 1A and Supplementary Fig. 2). In MDS with a single TP53mut with VAF < 50%, verification of loss of heterozygosity (LOH) or copy-neutral LOH (cnLOH) of the TP53 locus by CNV analysis is mandatory for defining MDS-biTP53 inactivation. In our cohort, 135 (22.4%) cases with single TP53mut with VAF \(<\)50% did not have CNV analysis and thus could not be classified as MDS-biTP53. Moreover, WHO-5 does not classify TP53mut AML as a distinct entity. Hence, 229 (38.0%) AML with TP53mut were grouped with other AML. In summary, applying WHO-5 would classify only 217 (36%) of 603 as TP53mut MN, while 386 (64.0%) were excluded (Fig. 1A–C).
Fig. 1: TP53-mutated (TP53mut) myeloid neoplasm (MN) classified by World Health Organization 5th edition (WHO-5) and International Consensus Classification (ICC).
A Consort diagram summarizing the classification of TP53mut MN by WHO-5 (blue) and ICC (green) criteria, along with disease subcategories presently excluded from each classification system, respectively (purple). B Percentage of MN with TP53mut that can be classified, and C not classified using WHO-5 and ICC criteria.
The majority of MDS and AML harboring TP53 mut are included in the ICC classification of TP53 mut myeloid neoplasmWe next performed a similar analysis using the ICC criteria. ICC mandates TP53mut VAF \(\ge\)10% and classifies TP53mut MN (n = 520) into three subcategories: multi-hit TP53mut MDS with BM and blood blast 0–9% (n = 238) as well as MDS/AML (BM or blood blasts 10–19%; n = 73), or AML (BM or blood blast \(\ge\)20%; n = 209) regardless of their allelic status. In the absence of comprehensive CNV analysis, CK is considered a multi-hit equivalent. Collectively, 479 (79.4%) MDS and AML with TP53mut were classified as “TP53-mutated MN”. One-hundred twenty-three (20.4%) cases with TP53mut VAF < 10% (n = 83) or single-hit MDS with blast 0–9% (n = 40) were classified along with other myeloid neoplasms (Fig. 1A–C and Supplementary Fig. 3A, B).
TP53 mut MDS and AML cases classified differently by WHO-5 and ICCWe next focused on TP53mut MDS and AML, that are classified differently by the two classifications. TP53mut AML with VAF \(\ge\)10% (n = 209) were included in the ICC but not in WHO-5 as a distinct entity. Furthermore, 188 (50.4%) of 373 TP53mut MDS cases were classified differently by ICC and WHO-5. Collectively, 407 (67.5%) cases were classified discrepantly between the two classifications (Fig. 2A).
Fig. 2: Concordance and divergence in the WHO-5 and ICC classification of TP53-mutated (TP53mut) myeloid neoplasm (MN).
A Sankey plot depicting the divergences between the two classifications of TP53mut MN. B heterogeneity in the overall survival (OS) of WHO-5 classified monoallelic TP53 when reclassified using ICC criteria. C According to WHO-5, 90.9% of TP53mut acute myeloid leukemia (AML) were classified as AML-myelodysplasia related (MR), followed by acute erythroid leukemia (AEL, 7%). D OS of AML with TP53mut with variant allele frequency (VAF) ≥ 10% was significantly poorer compared to AML TP53mut with VAF < 10%; and E OS of TP53mut AML was significantly worse than TP53 wild type (TP53wt) AML-MR.
Monoallelic MDS are excluded from the WHO-5 category of TP53mut MDS, as their survival is considered comparable to TP53wt MN. We analyzed WHO-5 defined 155 monoallelic TP53mut using the ICC criteria and observed a significant spread: 49 (31.6%) had TP53mut VAF < 10% and did not meet the ICC criteria for inclusion as TP53mut MN; whereas 36 (23.2%), 22 (14.2%), 25 (16.1%), and 22 (14.2%) cases were classified as single-hit, multi-hit, multi-hit equivalent, and MDS/AML, respectively (Fig. 2A, B). Cytogenetic data were not available in one patient, limiting their accurate placement.
Importantly, there were significant differences in survival between these groups (P = 0.001, Fig. 2B), demonstrating heterogeneity in cases classified as monoallelic TP53 loss as defined by WHO-5. Implementing the WHO-5 definition of monoallelic TP53mut MDS would underestimate the poor prognosis of 69 (52.1%) of the 155 cases (11.4% of the entire cohort). Similarly, median OS of WHO-5 classified biallelic/presumptive biallelic MDS was significantly different when reclassified according to ICC criteria (Supplementary Fig. 4A).
Factors driving differences in the WHO-5 and ICC of TP53 mut MDS and AMLAs the discordance between the two classifications was driven by differences in the prognostic significance of: (i) TP53mut AML; (ii) blood and bone marrow blast cut-off in MDS; (iii) 17p.13.1 deletion detected by cytogenetics; (iv) CK detected on metaphase cytogenetics; (v) TP53mut VAF cut-off, we analyzed survival outcomes of each of these groups with an aim to provide clarity.
Prognostic significance of TP53mut AMLAML contributed to 38.0% (n = 229) of the cohort. Considering the extremely poor prognosis, ICC includes TP53mut AML with VAF \(\ge\)10% (n = 209), as a distinct entity in TP53mut MN, regardless of allelic status; whereas TP53mut AML with VAF < 10% (n = 20) were excluded from the ICC (Fig. 2C). Within our cohort, the median OS of TP53mut AML VAF ≥ 10% was 4.2 months compared to 14.4 months for AML with TP53mut VAF < 10% (Fig. 2D).
On the other hand, WHO-5 classifies TP53mut AML with other AML categories and suggests further evidence is required for determining that biTP53 status is per se as ‘AML-defining’. Hence, applying the WHO-5 criteria, 209 (90.9%) of TP53mut AML were classified as AML-myelodysplasia related (AML-MR), 16 (7%) as acute erythroid leukemia (AEL), and 2 (0.9%) as AML with maturation. Additionally, three cases were classified as AML without maturation (n = 1, 0.4%), AML with minimal differentiation (n = 1, 0.4%), and AML with KMT2A-rearrangement (n = 1, 0.4%) (Fig. 2A, C).
As the vast majority of TP53mut AML would be re-classified as AML-MR according to WHO-5, we compared the survival of TP53mut AML with TP53wt AML-MR. The median survival of TP53mut AML was significantly poorer compared to TP53wt AML-MR (4.7 vs. 18.3 months; P < 0.0001) (Fig. 2E). Collectively, these results indicate that TP53mut AML is a genetically defined subentity with extremely poor survival.
Prognostic significance of the blast percentage cutoffs in MDSAnother driver of divergence between the two classifications is the bone marrow and/or PB blasts cut-off. The underlying assumption by the WHO-5 is that the prognosis of biTP53mut MDS is homogenously poor irrespective of blast percentages between 0 and 19%. Conversely, the survival of monoallelic TP53mut MDS, regardless of the blast category, was considered comparable to TP53wt MDS and therefore, excluded from MDS with biTP53mut. In contrast, the ICC acknowledges the importance of the allelic status in the context of specific blast cut-offs. For example, it mandates multi-hit status for MDS with blast 0–9%, but not for MDS/AML and AML, for inclusion in TP53mut MN.
We evaluated whether the blast cut-off retains significance when the WHO-5 criteria of the allelic status were used. There was no significant OS difference between biallelic and presumptive biallelic TP53mut, hence the subgroups were combined during further analysis (Supplementary Fig. 4B). Median OS of biallelic and presumptive biallelic TP53-inactivation was significantly shorter for BM or blood blast 10–19% compared to 0–9% (7.4 vs. 12.1 months, P = 0.001) (Fig. 3A). Similarly, the median OS of monoallelic TP53mut was significantly poor in cases with BM or blood blast 10–19% compared to 0–9% (6.8 vs. 16.2 months, P = 0.01) (Fig. 3B), while median OS of monoallelic and biallelic inactivation was comparable in cases with blood or bone marrow blast 10–19% (6.8 vs. 7.4 months; P = 0.17) (Fig. 3C). However, we did observe significant survival difference between biallelic inactivation and monoallelic mutations in cases with blast 0–9% (12.1 vs. 16.2 months; P < 0.0001) (Fig. 3D). Collectively, the results provide compelling evidence that blast percentage remains an important predictor of poor outcome in addition to allelic status.
Fig. 3: Interaction between blast cut-off and WHO-5 allelic status of TP53-mutated myelodysplastic syndrome (MDS).
A Within the WHO-5 biallelic/presumptive biallelic inactivation group, the median overall survival (OS) of MDS with 10–19% blasts was significantly poorer compared to MDS 0–9% blasts. B Within the WHO-5 monoallelic group, the median OS of MDS 10–19% blasts was significantly poorer compared to MDS 0–9% blasts. C In the MDS 10–19% blast group, the median OS of biallelic/presumptive biallelic inactivation was comparable to that of monoallelic mutations. D While in the MDS 0–9% blast group, the median OS of biallelic/presumptive biallelic inactivation was significantly poorer compared to monoallelic mutations.
We next characterized the cytogenetic profile and outcome of TP53mut MN using ICC criteria. TP53mut with VAF ≥ 10% (n = 520) cases included 238 (39.5%) of MDS (BM blasts 0–9%), 73 MDS/AML (12.1%), and 209 AML (34.7%). Furthermore, the impact of blast percentage is also reflected in the corroborating genomic aberrations seen with the various subgroups, along with survival outcomes. For example, poor-risk cytogenetic features such as CK, MK, 17p del, and multi-hit status were enriched in MDS/AML and AML compared to MDS (BM blasts 0–9%) (Fig. 4A, B). Similarly, TP53mut VAF was higher MDS/AML and AML compared to MDS (Fig. 4C). The median OS of TP53mut MDS/AML and AML was significantly poorer compared to TP53mut MDS (BM blasts 0–9%) (4.2 vs. 7.4 vs. 12.3 months; P < 0.0001) (Fig. 4D). Consistent with prior reports, the median OS of multi-hit MDS (BM blasts 0–9%) was significantly poorer compared to single hit (11.6 vs. 25.4 months, P = 0.007, Fig. 4E), whilst the survival of TP53mut AML was poor regardless of allelic status (Fig. 4F). Furthermore, across the blast percentage categories, survival was comparable between multi-hit equivalent and those with multi-hit status (Fig. 4E–G). Collectively, multi-hit or multi-hit equivalent MN had poor survival in cases with TP53mut VAF ≥ 10%.
Fig. 4: Interactions between blast percentage, TP53 mutation (TP53mut) variant allele frequency (VAF), and allelic status based on the ICC criteria and survival of TP53mut myelodysplastic syndrome (MDS) and acute myeloid leukemia (AML).
A Adverse risk cytogenetic features. BTP53mut multi-hit and multi-hit equivalent. C Higher TP53mut VAF were more prevalent in TP53mut MDS 10–19% blasts and AML compared to MDS 0–9% blasts. D overall survival (OS) of TP53mut MDS 10–19% blast and AML was significantly poorer compared to MDS 0–9% blasts. Overall survival of patients with a marrow/blood blast count of E 0–9%, F ≥20%, and G 10–19% according to allelic status.
Verification of 17p13.1 loss detected on cytogenetics by CNV analysisIn cases with a single TP53mut with VAF < 50%, WHO-5 mandates confirmation of 17p13.1 deletion by an additional CNV analysis method (e.g., FISH, SNP, or NGS), and mere detection of 17p13.1 deletion on karyotype is not sufficient to demonstrate inactivation of the other allele [15]. However, in the absence of confirmatory testing, no explicit guidelines surrounding the further classification of these cases have been provided. Conversely, the ICC does not mandate such confirmation, and both classifications do not elaborate on the need for CNV analysis in the context of a single TP53mut with VAF < 50% without 17p13.1 deletion on karyotype.
Metaphase karyotype was available in 600 (99.5%) and TP53 CNV data were available in 138 (22.9%) cases. Conventional karyotype detected loss at the TP53 locus in 240 (40.2%) cases, and 83 (34.6%) of these had CNV analysis, which confirmed LOH in 78 (94%) of the evaluable cases. Furthermore, CNV analysis detected LOH or copy neutral LOH (cnLOH) in 14 (26.9%) of 52 evaluable cases without 17p deletion on karyotype (Fig. 5A). Importantly, in cases without 17p13.1 deletion on karyotype, striking enrichment of LOH/cnLOH (by CNV analysis) was detected in cases with CK compared to cases without CK (44.4% vs. 0%; P = 0.0007) (Fig. 5B). At the same time, all 14 cases with LOH/cnLOH across TP53 locus on CNV, without 17p del on karyotype, had CK.
Fig. 5: Validation and prognostic significance of 17p13.1 deletion and complex karyotype (CK) in TP53-mutated (TP53mut) myeloid neoplasm (MN).
A Copy number variation (CNV) analysis confirmed 17p13.1 deletion in 94% of cases where it was observed on metaphase cytogenetics. Additionally, CNV analysis identified loss of heterozygosity (LOH) or copy-neutral LOH (CnLOH) across the TP53 locus in 26.9% of cases without 17p13.1 deletion on metaphase cytogenetics. B In cases without 17p13.1 deletion detected on karyotype, LOH/CnLOH was significantly enriched in the presence of CK compared to those without CK. C Median overall survival (OS) of patients with a single TP53mut with variant allele frequency (VAF) < 50% with either 17p13.1 deletion or CK was comparable to cases with biallelic/presumptive biallelic TP53 inactivation.
The sensitivity, specificity, positive and negative predictive value of metaphase cytogenetics to detect loss across the TP53 locus were 84.8% (95% CI 75.8–91.4%), 88.4% (74.9–96.1%), 94.0%, and 73.1%, respectively. Collectively, these results suggest that validation of LOH across the TP53 locus by CNV analysis may not be required in the majority of cases with 17p13.1 deletion detected on metaphase karyotype, except complex rearrangements including derivative chromosomes. In cases without 17p del on karyotype, CK can be a reasonable surrogate marker, as none of the cases without CK and 44.4% cases with CK had LOH/CnLOH across the TP53 locus.
Next, we assessed the number of biallelic inactivations that would be underestimated in our MDS cohort in the absence of comprehensive CNV analysis. Of the 374 MDS cases, 218 (58.2%) cases had \(\ge\)2 TP53mut with each VAF \(\ge\)2% (n = 115), single TP53mut plus LOH or cnLOH across TP53 locus (n = 40) or one mutation with VAF \(\ge\)50% (n = 63) and were hence able to be classified as biallelic or presumptive biallelic inactivation, respectively (Supplementary Fig. 2). The remaining 178 (47.6%) MDS had single TP53mut with VAF < 50%. Fifty-nine cases had 17p loss on metaphase karyotype, and CNV method confirmed LOH across the TP53 locus in 91% (n = 20) of 22 evaluable cases. Of the 116 (31.1%) cases with single TP53mut VAF < 50% without 17p13.1 loss on metaphase karyotype, CNV information was available in 20 cases, and 3 (15%) cases had LOH (n = 1) or cnLOH (n = 2). Importantly, LOH/cnLOH detected by CNV analysis was enriched in cases with single TP53mut VAF < 50% with CK without 17p13.1 loss on karyotype compared to their counterparts without CK (33.3% vs. 0%; P = 0.07). In summary, in the absence of comprehensive CNV data, biallelic inactivation would have been missed in 14 cases with single TP53mut VAF < 50% with CK but without 17p loss, which accounts for 4.0% of the total 374 MDS cases. However, the absence of this information is less likely to underestimate the poor prognosis of these cases, as shown below, as the median OS of single TP53mut VAF < 50% with CK is poor and comparable to biallelic inactivation.
Prognostic significance of 17p loss and CK detected on metaphase cytogeneticsOf the 178 MDS with TP53mut VAF < 50%, 37 (20.8%) had 17p loss on karyotype, and the median OS of these cases was comparable to biallelic or presumed biallelic TP53 loss (11.0 vs. 9.9 months; P = 0.63) but significantly poorer than those with monoallelic TP53mut VAF < 50% without 17p loss and/or CK on metaphase cytogenetics (9.9 vs. 33.4 months; P < 0.0001) (Fig. 5C). Furthermore, 52 (29.2%) cases had CK without 17p loss on karyotype analysis, while 64 (40.0%) cases did not exhibit either abnormality. The median OS of single TP53mut VAF < 50% with CK without 17p loss (n = 52) was comparable to those with 17p13.1 deletion on karyotype (10.4 vs. 11.0 months; P = 0.39) but significantly poorer than those cases with monoallelic TP53mut without 17p loss or CK (10.4 vs. 33.4 months; P < 0.0001) (Fig. 5C). Collectively, these results indicate that in MDS cases with single TP53mut VAF < 50%, the presence of CK can be considered a practical surrogate for biallelic TP53 inactivation.
Differences in classification based on TP53mut VAF cut-offThe ICC mandates the inclusion of TP53mut with VAF \(\ge\)10% into the category of TP53mut MN, whereas the WHO-5 does not have a similar threshold. Within our cohort, 83 (13.8%) of 603 TP53mut MDS and AML had TP53mut VAF < 10% and were not classified as TP53mut MN by ICC (Fig. 1A). These 83 cases included AML (n = 21), MDS/AML (n = 4) and MDS with 0–9% blasts (n = 58), which are currently classified by ICC as AML-MR (n = 20), MDS-EB (n = 14), MDS not otherwise specified (NOS) multilineage dysplasia (MLD, n = 14), MDS NOS single lineage dysplasia (SLD, n = 9), MDS del 5q (n = 6), MDS SF3B1 (n = 7) and clonal cytopenia of undetermined significance (CCUS) (n = 6).
The median OS of TP53mut AML, MDS with \(\ge\)2 TP53mut or single TP53mut plus 17p13.1 deletion and/or CK (n = 50) was significantly shorter compared to that of single TP53mut VAF < 10% without CK and 17p loss (n = 33) and was comparable to TP53mut VAF ≥ 10% (14.1 vs. 48.8 vs. 7.8 months, P < 0.0001) (Fig. 6A), whereas the median OS of monoallelic TP53mut VAF < 10% without CK was comparable to TP53wt MDS (Fig. 6B).
Fig. 6: The median OS of biallelic or single TP53mut VAF < 10% plus CK was significantly shorter compared to that of single TP53mut VAF < 10% without CK and was comparable to TP53mut VAF ≥ 10%.
A The median OS of AML or multi-hit/multi-hit equivalent MDS was significantly worse compared to MDS cases with a single TP53mut VAF < 10% without 17p loss or CK, and was comparable to TP53mut VAF ≥ 10%. B In a TP53mut VAF < 10% MDS, the median OS of biallelic or monoallelic with CK was significantly poor. While the median OS of monoallelic TP53mut VAF < 10% without CK was comparable to TP53 wild type (TP53wt) MDS.
A recent study suggested that a TP53mut VAF \(\ge\)20% is associated with poor outcome and may be considered as presumptive biallelic [17]. In line with the literature, the median OS of TP53mut VAF \(\ge\)20% was significantly poorer compared to TP53mut VAF < 20% (7.6 vs. 14.4 months; P < 0.0001) (Supplementary Fig. 5A). However, VAF \(\ge\)20% should not be equated with biallelic equivalent due to the complex interaction of VAF, allelic status, blast percentage, and CK.
For cases with biallelic and monoallelic TP53mut plus CK, the median OS was poor regardless of whether the VAF was \(\ge\)20% or <20% (9.6 vs. 14.1 months; P = 0.01), although it was shorter in the VAF \(\ge\)20% group. In contrast, for monoallelic TP53mut without CK, the median OS was significantly longer regardless of VAF \(\ge\)20% vs. < 20% (33.4 vs. 37.3 months; P = 0.64) (Supplementary Fig. 5B). This highlights that biallelic status remains a key driver of poor prognosis, irrespective of VAF.
The poor prognosis of VAF \(\ge\)20% is primarily due to the enrichment of MDS-EB2, AML, CK, biallelic, and monoallelic inactivation with CK (Supplementary Fig. 5C–E). However, monoallelic TP53mut without CK and VAF \(\ge\)20% are associated with longer survival. Therefore, considering TP53mut VAF \(\ge\)20% as equivalent to biallelic inactivation could overestimate the poor prognosis of monoallelic mutation without CK.
Comments (0)