
Remember me

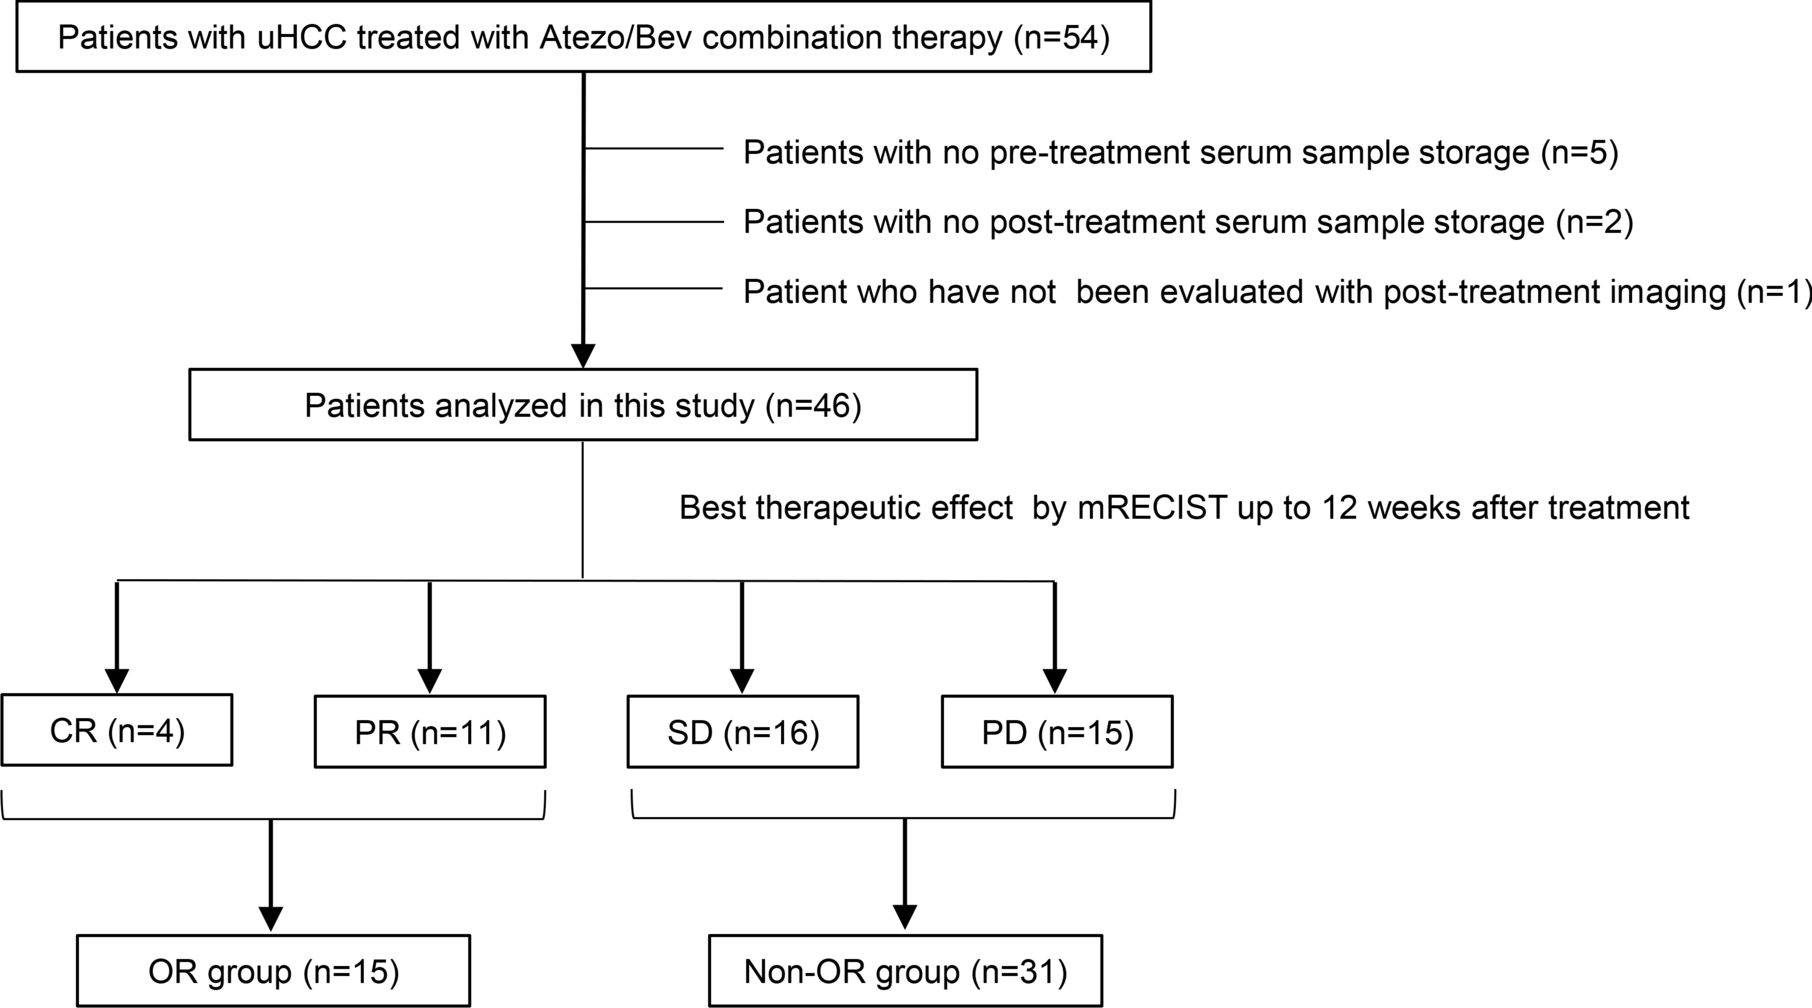

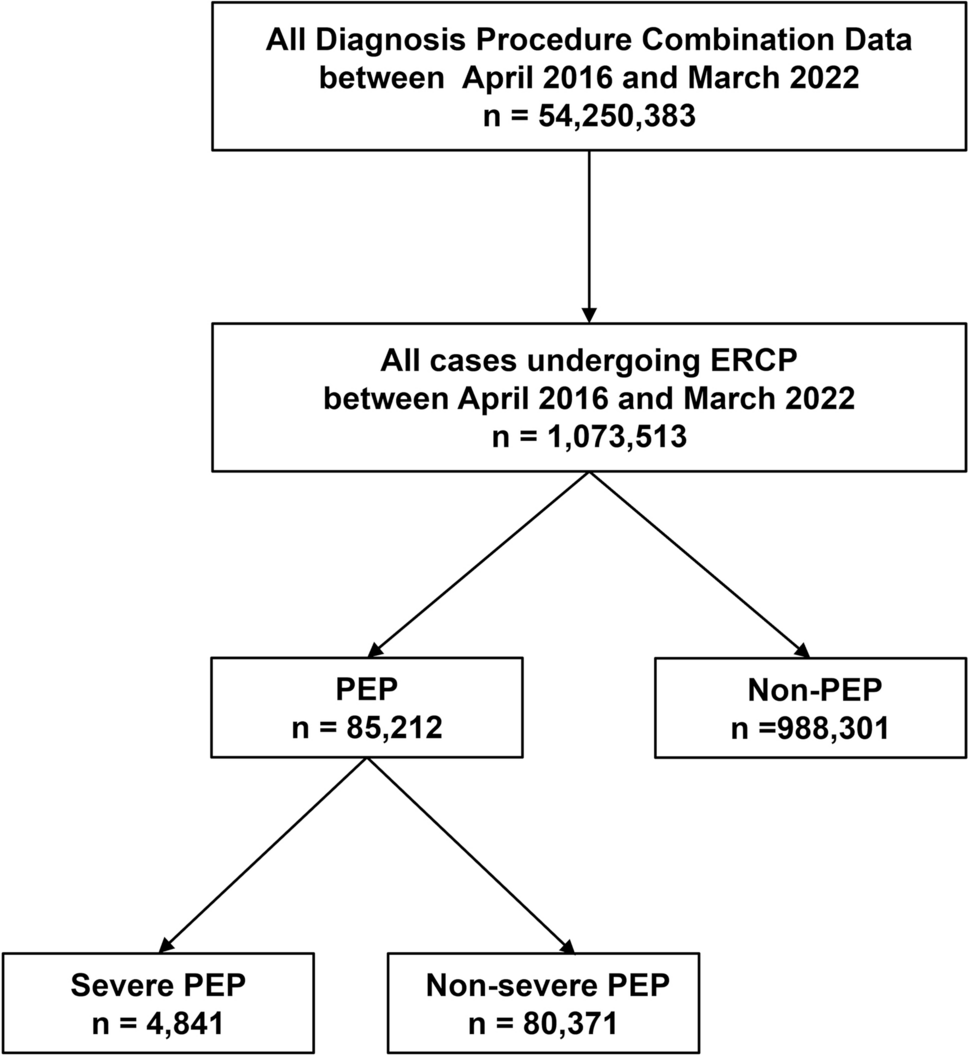
This study retrospectively analyzed 83 patients with PPI-refractory NERD who visited Tohoku University Hospital between July 2019 and July 2024. These patients presented with typical reflux symptoms, such as heartburn, regurgitation, and chest pain. All patients underwent upper endoscopy either prior to the initiation of PPI or P-CAB therapy, or after discontinuation of these medications for at least two weeks. They underwent 24-h MII-pH monitoring and high-resolution impedance manometry (HRIM) under off-PPI conditions, within six months of endoscopic examination. After excluding four cases (one patient with eosinophilic esophagitis, one postoperative case, and two who discontinued MII-pH monitoring before 24 h), the final study population included 79 patients (Fig. 1).
Fig. 1
Flowchart of the study population. Among 83 patients with PPI-refractory NERD initially enrolled, four cases were excluded: one patient was diagnosed with eosinophilic esophagitis, one was a postoperative case, and two discontinued MII-pH monitoring before completing 24 h. Consequently, the final analysis included 79 patients
This study was approved by the Ethics Committee of the Tohoku University Graduate School of Medicine (2024-1-421).
Patients with PPI-refractory NERDPatients with PPI-refractory NERD were defined as those who continued to experience heartburn, regurgitation, or chest pain despite at least 8 weeks of optimized acid-suppressive therapy, consisting of either a double-dose PPI regimen (rabeprazole 20 mg/day) or a standard dose of a P-CAB (vonoprazan 20 mg/day). Specifically, patients with a Frequency Scale for the Symptoms of GERD (FSSG) score of 8 or higher following treatment were classified as PPI-refractory [17, 18].
24-h MII-pH monitoringPatients underwent 24-h MII-pH monitoring under off-PPI conditions (without PPI or P-CAB treatment for at least two weeks) using a ComforTec MII-pH catheter (ZAN-BG-44, Sandhill Scientific Inc., Highland Ranch, CO, USA).
Before MII-pH monitoring, an HRIM catheter was inserted transnasally to locate the LES. The MII-pH catheter included two pH sensors for measuring esophageal and gastric pH, as well as six impedance sensors. The pH electrodes were calibrated with pH 4.0 and pH 7.0 buffer solutions (Sandhill Scientific Inc.) before transnasal insertion. The catheter was positioned with the esophageal pH sensor placed 5 cm above the LES and the impedance channels at 3, 5, 7, 9, 15, and 17 cm above the LES. The placement of the pH sensor was confirmed via chest radiography. Data were recorded using a portable recording device, and patients were instructed to maintain their usual diet and daily activities during the monitoring period. The patients were also asked to press the event button on the device if reflux symptoms occurred during the recording period. The catheter was removed after 24 h of monitoring [19].
Analysis of 24-h MII-pH monitoring dataAll MII-pH recordings were analyzed using BioVIEW® software (Sandhill Scientific Inc.) with Auto Scan, followed by manual review [20]. The presence of liquid or gas in the esophagus was recorded as decreased and increased impedance, respectively. Liquid reflux was defined as a reduction in impedance by ≥ 50% from baseline, propagating in a retrograde manner across at least two consecutive sensors from the most distal impedance sensor. Acid reflux was defined as reflux with a drop in pH to < 4, or if the pre-reflux pH was already < 4, maintaining a pH < 4 during the event. Non-acid reflux was defined as liquid reflux with pH ≥ 4. Acid exposure time (AET) was calculated as the percentage of time with pH < 4 during the 24-h recording, with abnormal AET set at > 4.2% under off-PPI conditions, based on previous studies [20]. Liquid reflux, as measured for bolus exposure, was defined as a decrease in impedance of > 50% from baseline at the most distal impedance sensor (3 cm above the LES) and propagating retrogradely through at least two consecutive sensors [21].
The patients were instructed to remain upright during the day, either sitting or standing, until bedtime. The time spent upright was defined as “daytime,” while the time spent in the supine position during sleep was defined as “nighttime.”
SGB in MII-pHBredenoord et al. defined SGB during pH-impedance monitoring as a rapid increase in impedance of > 1000 ohms above baseline, followed by a rapid return to baseline in a retrograde manner [2]. This indicates that air swallowed into the distal esophagus quickly returns to the proximal esophagus, distinguishing it from gastric belching, in which air moves from the stomach to the proximal esophagus and is expelled through the mouth [22]. In the present study, we manually counted the number of SGB events over 24 h to ensure that gastric belching was not included in SGB.
Excessive SGB and SGB severityBased on previous studies, patients with > 13 SGB events during 24-h MII-pH monitoring were classified as having excessive SGB [16, 23]. The severity of excessive SGB over 24 h was also categorized as mild (14–49 episodes), moderate (50–99 episodes), or severe (≥ 100 episodes) [24].
Reflux in relation to SGBSGB occurring within 5 s after a reflux event was defined as “SGB during reflux,” while SGB not associated with reflux was termed “SGB without reflux.” SGB followed by reflux within 5 s was defined as “SGB-inducing reflux” [24].
SGB-induced reflux and its contribution to AET were also assessed as described above. We evaluated the contribution of SGB-induced reflux to the total AET. The acid exposure associated with these events was measured and the proportion of AET attributable to SGB-induced reflux was calculated as a percentage of the total AET in each patient. The proportion of AET related to SGB-induced reflux was then analyzed in the excessive SGB group.
NERD subtypesBased on the MII-pH monitoring results under off-PPI conditions, patients were classified according to esophageal AET findings and the association between reflux events and symptoms, as previously described.
We assessed reflux symptom association using the Symptom Index (SI) and Symptom Association Probability (SAP) for typical esophageal reflux symptoms. SI is defined as the proportion of reflux-related symptoms relative to the total number of symptoms. SAP, calculated using Fisher’s exact test, determines the probability of symptom–reflux association by evaluating whether each consecutive 2-min period includes a symptom and/or reflux. A positive symptom–reflux association was defined as either SI > 50% or SAP > 95% [25, 26].
We classified the patients into NERD subtypes based on AET and the presence of symptom association indices. True NERD was defined as an AET of ≥ 4.2%. Patients with an AET of < 4.2% but with a positive SI or SAP were classified as having reflux hypersensitivity (RH), whereas patients with an AET of < 4.2% and negative SI and SAP were categorized as having functional heartburn (FH) [27].
Frequency Scale for the Symptoms of GERD (FSSG) QuestionnaireOn the same day as MII-pH monitoring and HRIM, patients completed the self-administered FSSG to assess their symptoms. Each symptom was scored based on its frequency: none (0), rarely (1), sometimes (2), often (3), or always (4) [18]. The reflux-related score was calculated as the sum of seven specific items (Nos. 1, 4, 6, 7, 9, 10, and 12), while the dyspepsia-related score was based on five items (Nos. 2, 3, 5, 8, and 11). The total score represented the sum of all 12 questionnaire items.
High-resolution manometryHRM was performed using a catheter and measurement system (InSIGHT G3®, Sandhill Scientific Inc.) equipped with 32 intraluminal pressure sensors and eight impedance channels (four pairs). The test was conducted according to the Chicago Classification version 4.0 protocol. Resting LES pressure was measured by inserting a catheter with the patient in a seated position, without swallowing for 20 s. The baseline LES pressure was recorded at the end expiration [28]. The integrated relaxation pressure (IRP) is a measure of deglutitive relaxation, defined as the lowest mean axial pressure over 4 s, whether continuous or discontinuous, across the LES during the 10-s period following a swallow. The distal contractile integral (DCI) was measured as the average value of > 10 swallows with the patient in the supine or right lateral position and > 5 swallows in the sitting position. The DCI values were automatically calculated using software [28]. Ineffective esophageal motility (IEM) was diagnosed according to the criteria from the Chicago Classification version 4.0.
Evaluation itemsA comparative analysis was conducted on the study subjects based on the following parameters. In addition to analyzing all cases, these evaluations were specifically performed for patients with true NERD.
1.Prevalence of excessive SGB, clinical characteristics, and association with NERD subtypes
We calculated the prevalence of excessive SGB among patients with PPI-refractory NERD and analyzed the clinical background of those affected. Additionally, we assessed the severity distribution of excessive SGB based on predefined criteria. Furthermore, we evaluated the prevalence of excessive SGB within different NERD subtypes, including true NERD, RH, and FH.
2.FSSG score analysis
We compared FSSG scores, focusing on the reflux and dyspepsia-related subscales and the total FSSG score, to evaluate the differences in symptoms between patients with and without excessive SGB.
3.Esophageal reflux factors and motility in excessive SGB
We compared factors related to esophageal reflux, as measured by MII-pH monitoring, between patients with and without excessive SGB. We also examined the differences in esophageal motility parameters, as assessed by HRIM, between these two groups.
4.Association between SGB and esophageal reflux
We determined the mean proportion of each SGB type—those preceding reflux, those occurring without reflux, and those inducing reflux—in each patient with excessive SGB.
Statistical analysisContinuous and categorical variables are expressed as means ± standard deviation or medians (IQR) and frequency (%), respectively. Categorical variables were compared between groups using the chi-squared test, whereas Fisher’s exact test was used for small sample sizes. For continuous variables that did not follow a normal distribution, the Mann–Whitney U test was applied.
All analyses were performed using R software, version 4.4.1 (R Core Team, Vienna, Austria). Statistical significance was set at p < 0.05.
Comments (0)