
Remember me
This analysis is based on data from the PILGRIM study (Impact of Prescription Quality, Infection Control and Antimicrobial Stewardship on Gut Microbiota Domination by Healthcare-Associated Pathogens; ClinicalTrials.gov identifier: NCT03765528), a multicenter, international, prospective cohort study conducted from 2019 to 2022. The PILGRIM study aimed to examine the effects of antibiotic treatment on the gut microbiota, with a focus on its role in the development of colonization and domination of the gut by healthcare-associated pathogens. The study involved ten sites located in six countries: Germany, Sweden, Latvia, Norway, Israel, and Canada. Patients included in the study were those admitted to the hospital with a planned or suspected high likelihood of receiving systemic antibiotic treatment for a duration of ≥ 5 days within the first 10 days of their stay, but without recent antibacterial exposure (≤ 14 days) except for prophylaxis with trimethoprim/sulfamethoxazole. Additionally, patients who have received courses of systemic antibacterials for 7 days or more within the past two months were excluded. Detailed inclusion and exclusion criteria can be found in the supplementary material (see Supplementary Table 1). The likelihood of antibiotic exposure was estimated based on the recruiting physician’s perspective on risk factors (e.g. comorbidities) and admission reason (e.g. chemotherapy). Moreover, recruitment focused on departments with typical high rates of antibiotic treatments (e.g. hematology and oncology). Upon initiation of this sub-analysis a total of 1600 patients had been recruited. Clinical data were collected for each patient in a standardized electronic case report form (eCRF) and longitudinal stool sample collection was performed during the study. If an antibiotic treatment was initiated during the study period, an in-depth data documentation and sample collection was triggered. The clinical dataset included a wide range of variables, including patient demographics, comorbidities, medication use and preceding hospitalizations. Results of the sample analysis were not used for this sub-analysis.
The PILGRIM study was approved by the ethics committees of all participating sites (ID of lead committee in Cologne: UKK 18–316) and written informed consent of all participants was obtained prior to any study related measure. The study was conducted in accordance with the Declaration of Helsinki.
Data preparationData analysis and score construction was performed with the Statistical Package for Social Sciences (SPSS®) of the International Business Machine Corporation (IBM Inc.®) Version 28.0.0.0. The dataset including 1600 patient cases was carefully monitored and cleaned to remove implausible or incomplete entries. Missing values were coded appropriately, and false entries (e.g., incorrect birth year, height, or weight) were queried or excluded. Variables with consistently low response rates or below a predefined threshold (e.g., rare comorbidities) were excluded from the analysis. The final set used for analysis comprised 41 different variables (see Supplementary Table 4). In total, following data cleaning 1,258 cases were included into the presented analysis.
To facilitate statistical analysis, key variables were recoded, grouped or aggregated (i.e. patient age groups, BMI from available height and weight data). Comorbidities were quantified using the Charlson Comorbidity Index (CCI), a widely used tool for assessing the burden of chronic illness [9]. Additionally, patient diagnoses and comorbidities were coded according to the International Classification of Diseases (ICD- 10), and groups of related diagnoses were aggregated to simplify the analysis.
The primary endpoint was the initiation of antibiotic treatment during hospitalization. Perioperative antibiotic prophylaxis was not counted as antibiotic treatment.
The dataset was non-randomly split in two sets: a development-dataset, containing 75% (n = 942) of all cases, beginning with those patients recruited first and a validation-dataset, containing the last recruited 25% (n= 316) patients. The validation set was not analyzed until final validation of the PILGRIM score, that was elaborated with the development-dataset.
In terms of descriptive statistics, for applicable variables (i.e. patient demographics, department responsible for inpatient stay) measures of central tendency (mean, median) and variability (standard deviation, interquartile range) were calculated. These were calculated separately per dataset, and both were compared to detect potential imbalances.
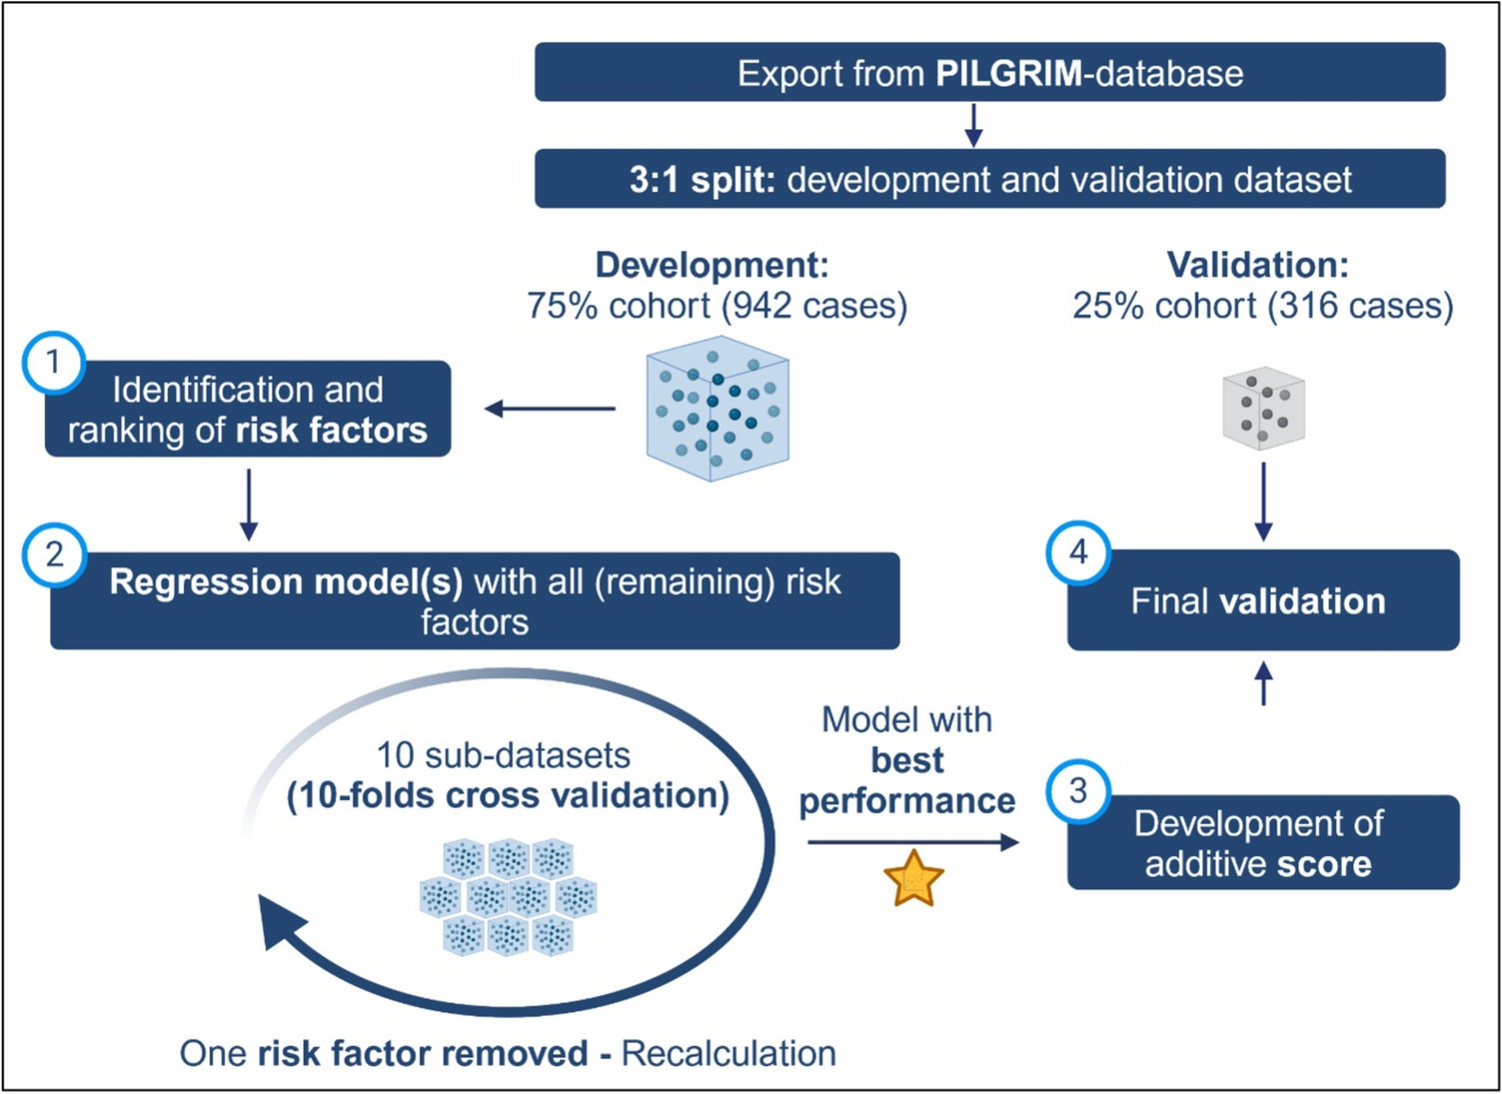
Score developmentThe overarching steps of the explorative data analysis are shown in Figure 1 and described in more detail below.
Fig 1
Workflow of the explorative data analysis: Starting with the 3:1 non-random split of the available PILGRIM dataset, the score-development was continued with the development dataset by (1) identification and ranking of risk factors, (2) calculation of multiple regression models with identified risk factors in an iterative manner, (3) development of an additive score model based on the regression model with the best performance and (4) final score validation based on the formerly separated validation dataset, Created in https://BioRender.com
First, associations between all available and applicable variables and the endpoint were analyzed (see Figure 1, step 1). Crosstabulations and Pearson’s chi-square (or Fisher’s exact test) were used to calculate respective p-values as well as Phi ɸ or Cramérs V for bigger tables to assess the power of the association. Simultaneously using multiple univariate regression models for all variables, regression-coefficients, p-values, odds ratios (OR) and respective 95%-confidence-intervals (95% CI) were calculated. Potential predictors were ranked based on their statistical significance (according to results of Pearson’s chi-square test).
Subsequently, logistic regression models were performed to develop a prediction model identifying patients with antibiotic treatment (see Figure 1, step 2): to ensure robustness, a 10-fold cross-validation approach was applied, where the development dataset was randomly partitioned into 10 subsets. Each subset was used as a validation set once, while the remaining nine subsets were used to train the model. This process ensured that every case contributed to both model training and validation (see Figure 2).
Fig 2
Illustration of the 10-fold cross-validation used for the logistic regression model described in step 2 of the methods section: based on the development dataset 10 filters were programmed, each separating the dataset in the ratio 9:1. The dataset size always remained the same. In each iteration of the regression models, the models were calculated 10-fold, each fold with different patients for the 90%-development and 10%-validation part, Created in https://BioRender.com
The calculation of regression models itself was guided by an iterative process of logistic regression modeling. The above-mentioned ranking of variables informed the subsequent development of multivariate logistic regression models, which aimed to identify a subset of variables that could accurately predict the risk for initiation of an antibiotic treatment. Following standard procedures for model development, the initial logistic regression model included all identified predictors. In each subsequent iteration, the least significant variable (p-value) was removed, and the model was recalculated using the previously explained 10-fold cross-validation (see Figure 3) until only one predictor was left in the model.
Fig 3
Process of iterative logistic regression model calculations incl. 10-folds cross validation: in the first iteration, all available variables were included and using 10-folds cross validation an average model performance was calculated. In the following iteration the least significant variable was removed (n- 1) from the model and the model was calculated again and so forth, Created in https://BioRender.com
Model performance for every iteration was assessed using several key metrics: sensitivity, specificity, positive predictive value (PPV), negative predictive value (NPV), and the area under the receiver operating characteristic curve (AUC) calculated as means from 10-folds cross-validation (see Figure 3). The selection process of the final logistic regression model started with the last model including the fewest variables before the performance of the models dropped due to missing significant predictive variables. Based on this, identified model variables were added and removed manually to identify the best combination based on its ability to balance sensitivity and specificity, while maintaining high overall predictive accuracy with the lowest number of variables possible.
Third, the score construction took place (see Figure 1, step 3). The PILGRIM score was derived from the final multivariate logistic regression model. Each predictor included was assigned a weight based on its regression coefficient, with higher weights assigned to stronger predictors. The score was then calculated as the sum of these weighted predictors. Three different methods for weighting were considered based on the calculations of the final regression model:
1.Werfel et al. [10]—Weights based on the ratio of each variable’s regression coefficient to the smallest regression coefficient in the model.
2.Matsushita et al. [11]—Weights based on the average of the two smallest regression coefficients.
3.Schneeweiss et al. [12]—Weights based on the natural logarithm of the odds ratios (ORs) associated with each predictor.
For comparison, an unweighted score (each predictor was assigned a weight of 1) was calculated. The performance of the weighted and unweighted scores was compared using sensitivity, specificity, PPV, NPV, and AUC metrics.
In a final step, the score was validated (see Figure 1, step 4) using the validation dataset. The same metrics used in model development were calculated for this dataset to assess the generalizability and stability of the score. The score performance was evaluated across a range of cut-off values, with the goal of identifying a threshold that maximized sensitivity and specificity.
Comments (0)