Study design and setting
This retrospective, multicenter, non-inferiority, cohort study was set in the south of Sweden between 2013-05-26 and 2022-12-31 and included patients from all 9 public emergency care hospitals in the region of Skåne, with approximately 1.4 million inhabitants [10]. The starting date of the study was chosen when the current system of electronic medical records was introduced. Earlier medical records were not available for review. Data was collected between 2024-01-07 and 2024-05-01. The protocol and research question were framed before gathering of data. Patient identification and data collection were done in retrospect from registries and medical records.
Participants
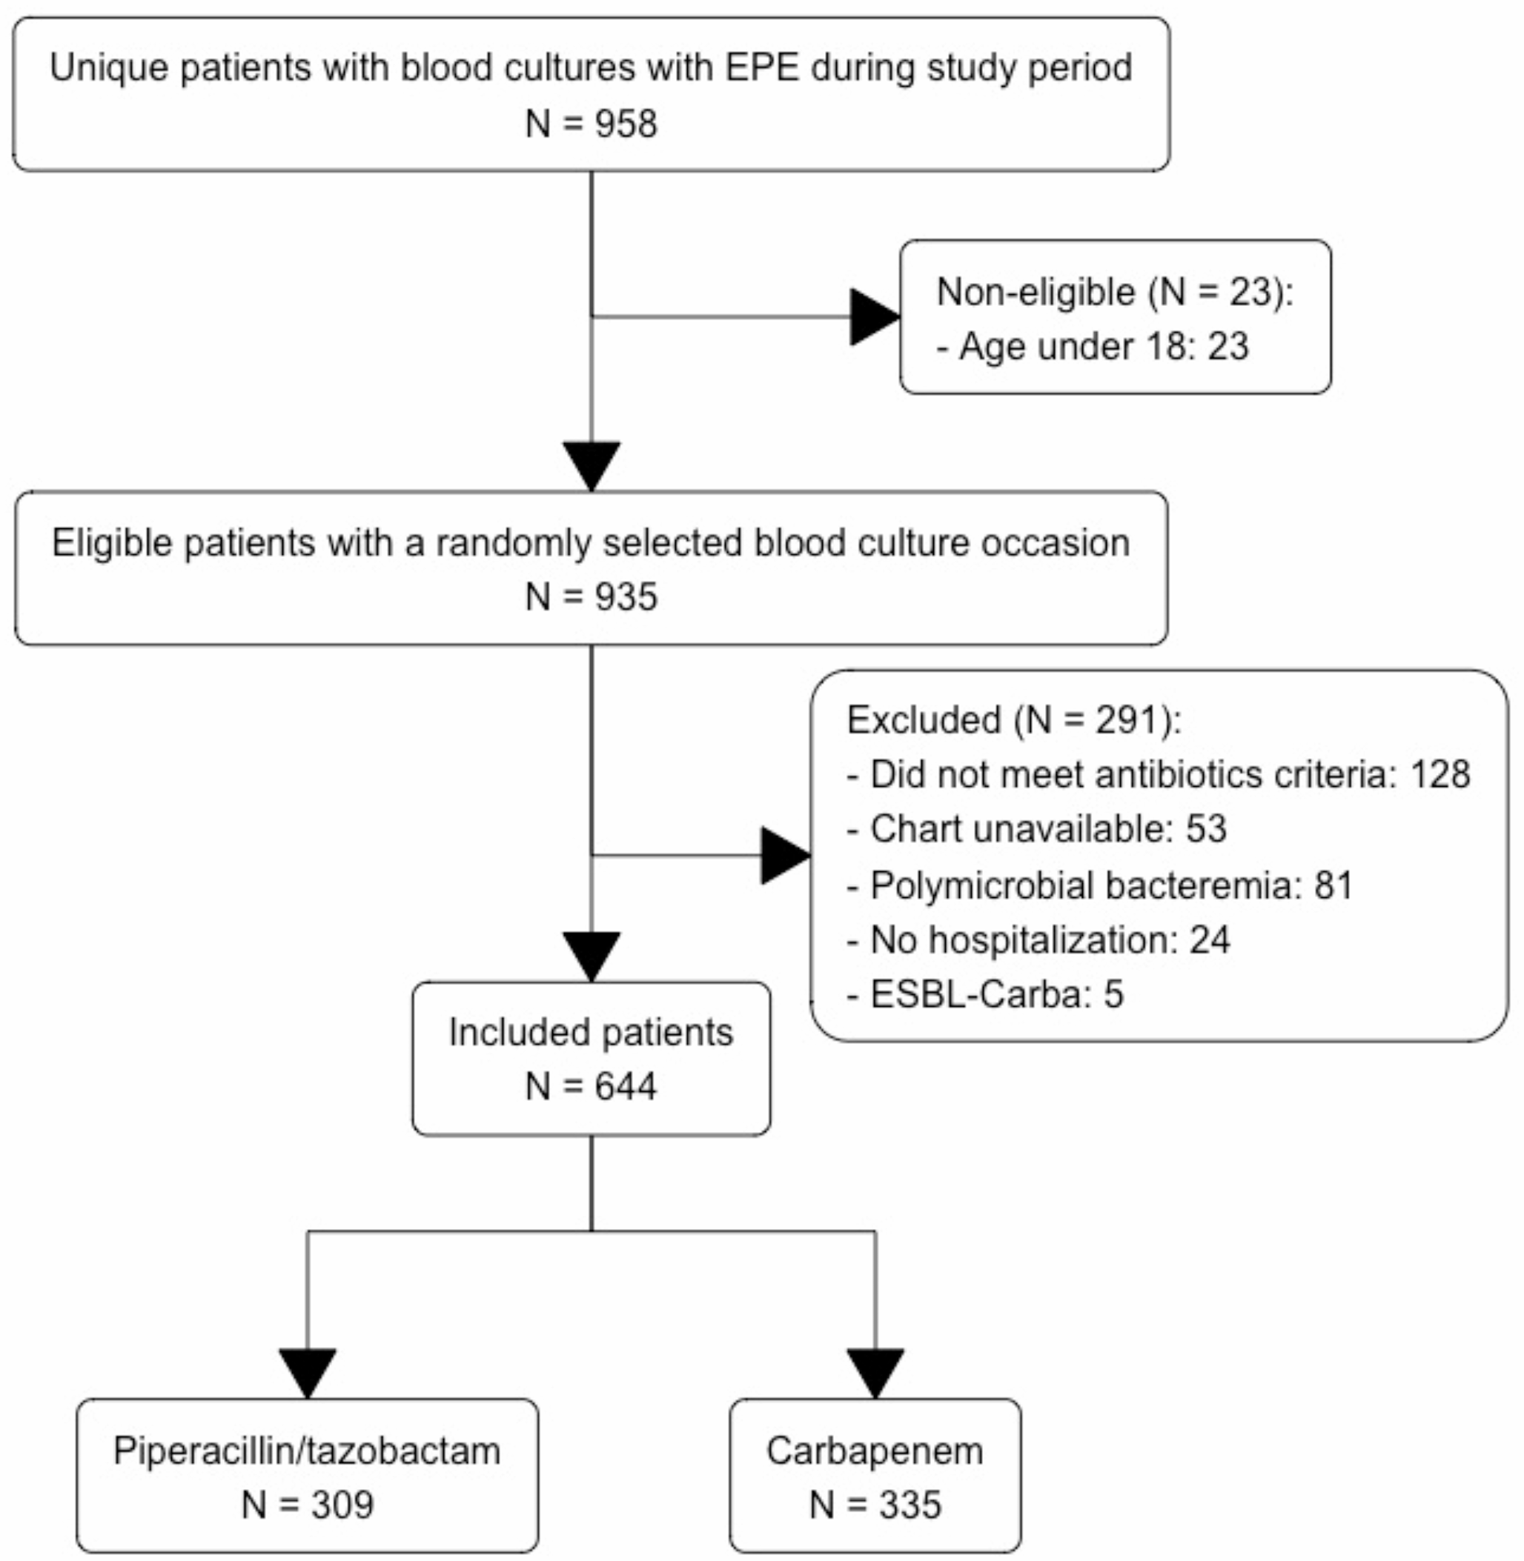
Patients with bloodstream infection (BSI) with EPE were identified from laboratory reports. If an individual had multiple episodes of EPE BSI (not including relapsed infection, as described below) during the study period, only one random episode was selected.
Patients were divided into two groups based on the first type of antibiotic they received in two consecutive doses: either PTZ or a carbapenem. The optimal doses of antimicrobials to appoint patients to a representative treatment group are unknown. We chose two doses, as the initial therapy is arguably the most crucial for severely ill patients [11].
Inclusion criteria were age ≥ 18 years, monomicrobial BSI due to EPE, and antibiotic treatment with PTZ or a carbapenem with minimum two dosages.
Exclusion criteria included previous administration of effective antibiotics other than PTZ/carbapenems for the same BSI (Pneumocystis prophylaxis was allowed), unavailable or missing parts of medical records, administration of PTZ/carbapenems within 48 h prior to the time of inclusion (i.e. baseline, defined as the time when blood cultures were drawn), palliative care at baseline, more than one switch between PTZ and a carbapenem and carbapenem-resistant EPE.
Variables and definitions
The primary outcome was 30-day all-cause mortality, measured from when the positive blood cultures were taken (baseline). Secondary outcomes were ICU admission and early clinical response. Early clinical response was defined as normal vital signs on day 4 after the initiation of effective therapy: heart rate ≤ 100 bpm, temperature ≤ 37.8℃, respiratory rate ≤ 24/min, systolic blood pressure ≥ 90 mmHg, oxygen saturation ≥ 90% without supplemental oxygen [12]. In cases where vital sign data were missing, the absence of values was interpreted as normal. For an early clinical response to be achieved, all parameters were required to be within normal ranges. Additional secondary outcomes were superinfection (candidiasis and/or Clostridioides difficile infection during the hospital stay), relapsed infection (defined as a second positive blood culture with the same organism and phenotypic resistance as in the original blood culture, within 30 days of baseline but after a positive clinical response) and one-year mortality from baseline (the time of death after discharge was found through the population register).
The clinical frailty scale was assessed by the reviewers (TSM, AA, LM) and was discussed in the event of uncertainty [13]. The updated and revised Charlson comorbidity index was used [14]. The Pitt bacteremia score assessed the severity of illness, where a score of ≥ 4 has been associated with increased mortality [15]. Sepsis and septic shock were defined according to Sepsis-3 definitions [16]. Hospital-acquired infection was defined as a positive blood culture being drawn ≥ 48 h after hospital admission, or ≤ 48 h after previous hospital discharge [17]. The time to positive blood cultures (the shortest time in case of growth in multiple bottles) was used as a surrogate marker for bacterial load [18, 19]. The source of infection was defined by the reviewers (TSM and AA) of the medical records, largely based on culture findings, radiological examinations and the assessment of the treating physician. Source control was only applicable for conditions where surgical intervention was possible (abscess, empyema, pyelonephritis with hydronephrosis, cholangitis with choledocholithiasis, etc.) [20]. Phenotypic resistance was defined as ESBLA (classical, functional class 2be β-lactamases) or ESBLM (plasmid-mediated AmpC and OXA-ESBLs) [21].
Microbiology
Microbiological data was provided by Clinical microbiology (Laboratory Medicine Skåne, Lund, Sweden), which covers all hospitals and outpatient clinics in the region. Susceptibility testing was performed and interpreted according to the EUCAST (European Committee on Antimicrobial Susceptibility Testing) methodology and breakpoints. Minimum inhibitory concentration levels were not available for most of the blood cultures. Species identification was done using matrix-assisted laser desorption/ionization time-of-flight mass spectrometry (MALDI-TOF MS: Bruker Daltonics, using the Bruker MBT Compass library version most recent at the time of sample analysis). Until December 2014, the blood culture system in use was Bactec FX (Beckton Dickinson), with BACTEC FX (BectonDickinson, Franklin Lakes, NJ) being used during the remainder of the study period. The NordicAST flowchart for when to screen for ESBL production in Enterobacterales was in use during the study period. Disk diffusion with cefpodoxime, clavulanic acid and cloxacillin was the main method used to determine the type of ESBL in cephalosporin-resistant strains.
Study size
The largest observational, multinational, cohort study available was used for calculating the sample size [22]. The 30-day mortality was 9.8% and 13.9% for BLBLIs and carbapenems, respectively, in patients where the therapy decision was made after the susceptibility profile was identified. We chose a delta limit of 5% and 90% power with a one-sided significance level of 2.5%, which generated a total target study population of 530 individuals. A total of 644 patients were included in this study.
Statistical methods
The Mann-Whitney U-test was chosen for continuous variables and the χ2-test or Fisher’s exact test for categorical variables. A p < 0.05 was considered statistically significant for most statistical analyses, except for the primary and secondary analyses, where a threshold of p < 0.025 was used.
Univariate logistic regression was used to identify variables associated with the primary outcome. A multivariate logistic regression analysis was also performed.
The decision to categorize patients based on their initial therapy resembles the intention-to-treat analysis commonly used in randomized controlled trials. Three cohorts were included in the primary analysis. One cohort included all study participants and two were constructed using propensity score (PS) matching. This method was chosen to adjust for confounders and estimate the effect of treatment on 30-day mortality. In the first (empirical) PS matched cohort, patients were categorized according to the first therapy they received, which involved two consecutive doses of the same antimicrobial (PTZ or carbapenem). In the second (effective) PS matched cohort, patients were categorized according to the first effective therapy (according to EUCAST breakpoints) they received, which involved two consecutive doses of the same antimicrobial.
The PS was estimated using logistic regression based on variables expected to be related to the outcome, while accounting for multicollinearity: age, gender, clinical frailty scale, Charlson comorbidity score, Pitt bacteremia score, source of infection, the pathogen in the primary blood culture [23]. One-to-one nearest matching was used, with a caliper width equal to 0.2 of the standard deviation of the logit of the PS, as is common practice [24, 25].
The standardized mean difference was < 0.1 for all matched patients, indicating a good balance (Supplementary Figs. 1 and 2) [25].
The Wald method was used to determine a 1-sided 97.5% confidence interval (CI) for risk differences [26]. To establish non-inferiority, the upper bound of the CI for the absolute risk difference in 30-day mortality, with carbapenem as the reference group, could not exceed the predefined delta limit of 5%. A sensitivity analysis with a delta limit of 2% was also conducted.
Missing data was not imputed. Complete case analysis was performed, as is common research practice [27].
Kaplan-Meier curves and log-rank tests were computed to visualize differences in one-year mortality between the treatment groups in the cohort containing all patients.
All statistical analyses were performed using RStudio software (version 2024.4.1.748) [28].


Comments (0)