
Remember me
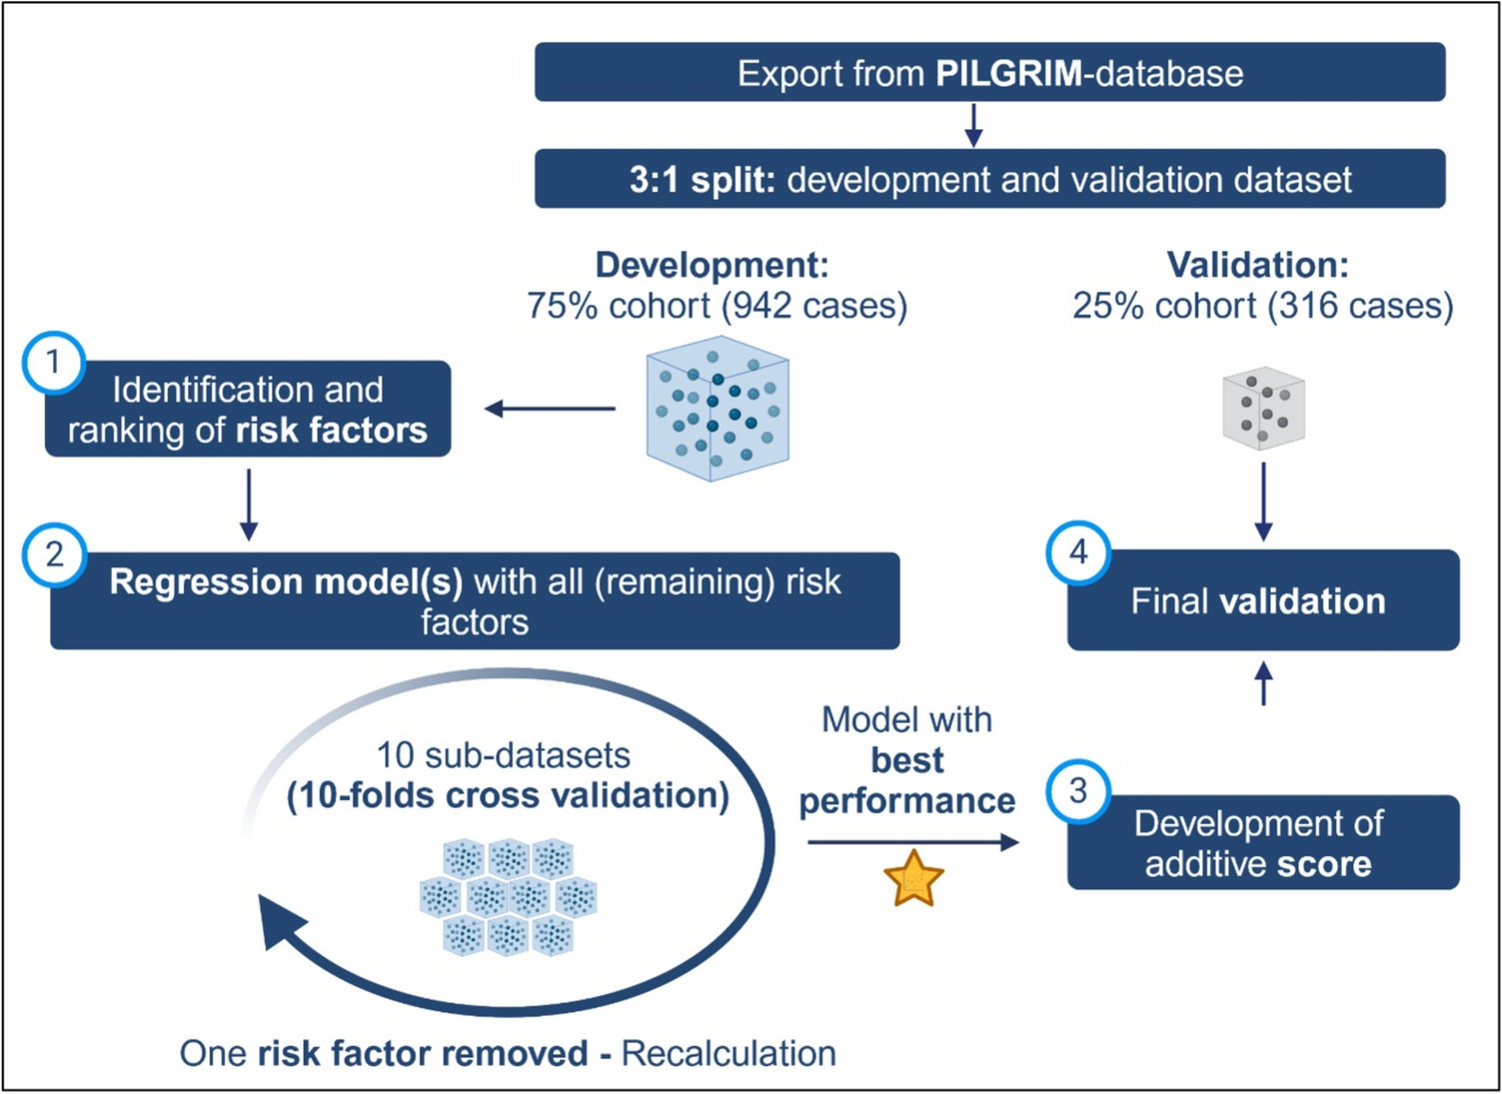
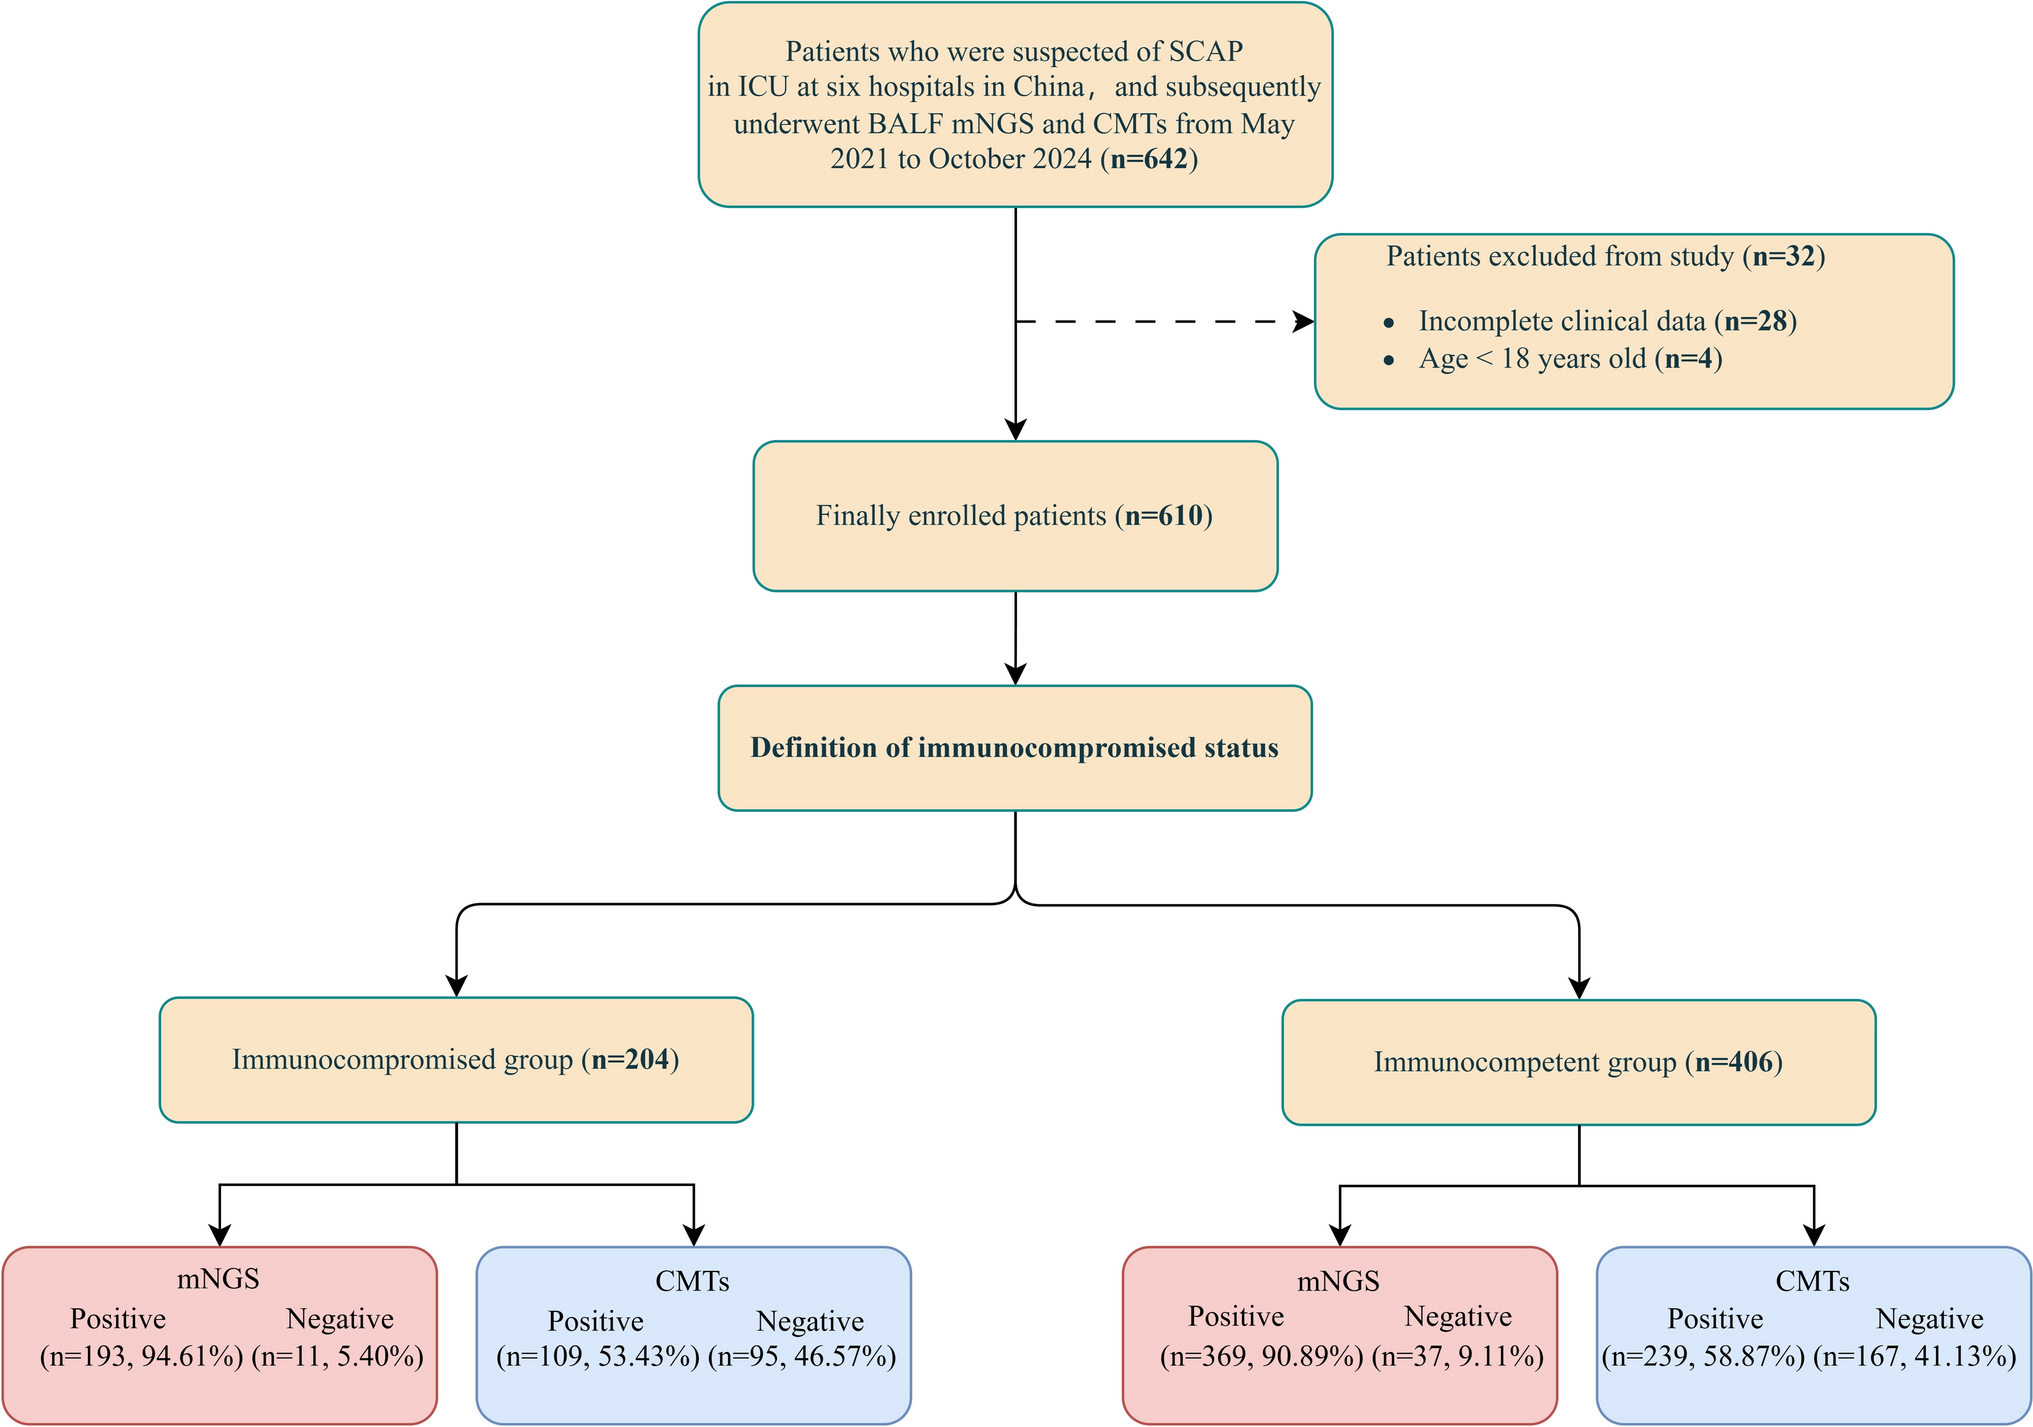
We conducted a retrospective analysis of patients admitted to the ICU of five participating centers between May 2021 and October 2024 with suspected SCAP, and finally 610 patients were included in this study. The patients were divided into two groups based on immunocompromised status: the immunocompromised group (n = 204) and the immunocompetent group (n = 406) (Fig. 1).
Demographic and clinical characteristics of the immunocompromised group and the immunocompetent group were compared and summarized in Table 1. There were no statistically significant differences between the groups regarding age, gender distribution, and several underlying diseases such as hypertension, diabetes, cardiovascular disease, cerebrovascular disease, and lung disease (P > 0.05). In the immunocompromised group, the levels of procalcitonin (PCT), C-reactive protein (CRP), D-dimer were higher than the immunocompetent group (P < 0.05). Additionally, the platelet (PLT) counts were lower in the immunocompromised group compared to the immunocompetent group (P < 0.05).
Table 1 Clinical characteristics of patientsThe immunocompromised group presented with a higher APACHE-II score and SOFA score compared to the immunocompetent group (P < 0.001). For CURB-65 scores, the immunocompromised group also had a higher median score (P < 0.05), and a greater proportion of patients had a score ≥ 3 in this group (P < 0.05) than in the immunocompetent group.
Mechanical ventilation (MV) was used more frequently in the immunocompromised group (P < 0.05). Additionally, vasopressor use was also higher in the immunocompromised group (P < 0.05).
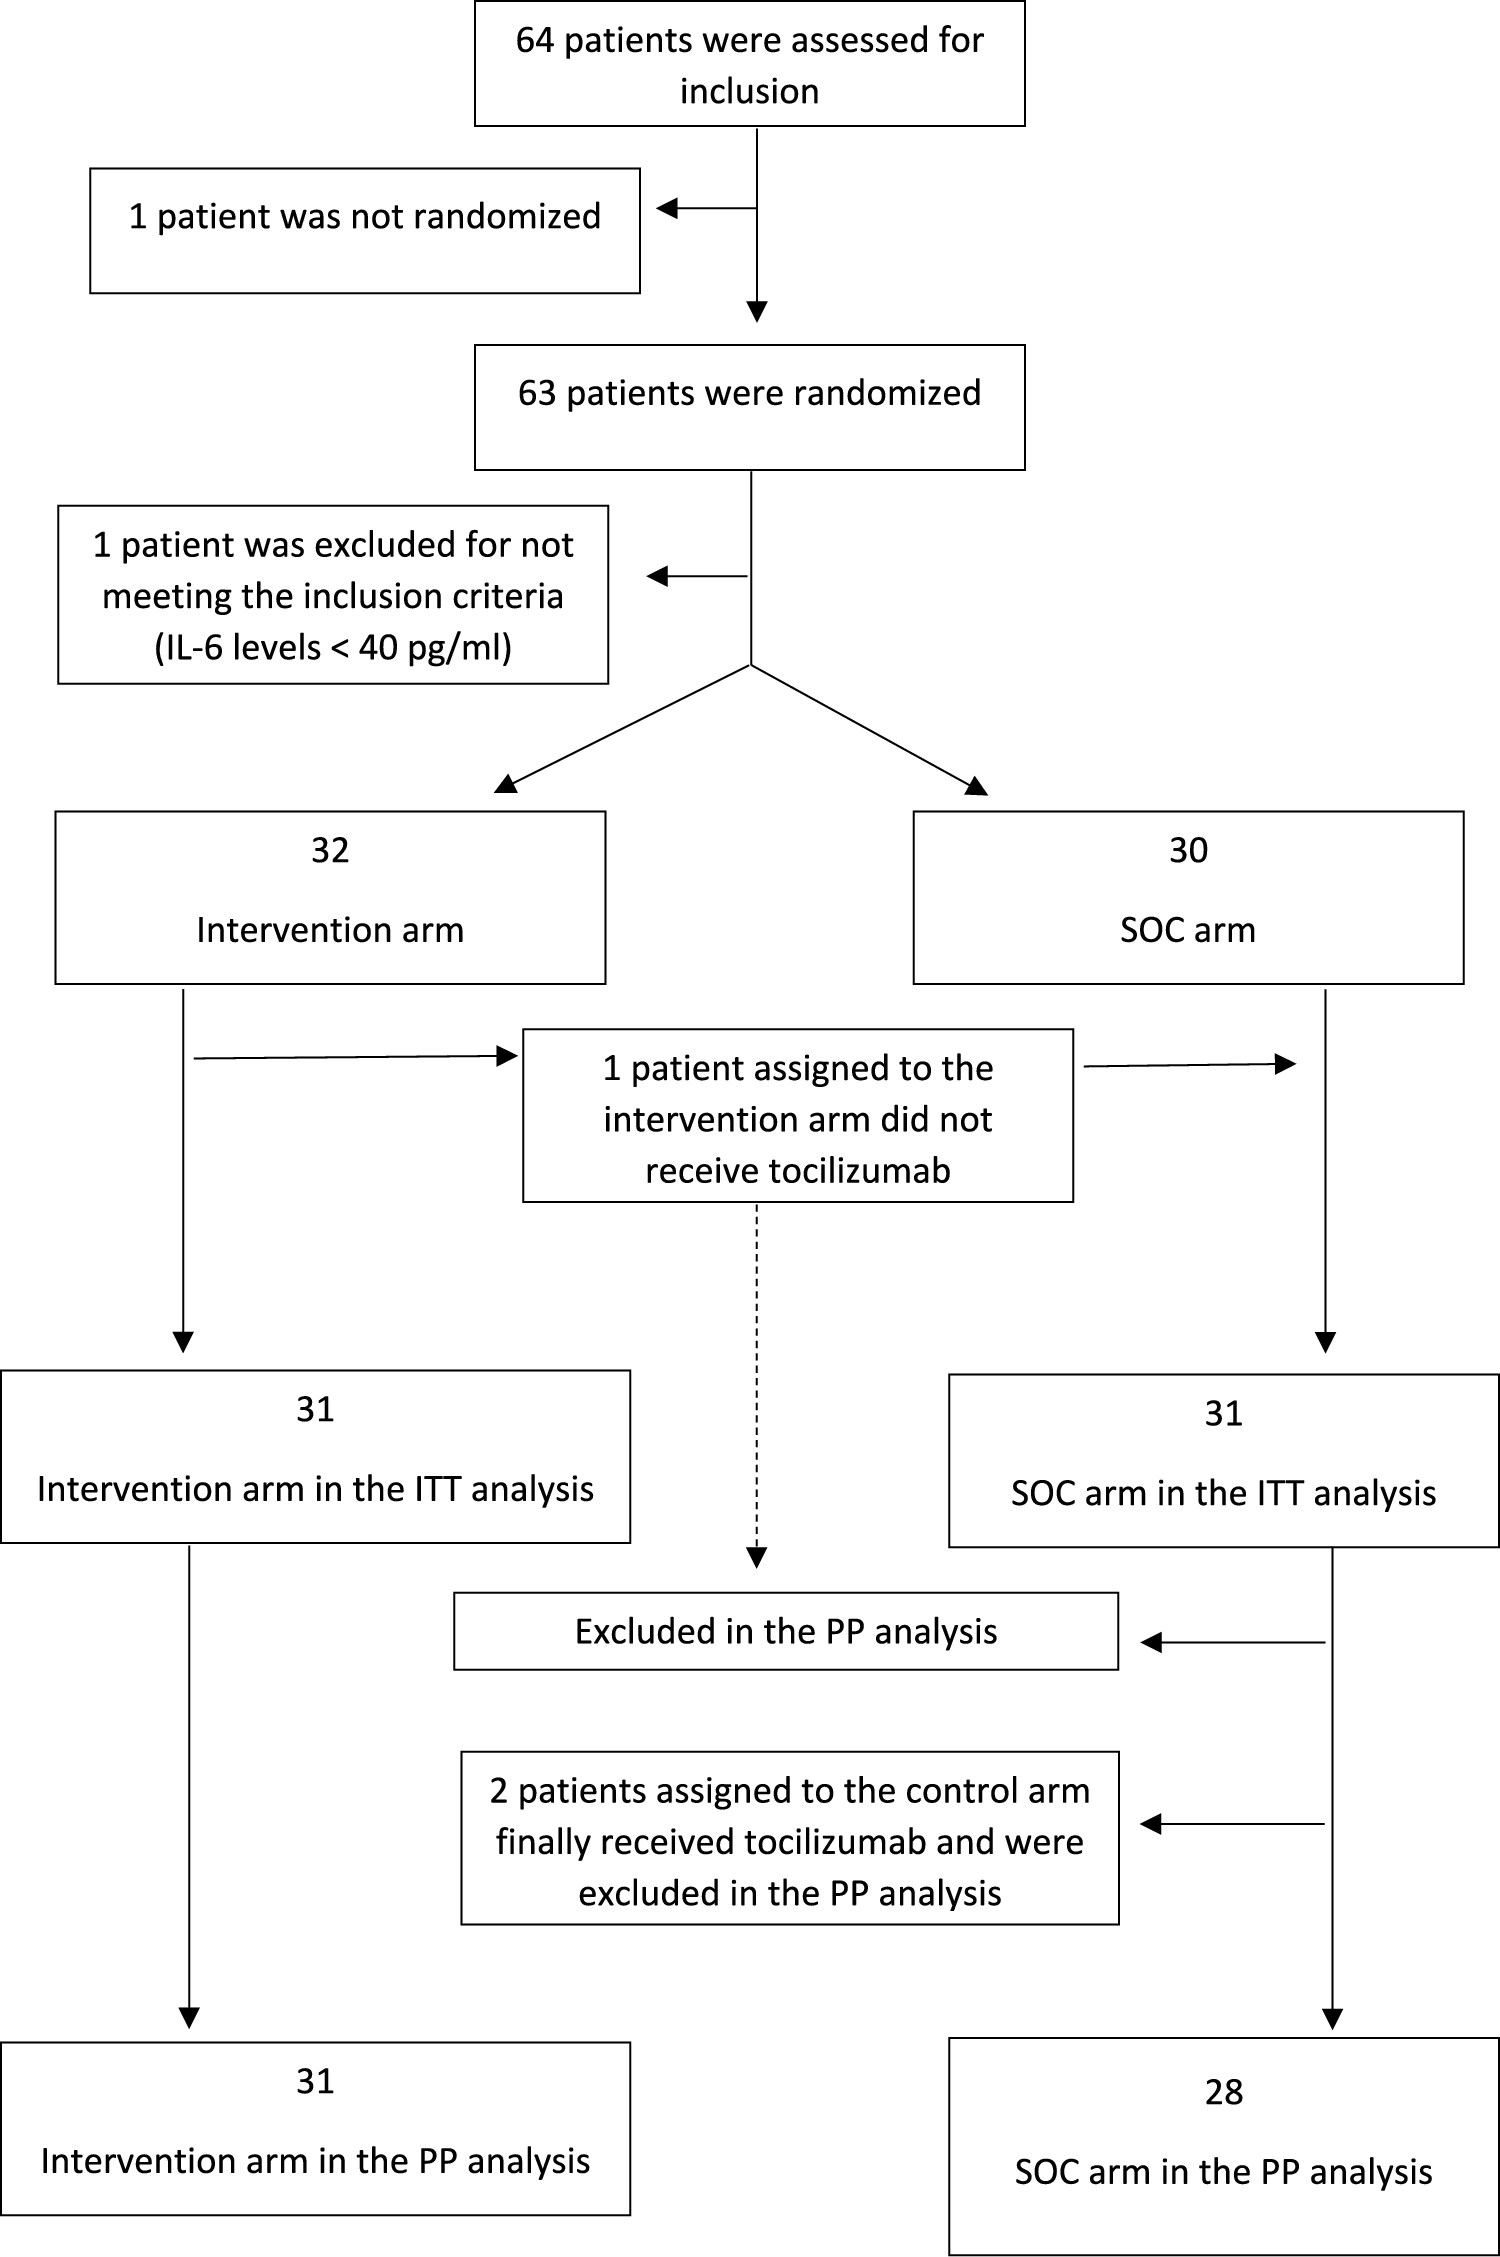
The distribution of immunocompromised patientsAmong the 204 immunocompromised patients, most had neutropenia or had received chemotherapy for solid tumors in the past 3 months (156/204, 76.47%), followed by those with hematologic malignancies (41/204, 20.10%), long-term corticosteroid use (≥ 0.3 mg/kg/day prednisone equivalent for ≥ 3 weeks) (31/204, 15.20%), taken antirheumatic drugs, biological immunomodulators, or immunosuppressants (5/204, 2.45%), and those who had undergone hematopoietic stem cell or solid organ transplantation (3/204, 1.47%) (Fig. 3).
Fig. 3
The distribution of immunocompromised patients
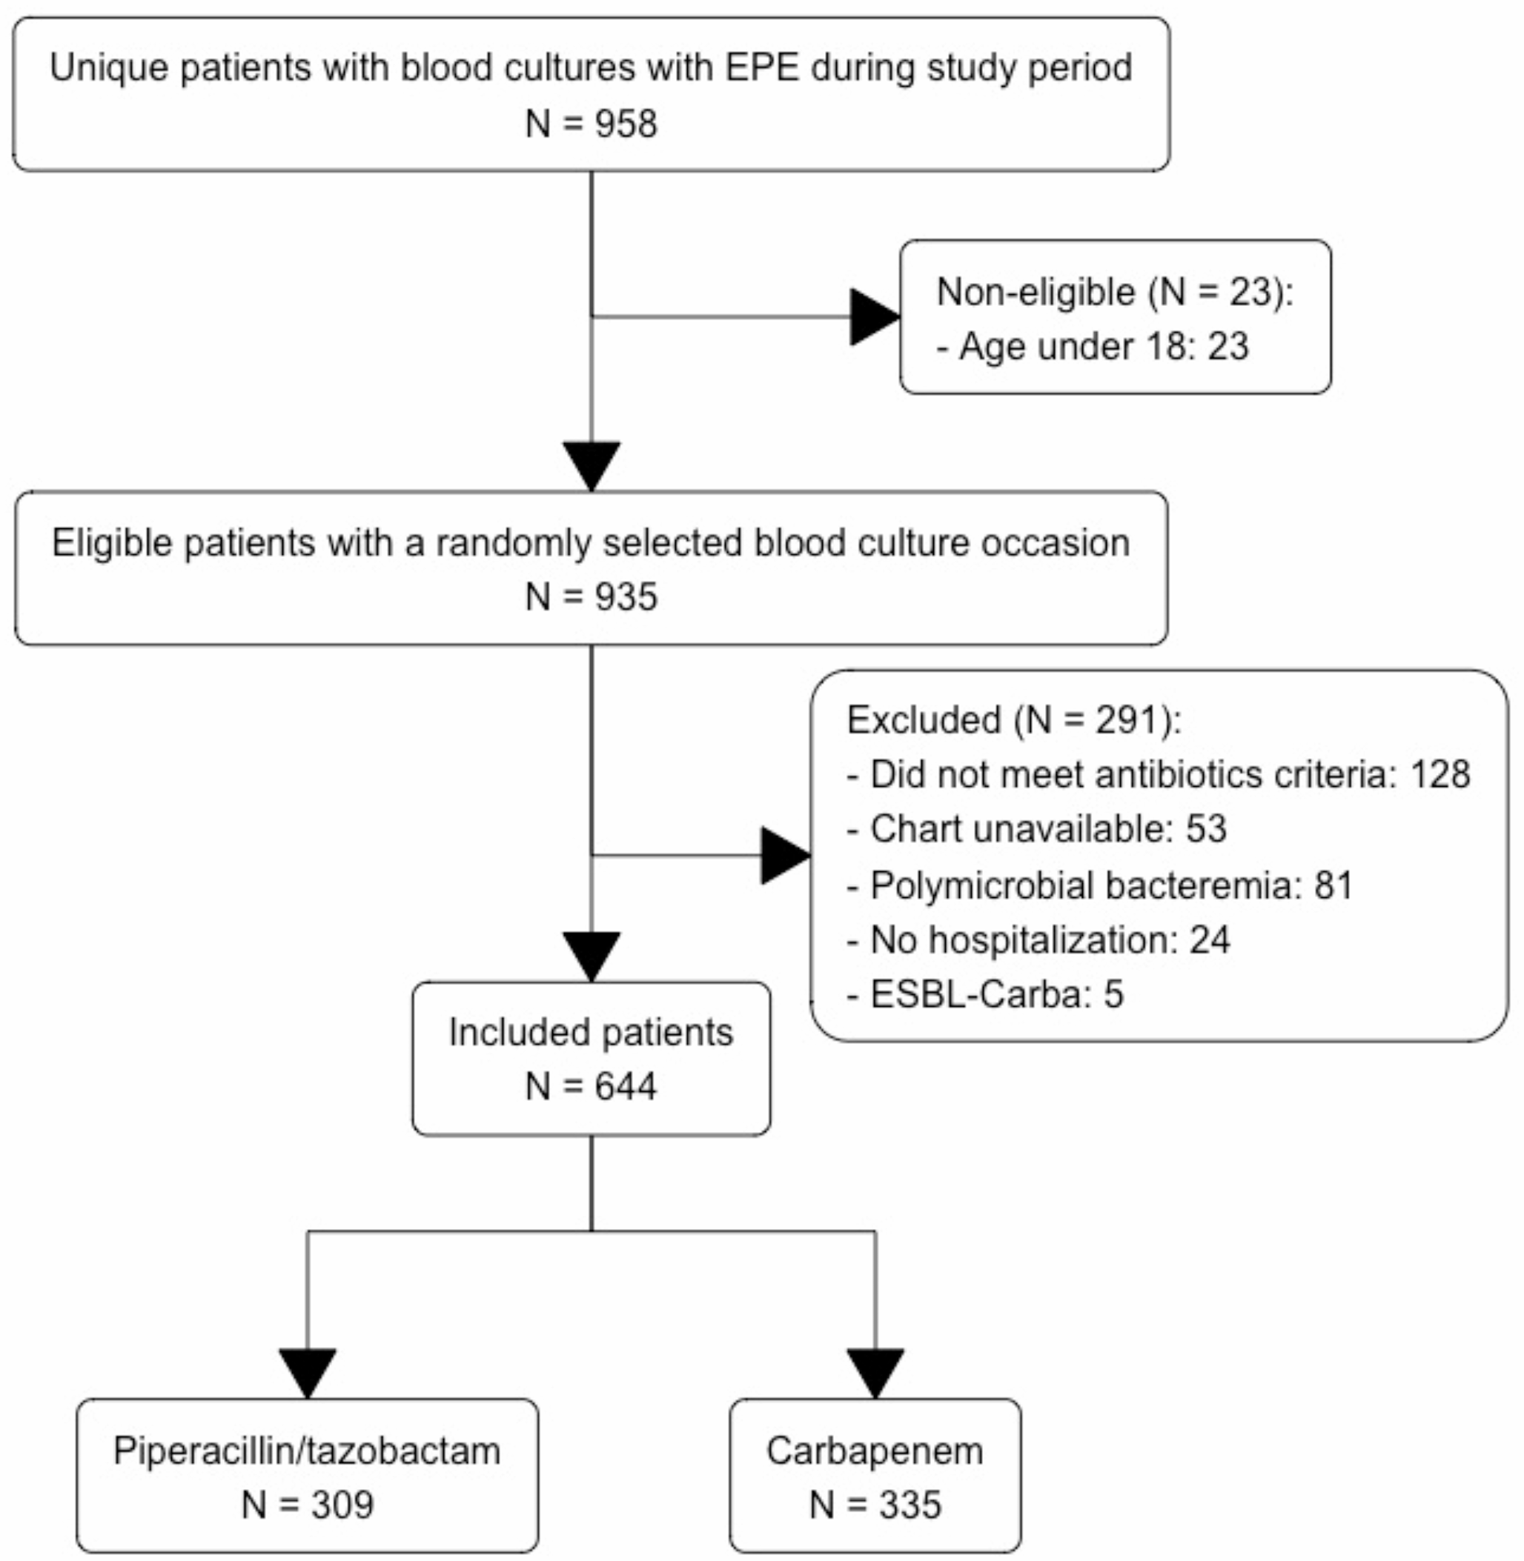
Evaluation of the concordance of the mNGS and CMTs resultsAmong the 610 patients included in this study, the Chi-square test was conducted to compare the difference of positivity rates between mNGS and CMTs in the immunocompromised group and the immunocompetent group. The positive results of mNGS were higher than CMTs in both the immunocompromised (94.11 vs 53.43%, P < 0.001) and immunocompetent (91.13% vs 58.87%, P < 0.001) groups and all patients (92.13% vs 57.05%, P < 0.001) (Fig. 4A).
Fig. 4
A Comparison of the positivity rates between mNGS and CMTs.Microorganism identification consistency between mNGS and CMTs in B all patients, C Immunocompromised group and D immunocompetent group
Subsequently, the Kappa consistency test was performed to further validate the diagnostic consistency between the two methods. The results of the Kappa analysis indicate that the two methods show poor level of consistency (Kappa value = 0.092, P < 0.001) (Table 2).
Table 2 Kappa analysis of concordance between mNGS and CMTs resultsIn the total group of 610 patients, both mNGS plus CMTs yielded positive results in 54.59% (333/610) of the patients, and negative results in 5.41% (33/610) (Fig. 4B). Additionally, 37.54% (229/610) of patients tested positive with only mNGS, while 2.46% (15/610) tested positive with only CMTs. Among the 333 patients who tested positive with both methods, 22 (6.61%) were completely matched, 98 (29.43%) were mismatch, and 213 (63.96%) were partial match.
In the immunocompromised group (n = 204), both mNGS plus CMTs yielded positive results in 50.72% (105/204) of patients and negative results in 5.31% (11/204) (Fig. 4C). 42.03% (87/204) of patients tested positive with only mNGS, while 1.93% (4/204) tested positive with only CMTs. Among the 105 patients who tested positive with both methods, 9 (8.57%) were completely match, 29 (27.62%) were mismatch, and 67 (63.81%) were partial match.
In the immunocompetent group (n = 406), both methods yielded positive results in 56.16% (228/406) of patients and negative results in 6.16% (25/406) (Fig. 4D). A total of 34.98% (142/406) of patients tested positive with only mNGS, and 2.71% (11/406) tested positive with only CMTs. Among the 104 patients who tested positive with both methods, 13 (5.70%) were completely match, 69 (30.26%) were mismatch, and 146 (64.04%) were partial match.
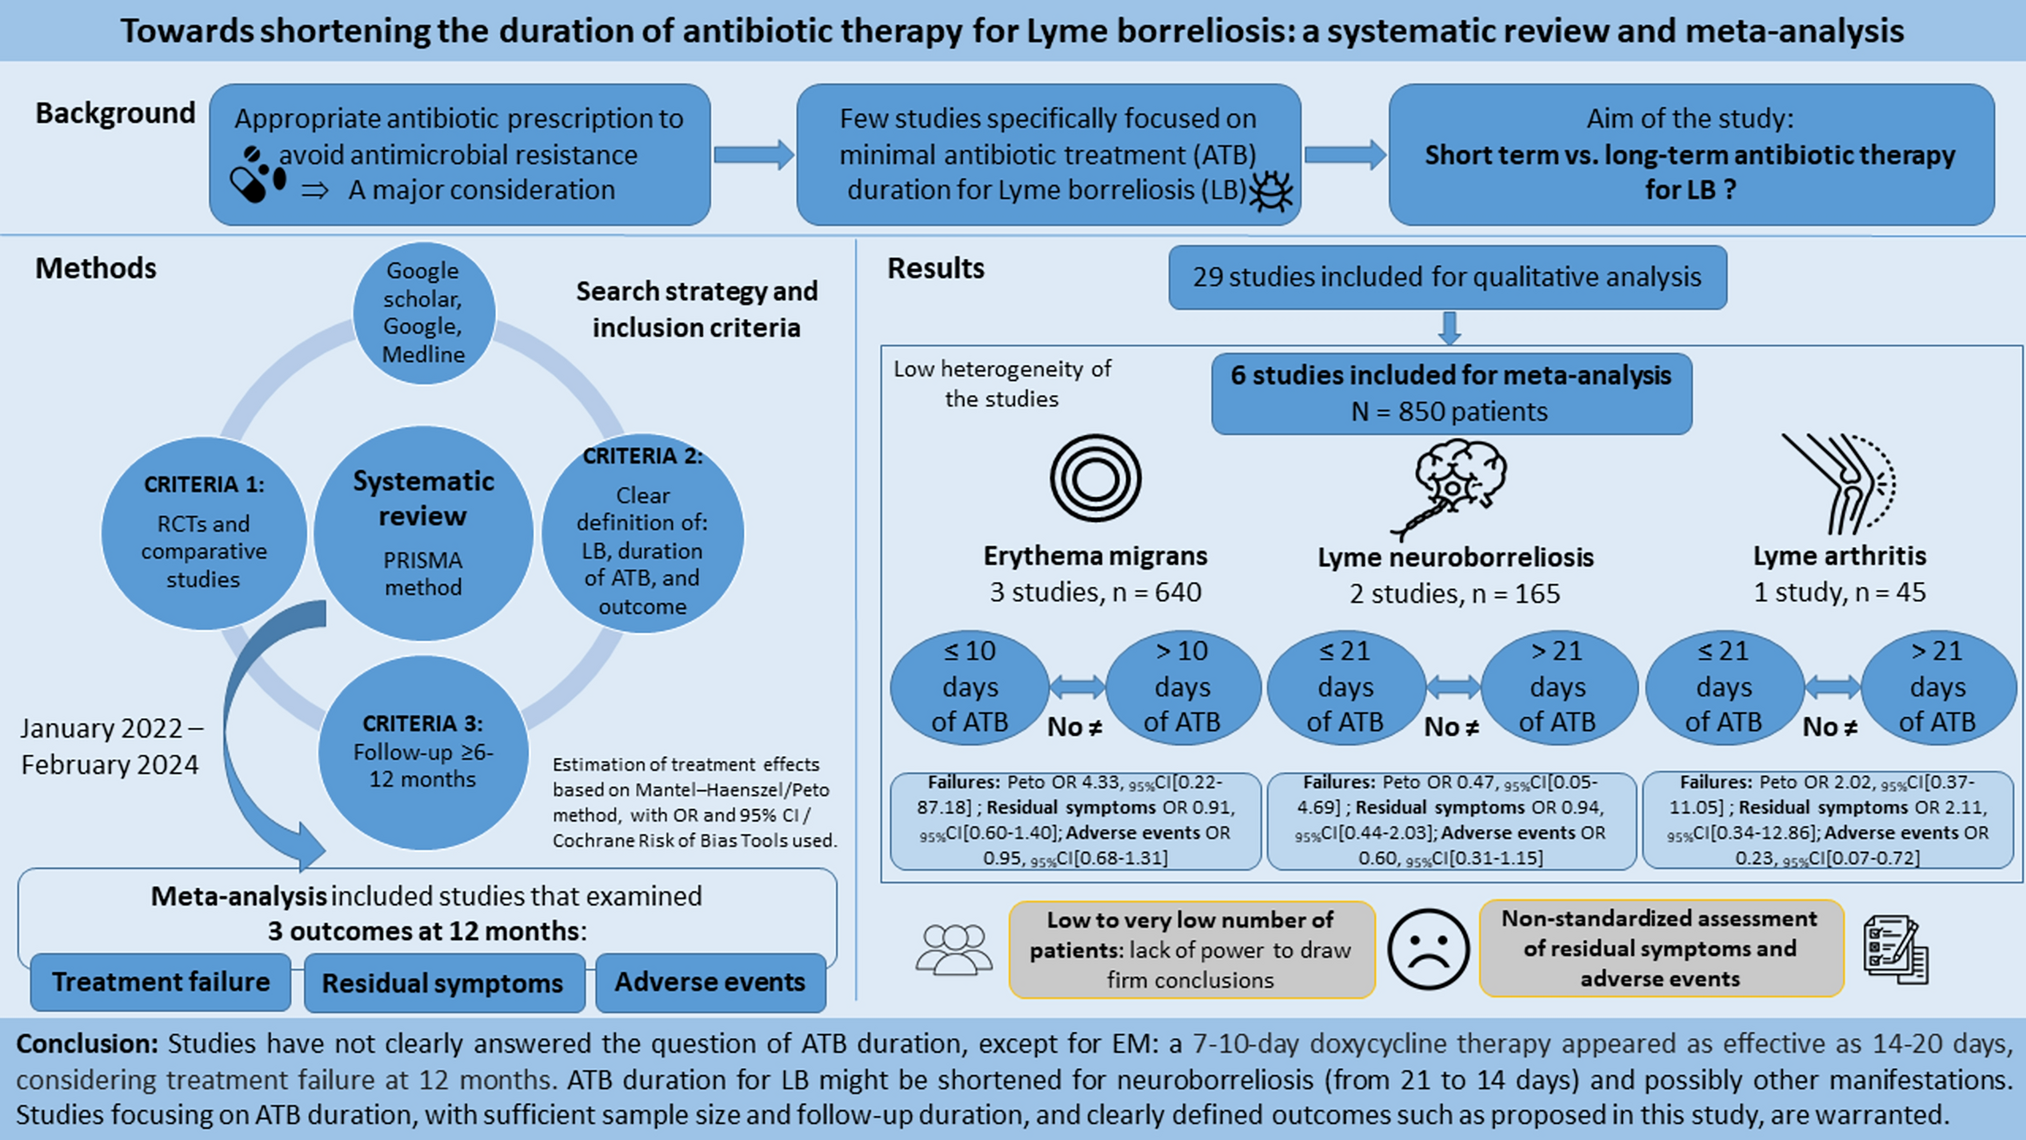
Difference between the two groups in detecting pathogenic microorganisms by using mNGSThe distribution of pathogen types detected by mNGS between the immunocompromised group and the immunocompetent group is presented in the Fig. 5A, B. In the immunocompromised group, mixed infections were more common, accounting for 58.82% (120/204) of cases, compared to 44.58% (181/406) in the immunocompetent group. Single type infections were found in 36.27% (74/204) of immunocompromised group, slightly lower than 47.04% (191/406) in the immunocompetent group.
Fig. 5
Categorization of microorganism infections in patients based on mNGS results. A Immunocompromised group. B Immunocompetent group
As shown in Fig. 6, the comparative diagnostic rates of microorganisms between the immunocompromised and immunocompetent groups were evaluated using both mNGS and CMTs. The most common bacteria detected in the two groups were consistent, and the detection rate of these bacteria, including Corynebacterium species (spp). (30.66% vs 1.97%, P < 0.05), Klebsiella spp. (16.39% vs 9.02%, P < 0.05), Acinetobacter spp. (11.31% vs 9.02%, P < 0.05) and Pseudomonas aeruginosa (11.80% vs 8.52%, P < 0.05), by mNGS was higher than that of CMTs.
Fig. 6
The distribution of diagnostic rate of microorganism by mNGS or CMTs. *P < 0.05, mNGS result compared to CMTs result. #P < 0.05, comparison of mNGS results between the immunocompromised group and the immunocompetent group
In immunocompromised group, compared to the CMTs, the fungi with the most commonly detection rates by mNGS were Candida spp. (25.49% vs 20.59%, P < 0.05), Aspergillus spp. (24.02% vs 7.84%, P < 0.05) and Pneumocystis jirovecii (7.84%, only detected by mNGS). The difference is that, in immunocompetent group, compared to the CMTs, the fungi with the most commonly detection rates by mNGS were Candida spp. (24.14% vs 25.86%, P < 0.05), Aspergillus spp. (11.33% vs 3.69%, P < 0.05) and Penicillium spp. (4.43%, only detected by mNGS).
The virus with the most commonly detection rates by mNGS in both groups were Epstein-Barr virus (EBV) (17.87% vs 0.82%, P < 0.05), Cytomegalovirus (CMV) (13.11% vs 0.49%, P < 0.05), Human herpesvirus 7 (HHV-7) (13.44%, only detected by mNGS) compared to the CMTs.
Notably, in the immunocompromised group, the detection rates of Corynebacterium spp., Mycobacterium tuberculosis (MTB), Non-tuberculous mycobacteria (NTM), Aspergillus spp., Pneumocystis jirovecii, CMV, and HHV-7 by mNGS were higher compared to the immunocompetent group (all P < 0.05).
Clinical impact of mNGS result in the both groups for diagnosisThe clinical impacts of positive mNGS results for immunocompromised and immunocompetent group were illustrated in Fig. 7A, B. We can found that new and earlier diagnosis were the most common effects of mNGS results, account for more than 75%. Followed by confirmed diagnosis, account for about 13.73%. Compared to the immunocompetent group, mNGS provided a higher proportion of new diagnosis for the immunocompromised group (42.16% vs 33.25%, P < 0.05). However, the other diagnostic outcomes, such as earlier or confirmed diagnosis, did not demonstrate statistically significant differences (P > 0.05).
Fig. 7
Clinical impact of mNGS result for diagnosis. Percentage of the clinical impact of positive mNGS results related to diagnosis in the in the A immunocompromised group and B immunocompetent group. Sankey diagrams of the clinical diagnosis-related impact types and microorganism types. C Diagnostic rate of clinically confirmed mNGS or CMTs for different types of microorganism in both groups. (* indicate significant difference (P < 0.05) between mNGS and CMTs). D Difference in diagnostic rate for different types of microorganism detected by mNGS in both groups
Among the types of microbial infections detected by using mNGS, mixed infections were the most common in both groups, and it with higher detected rate than CMTs (58.82% vs 17.96%, P < 0.05) in the immunocompromised group. Bacterial infections in both groups were higher than CMTs (P < 0.05). The immunocompetent group showed a higher detection rate of viral infections than CMTs (5.91% vs 0.49%, P < 0.05). (Fig. 7C). Additionally, in both groups, the rate of no pathogens was detected by mNGS was lower than that of CMTs (immunocompromised group: 4.9% vs 38.73%, P < 0.05; immunocompetent group: 8.37% vs 32.76%, P < 0.05).
Interestingly, by calculating the difference in diagnostic rates between mNGS and CMTs, the findings revealed that the detection rates of mixed infections and bacteria in the immunocompromised group were higher than in the immunocompetent group (all P < 0.05).
Clinical impact of mNGS result in the both groups for treatmentTo further evaluate the clinical impact of BALF mNGS, we analyzed the therapeutic decisions and the alleviation of infection based on the mNGS reports.
Based on the positive mNGS results, the impacts associated with therapy were greater than those related only to diagnosis or negative outcomes in both groups (all P < 0.05) (Fig. 8A). When considering the negative mNGS results, for the received escalation antimicrobial therapy was higher than the immunocompetent group (58.33% vs 2.78%, P < 0.05). Notably, patients who received de-escalation antimicrobial therapy or no change was higher than the immunocompetent group (80.56% vs 33.33%, P < 0.05) (Fig. 8B).
Fig. 8
Clinical impact of mNGS result for treatment. A Percentage of clinical impact types with positive or negative mNGS results in both groups. B Percentage of each antimicrobial strategy among the impact related to antimicrobial therapy in both groups. Sankey diagrams of the types of antimicrobial therapy and significance for infection relief in the C immunocompromised group and D immunocompetent group
In terms of therapy-related impact, “appropriate targeted antibiotic treatment” was the most commonly utilized type among the immunocompromised group and immunocompetent group (67.65% vs 54.19%, P < 0.05) (Fig. 8C, D). There was a significant difference in the proportion of patients receiving antibiotic de-escalation between the immunocompromised group and the immunocompetent group (20.59% vs 17.48%, P < 0.05), while the rate of no change in antibiotic therapy was higher in the immunocompetent group compared to the immunocompromised group (17% vs 1.47%, P < 0.05).
In addition, we also calculated the alleviation rate after therapy. The treatment efficacy (improvement or cure) after adjustments based on mNGS was higher in both groups compared to the inefficacy (poor or unknown) (Fig. 8C, D). It is noteworthy that the treatment efficacy in the immunocompromised group was higher than that in the immunocompetent group (65.69% vs 56.40%, P < 0.05).
Further analysis showed that when mNGS-guided treatment was effective, the 28-day mortality rate significantly improved in both the immunocompromised group (31.34% vs 74.29%, P < 0.05) and the immunocompetent group (42.36% vs 40.68%, P < 0.05) compared to when the treatment was ineffective (Fig. 8C, D).
Comments (0)