
Remember me
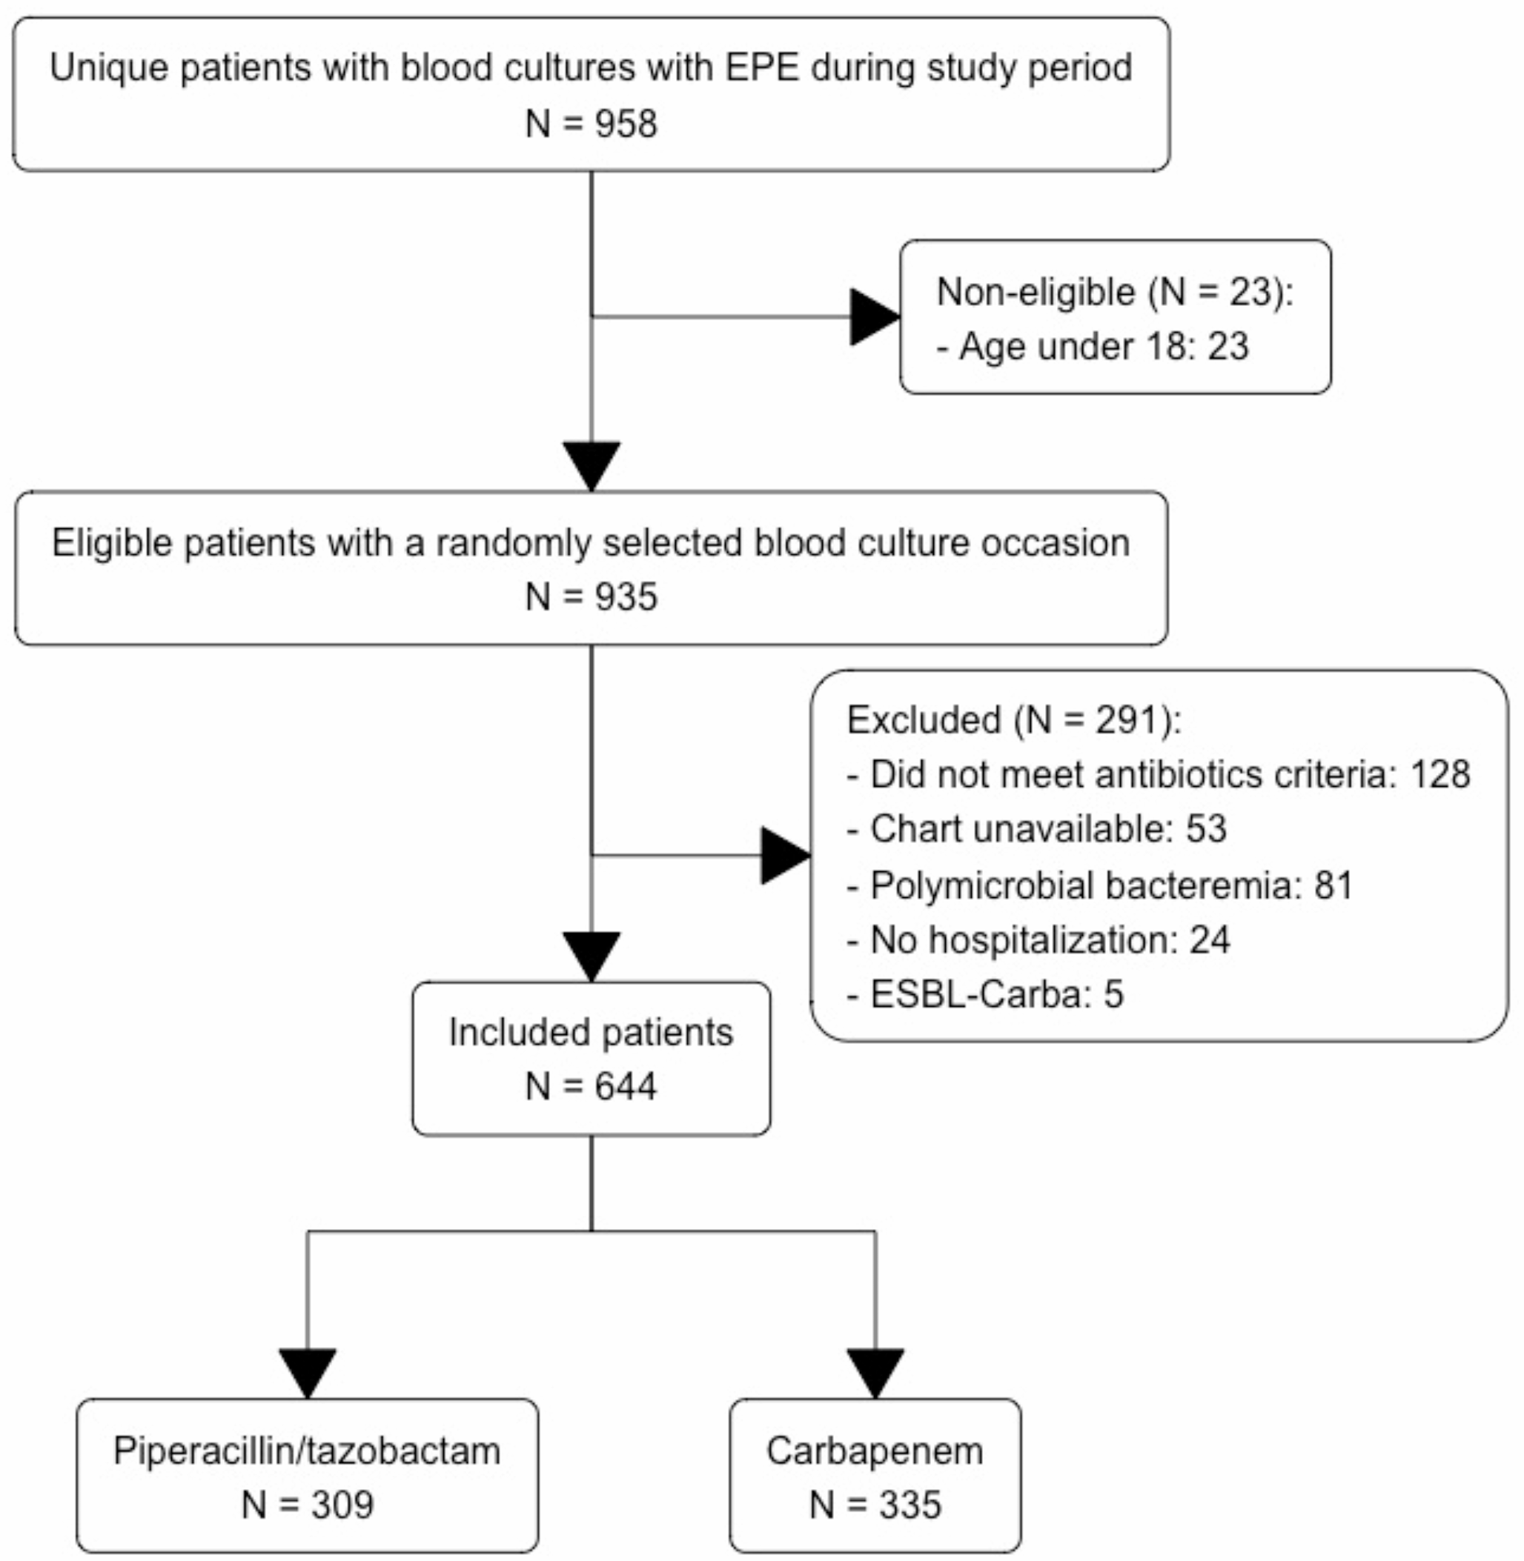
During the study period, 681 patients were admitted to one of the 7 EDs participating in the study with signs and symptoms consistent with UTI; 327 of them presented a positive urine culture and 288 a positivity for Enterobacterales. Figure 1 illustrates the flowchart of the selection of patients included in the study. Total 288 patients were enrolled in the present study: 41.7% of subjects were males, median age was 72 years (interquartile range, IQR, 56–81), and median Charlson Comorbidity Index (CCI) 1 (IQR 0–4). Demographic, clinical and microbiological characteristics of patients are described in Table 1. The most frequent comorbidity was diabetes mellitus (27.4%), followed by chronic kidney disease (22.6%). Among risk factors, the most frequent was the presence of a urinary catheter (17.4%), while 37 patients (12.8%) underwent invasive urinary procedures in the previous 30 days. None of the patients enrolled had known rectal colonisation by MDR germs, 22.1% took antibiotics in the previous three months, 12.4% were admitted to a hospital and 3.7% to a long-term care facility in the previous three months.
Fig. 1
Flowchart of patients selection process
Table 1 Demographic, clinical and microbiological characteristics of patients included in the studyThe most frequently isolated pathogen was Escherichia coli (70.5%), while Klebsiella pneumoniae was identified in 53 (18.4%) patients. The majority of the patients enrolled showed severe disease, sepsis in 43.9% and septic shock in 11.2% of cases. Empiric antibiotic therapy, given to 8.7% of patients, was adequate in 61.1% of cases. The 30-day mortality was 10.1% (Table 1).
Supplementary Table 1 shows demographic, clinical and microbiological characteristics of patients, according to urban areas of origin. We evaluated the urban areas of Naples and Caserta, since they represented 95% of population included in the study.
Antibiotic susceptibility patterns/profiles of isolated strainsOf the 288 patients enrolled, 35.9% harboured Enterobacterales non-susceptible (“R” or “I”) to 3GC; among them, 6 strains were “I” and 93 were “R”. Supplementary Table 2 describes the susceptibility profile of pathogens most frequently isolated in our cohort, i.e., Escherichia coli, Klebsiella spp., and other Enterobacterales.
E. coli (N = 203 strains) was non-susceptible to aminopenicillins in 47.2% of cases, to fluoroquinolones (ciprofloxacin) in 43.3%, to trimethoprim/sulfamethoxazole (TMP/SMX) in 34.1%, and to 3GC in about 30% (cefotaxime/ceftriaxone 30.2%, ceftazidime 31.1%). Klebsiella spp. (N = 53) was non-susceptible to aminopenicillins in 61.2% of cases, to piperacillin/tazobactam (P/T) in 55.1%, to fluoroquinolones (ciprofloxacin) in 55.1%, and to 3GC in about 48% (cefotaxime/ceftriaxone 49%, ceftazidime 46.9%); regarding aminoglycosides, Klebsiella spp. was non-susceptible to gentamicin in a quarter of cases (26.5%) but resistance to amikacin was never described (0%). Other Enterobacterales (N = 32), encompassing Proteus spp., Morganella morganii, Providencia spp. and Serratia spp., were frequently non-susceptible to aminopenicillins (45.2%), fluoroquinolones (38.7%) and 3GC (61.3% ceftazidime and 22.6% cefotaxime/ceftriaxone), but lower rate of resistance to P/T (6.3%) was identified.
Supplementary Table 1 describes the distribution of isolates and their susceptibility profiles according to the urban areas of origin.
Factors associated with the isolation of 3GC “non-susceptible” pathogensIn the Table 2 we compared the characteristics of 99 patients with UTI caused by a 3GC “non-susceptible” pathogen with those of 177 patients with UTI caused by a 3GC-susceptible (3GC-S) strain. We have evaluated 276 out of the 288 total patients because for 12 subjects the susceptibility profile of isolated strains was not available.
Table 2 Patient characteristics stratified according to isolation of 3GC-R EnterobacteralesPatients in the 3GC “non-susceptible” group were older (73 versus,vs., 70 years, p = 0.03), with more comorbidities (median CCI 2 vs. 1, p = 0.03), they more frequently had a nephrostomy (5.1% vs. 1.1%, p = 0.047), and underwent more frequent urinary device (catheter, nephrostomy or urinary stent) replacement in the previous 30 days (15.2% vs. 6.2%, p = 0.02). We found no significant differences in the antibiotic intake in the previous 3 months (p = 0.107), but we did find a significant difference in history of previous hospitalisation (21.2% vs. 6.2%, p < 0.001) and long-term care facility stay (7.1% vs. 1.7%, p = 0.03).
At multivariate logistic regression analysis, shown in Table 3, the admission to a hospital in the previous three months, was independently associated with isolation of a 3GC- “non-susceptible” pathogen, with an Odds Ratio (OR) of 3.04 (95% Confidence Interval, CI, 1.35–6.85, p = 0.007).
Table 3 Multivariate analysis for isolation of 3GC-R EnterobacteralesClinical characteristics at baseline and outcome according to the presence of 3GC “non-susceptible” pathogensAt baseline, patients with UTIs caused by 3GC “non-susceptible” strains experienced more severe infections (p = 0.003), with a higher SOFA score (2 vs. 1, p = 0.008) (Table 2). A different distribution of pathogens between the two groups also emerged, with Klebsiella spp. isolated more frequently in the study group (p = 0.003) (Table 2). Regarding empiric treatment, patients in the study group more frequently received piperacillin/tazobactam (44.4% vs. 18.6%, p < 0.001) and carbapenems (5.1% vs. 0.6%, p = 0.01), whereas aminopenicillins were the most prescribed drugs in the control group (48.0%, p = 0.018) (Table 2). Empiric therapy was less frequently adequate in the study group compared to the control one (47.3% vs. 79.6%, p < 0.001) (Table 2).
A significant worse 7-day clinical response (70.7% vs. 87.4%, p = 0.002) and a significant higher 30-day mortality (16.7% vs. 6.7%, p = 0.025) were observed in patients with infections caused by 3GC “non-susceptible” compared to 3GC-S pathogens (Table 2).
Factors associated with 30-day mortalityLastly, we compared 22 patients who died at 30 days with 195 who survived (Table 4). Patients who died presented a higher median age (79 vs. 72, p = 0.004), more frequently had a urinary catheter (p = 0.03), and were more frequently admitted to a long-term facility (p = 0.004). Moreover, they experienced more severe infections (p = 0.003), with a higher median SOFA score (4 vs. 1, p < 0.001), had a higher rate of UTIs caused by 3GC “non-susceptible” strain (p = 0.025), received less frequently an active empiric therapy (40.9 vs. 63.6, p = 0.015), and had a worse clinical response 7 days after the start of the treatment (31.8% vs. 85.6%, p < 0.001).
Table 4 Patient characteristics stratified according to 30-day mortalityIn a multivariate logistic regression analysis (Table 5), a good 7-day clinical response was the only variable protective for 30-day mortality (OR 0.11, 95% CI 0.04–0.36, p < 0.001).
Table 5 Multivariate analysis for independent predictors of 30-day mortality
Comments (0)