
Remember me
A total of 683,741 hospital admissions recorded as S-LRTIs were identified in the study period, mostly in males (387,009, 56.6%) with a median age of 68.7 [65.1; 70.8] years. Overall, the median LOS was 15.3 [13.1; 17.0] days (Table 1). Unknown etiology S-LRTI was observed in nearly half of the cases (338,211, 49.5%) and was associated with 12.3% intra-hospital mortality (41,627 deaths) and 4.0% ICU admission rate (13,625 admissions).
Table 1 Characteristics and outcomes of the study population, categorized by the etiology of the diagnosed respiratory syndromeOutcomes and SeasonalityOver the whole period, bacteria and COVID-19-related S-LRTIs groups showed similar rates of hospitalizations and ICU admissions. In contrast, intra-hospital mortality was higher for COVID-19 (36,446, 22.0%) than for bacteria (20,143, 13.9%) infections. Viral, non-COVID-19 S-LRTIs included the youngest patients (32.7 [21.4; 39.6] years), the lowest intra-hospital mortality (1114, 3.2%), and the shortest median LOS (11.9 [8.8; 15.4] days). ICU admission and intra-hospital mortality rates were significantly different among the four LRTIs groups, with COVID-19-related S-LTRIs having the highest values for both (Table 1).
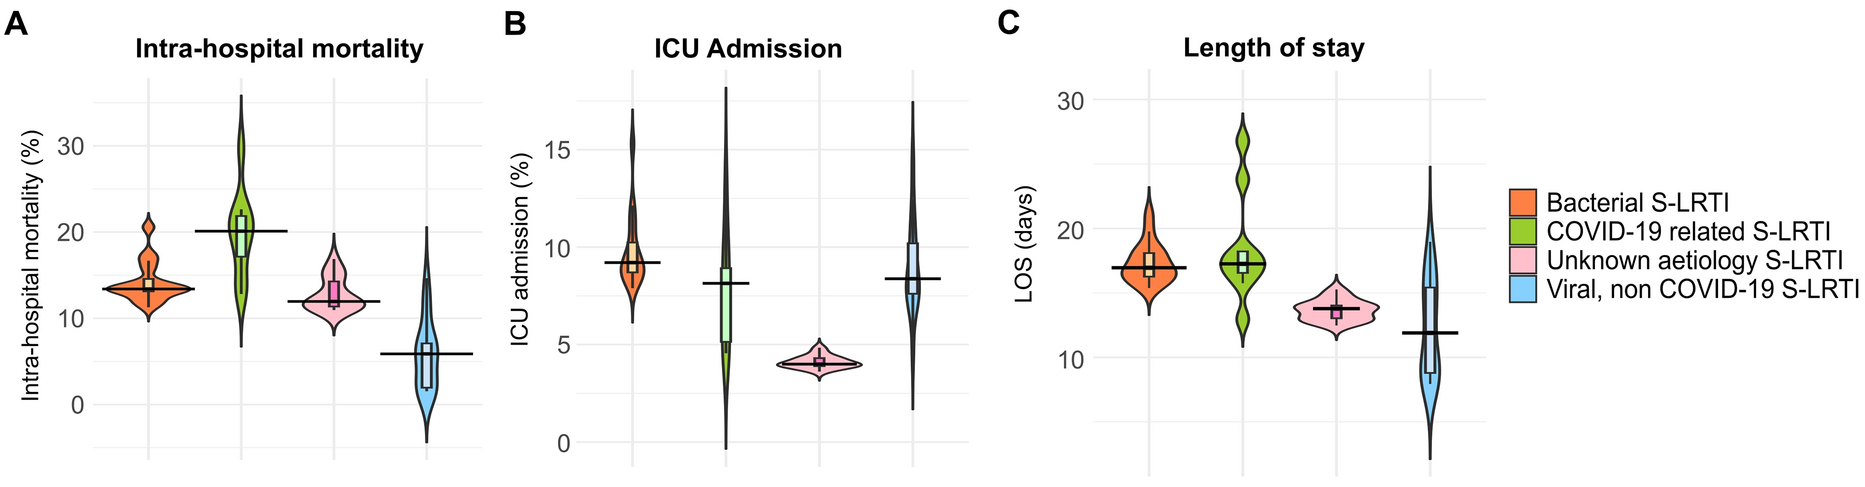
Figure 1 shows the distribution of medians obtained for all considered outcomes in each season over the whole period. We observed statistically significant differences in the median distributions of mortality and ICU admission rates for unknown etiology S-LRTI (p < 0.001) (Table 2). Unknown etiology S-LRTI demonstrated lower intra-hospital mortality compared to COVID-19-related S-LRTIs, but higher than other viral S-LRTIs (Fig. 1A). Differently, unknown etiology S-LRTIs were associated with lower ICU admission rates compared to those of the other three groups of S-LRTIs (Fig. 1B). Additionally, unknown etiology S-LRTI was associated with a significantly shorter LOS compared to COVID-19, and bacteria-related hospitalization (p < 0.001, Fig. 1C).
Fig. 1
Violin plots illustrating the distribution and median values of seasonal mortality (A, upper), ICU admissions (B, middle), and mean LOS (C, lower) of each S-LRTI group for the 2016–2024 period. S-LRTI Severe lower respiratory tract infection
Table 2 Comparisons of the median values of cumulative distributions for intra-hospital seasonal mortality rates, ICU admission rates, and LOS across the evaluated seasons comparing respiratory syndromes with unknown etiology and those with confirmed bacterial or viral detectionsAge-specific data for the considered clinical outcomes, divided across the “warm” and “cold” seasons, are shown in Fig. 2.
Fig. 2
Tentative plots representing the distribution of hospitalization outcomes across age groups 0–6 years (A), 7–17 years (B), 18–59 years (C), 60–74 years (D), and > 75 years (E) across two time periods: “Cold” Season (November to April of the following year) on the left, and “Warm” Season (May to October) on the right, for the years 2016–2024. ICU intensive care unit
A total of 73,291 hospitalizations for S-LRTI were observed in the pediatric population (10.7% of total), most among 0–6 years old children (65,191, 88.9%). The cumulative number of intra-hospital deaths each year in the age group < 18 years was very low (minimum 2, maximum 9 intra-hospital deaths).
In the 0–6 years age bracket, S-LRTI of unknown etiology represented the highest number of hospitalizations (37,454, 57.5%), followed by viral, non-COVID-19 S-LRTIs (21,727, 33.3%), particularly prevalent in the “cold” seasons. Bacterial and COVID-19-related S-LRTIs caused less hospitalizations (5765 and 245, 8.8% and 0.4%, respectively), but were associated with higher in-hospital mortality (22 and 2, 0.4% and 0.8%, respectively), and ICU admission rates (446 and 29, 7.7% and 11.8%, respectively) as shown in Fig. 2A.
Conversely, the group 7–17 years counted 8100 patients (11.1%). In this age group, unknown and bacterial etiology S-LRTIs were the most frequently observed (2136 and 4736, 26.4% and 58.5%, respectively) and adverse outcomes were rare (Fig. 2B).
Most detected hospitalizations, and hospitalization-related outcomes, were in the adult populations (18–59, 60–75, and > 75 years groups, Fig. 2C–E) with 610,450 inpatients (89.3%). COVID-19-related S-LRTIs had the highest overall mortality in both “cold” and “warm” seasons, and this was particularly true for the 18–59 and 60–74 age groups (Fig. 2C, D).
Differently, we noticed a greater degree of heterogeneity in the etiologies of S-LRTIs in patients > 75 years, with numerous hospitalizations, and fewer ICU admissions. In this group, unknown etiology S-LRTIs remains the most represented, particularly in the “warm” seasons, where their prevalence surpassed the one of COVID-19-related S-LRTIs (Fig. 2E).
Temporal TrendsDuring the first pandemic period (2019–2022), COVID-19 was the most frequent cause of hospitalizations and outcomes, remaining relevant in subsequent years. Bacterial, viral, and unknown etiology S-LRTI cases were lowest from May 2020 to May 2022, then returned to pre-pandemic levels for viral and bacterial S-LRTI. Notably, viral non-COVID-19 S-LRTI hospitalizations peaked in 2022–2024, coinciding with the lowest number of unknown etiology S-LRTI diagnoses, excluding the first two pandemic years (Fig. 3A).
Fig. 3
Temporal trends for total number of hospitalizations (A, top), ICU admissions (B, middle), and intra-hospital mortality (C, bottom). Warm and Cold on the x-axis represent the “Warm” and “Cold” seasons as identified in the Methods section (“Warm season” covering the May 1 to October 31 period and “Cold season” for the November 1 to April 31 period)
In the same 2022–2024 period, we also observed the highest number of ICU admissions for bacterial and viral, non-COVID-19 causes, but the hospitalizations total grew more, resulting in reduced admission rates (Fig. 3B). Patterns of intra-hospital mortality rates were alike, recording the highest mortality rates for viral, non-COVID-19 S-LRTI and bacterial etiology S-LRTI in the first pandemic period (2019–2021), decreasing in the following two (2022–2024) years (Fig. 3C). Consistently, ICU admissions and intra-hospital deaths for unknown etiology S-LRTI were lower in the post-pandemic period, with similar rates compared to the years before the COVID-19 pandemic (Fig. 3B, C).
Lastly, the proportion of hospitalizations for unknown etiology S-LRTI significantly changed over time (p < 0.001) and this was accompanied by a significant change in the COVID-19-related (p < 0.001) and bacterial (p = 0.042265) S-LRTI hospitalizations (Table 3). When comparing the pre-pandemic pooled proportion of unknown etiology S-LRTI hospitalizations (154,751 hospitalizations over 3 years, 68.8% of the total) with the data collected from the 2019–2020 “cold” season onwards (183,460 hospitalizations over 5 years, 40.0% of total), the numbers differed significantly (p < 0.0001).
Table 3 Number of hospitalizations per year for each S-LRTI group over the 2016–2024 period
Comments (0)