
Remember me
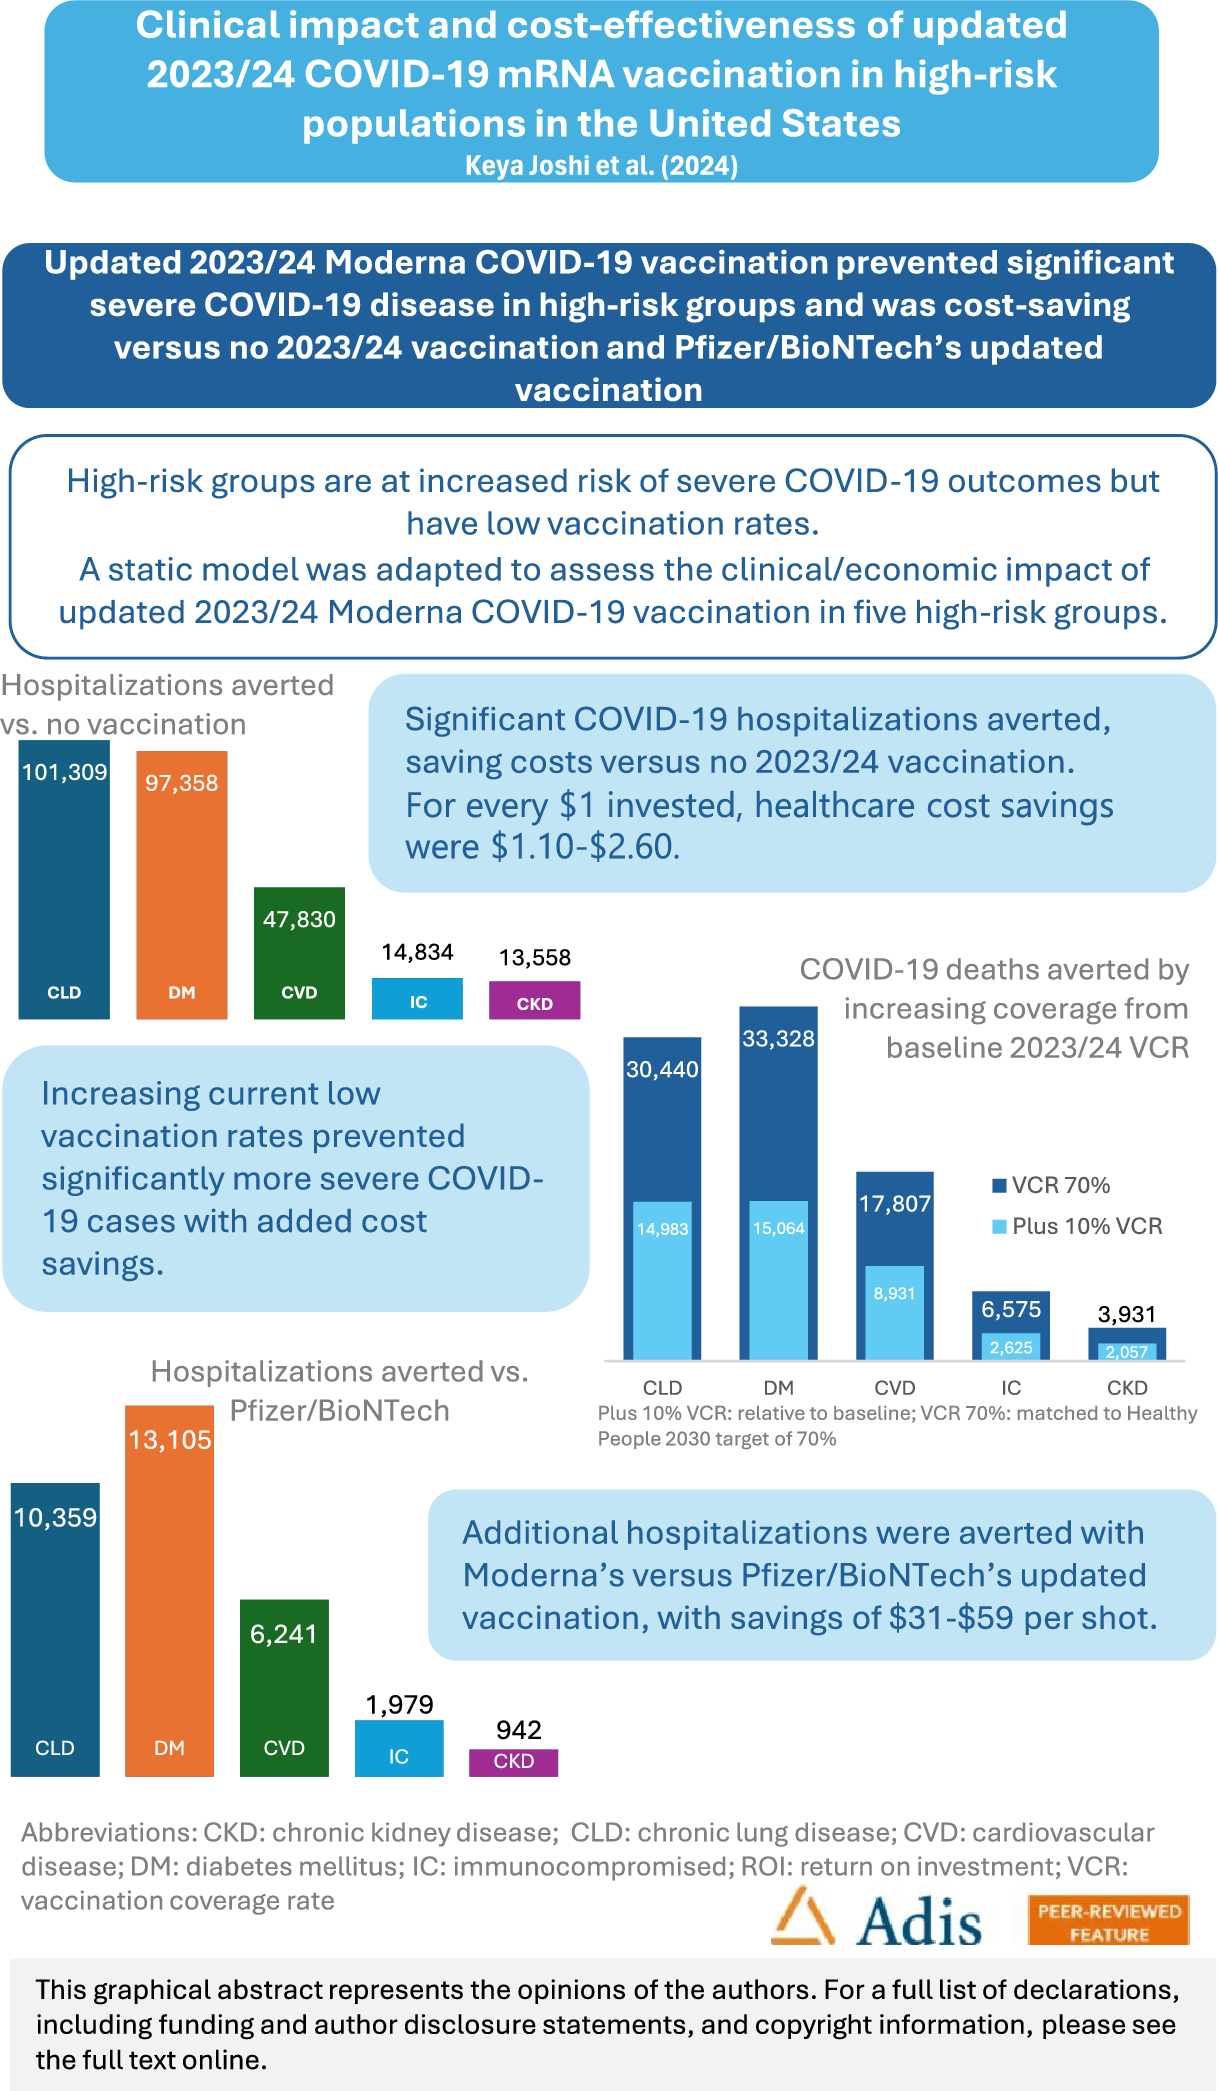
A published static Markov model developed in Excel [20, 21] was adapted for the US, to assess the cost-effectiveness of updated Moderna COVID-19 vaccination versus no vaccination in the 2023/24 season, regardless of prior vaccination history, in a primary analysis, in high-risk adults previously diagnosed with the following conditions: IC or with CLD, DM, CVD, or CKD (previously defined [22,23,24,25,26,27]). Vaccination and healthcare costs were included (healthcare payer perspective), as well as lost productivity costs (societal perspective). The model time horizon was 1 year, from September 1, 2023, to August 31, 2024. In a secondary analysis, the clinical impact and cost-effectiveness of vaccination with Moderna’s versus Pfizer/BioNTech’s updated vaccines was compared.
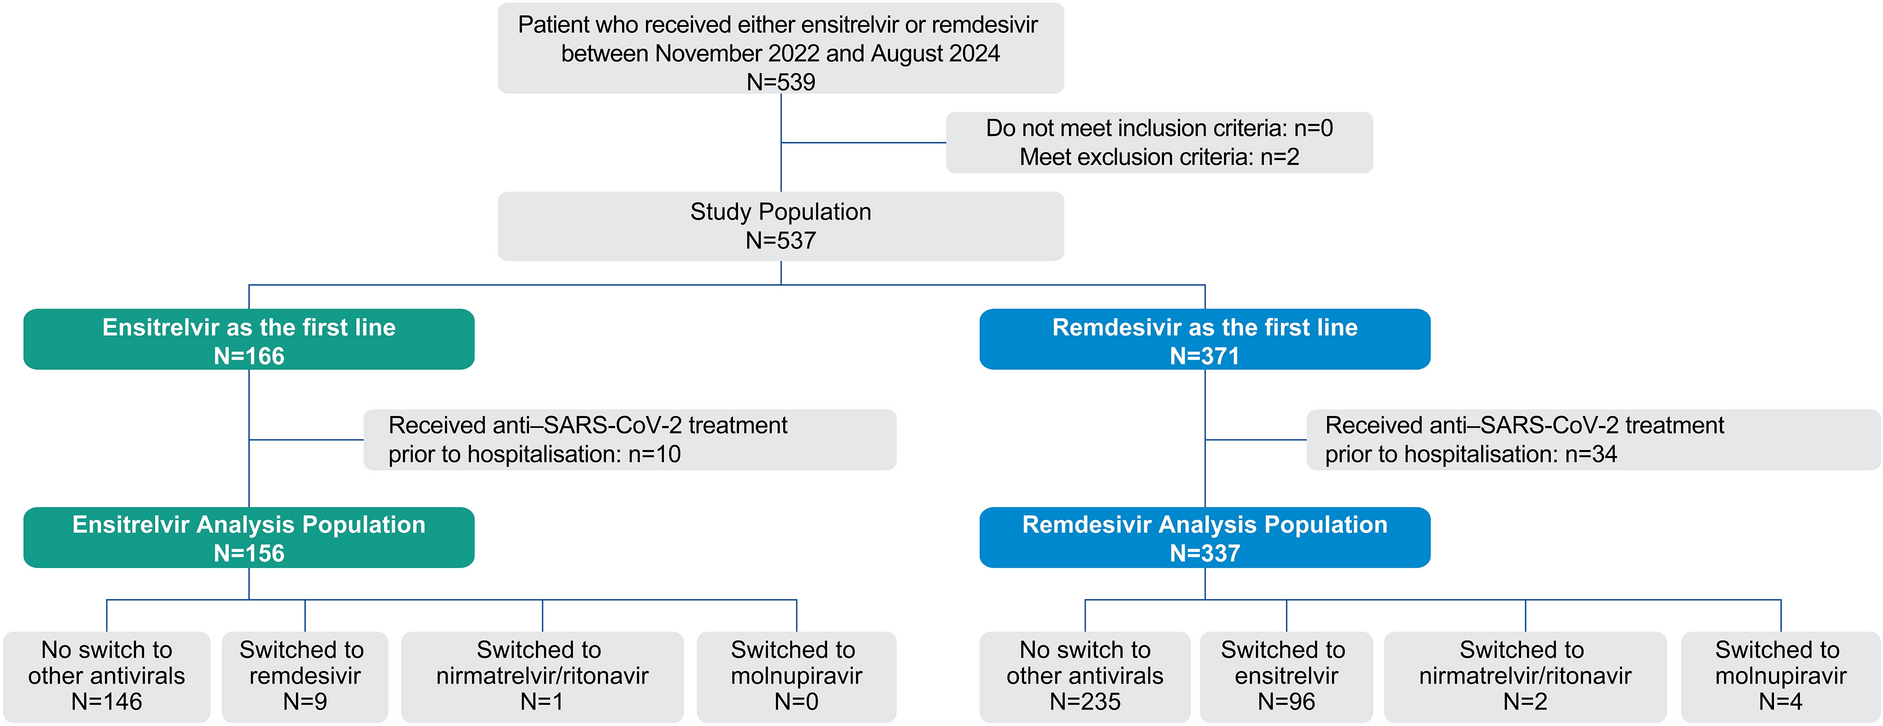
Model OverviewThe cohort in the static Markov model began in the ‘Well’ health state and had a given risk of symptomatic infection each month based on the projected monthly COVID-19 incidence. The risk of infection was lower for those vaccinated. Progression pathways through the model are illustrated in the decision tree (Fig. 1). COVID-19 deaths were assumed to only occur in hospitalized cases, and all infected individuals could develop long COVID.
Fig. 1
Decision tree model overview based on [21]. ICU: intensive care unit; *risk of inpatient care dependent on vaccination status; **post-infection consequences in survivors included a risk of long COVID, stratified by hospitalization status
Input Parameters and Model AssumptionsPopulationThe model population included US adults (≥ 18 years) with highly prevalent (including among young adults) underlying conditions associated with higher risk for severe COVID-19 outcomes i.e., CLD, DM, CVD, CKD and IC populations [17] (Table S1). Each population was assessed separately, as adults may have multiple high-risk conditions [7]. The population sizes were, for individuals with CLD 37.0M [22], DM 29.3M [23], CVD 16.6M [24], IC 7.0M [25], and CKD 3.7M, based on adults diagnosed/aware of CKD, assuming that 90% of an estimated 37M US adults living with CKD are undiagnosed, or not aware of having CKD [26, 27]. The distribution across model age groups was based on single-year US general population estimates [28] and prevalence data [25, 29].
IncidenceMonthly symptomatic COVID-19 incidence (Table S2) was informed by a dynamic susceptible–exposed–infected–recovered (SEIR) model developed for the US, calibrated to ensure the model predicted a valid number of infections [30].
Vaccine Effectiveness and CoverageThis analysis for updated vaccination in 2023/24 considered the XBB1.5 vaccine; however, it should be noted that the 2023/24 COVID-19 vaccines and prior formulations are no longer authorized for use in the US.
Initial VE of the updated Moderna COVID-19 XBB1.5 vaccine in high-risk populations was based on analysis of claims data from September 12 to December 31, 2023 [31]. After the first month of vaccination, monthly linear waning rates for protection against infection and hospitalization were applied, assuming the same waning rates of a monovalent booster dose against omicron during an omicron-dominant period, assessed in a meta-analysis [32]. This was in line with previous economic analyses of COVID-19 vaccination in the US [30] and in IC populations in Canada and France [20, 21]. VE against infection was 34.50% (with waning of 4.75% per month) and VE against hospitalization was 58.70% (with waning of 1.37% per month) (Table S7).
The VE for the updated Pfizer/BioNTech COVID-19 vaccine was estimated by applying a relative vaccine effectiveness (rVE) to the VE estimates of Moderna’s updated COVID-19 vaccine (Table S7). The rVEs were based on a large database analysis comparing the bivalent (original/Omicron BA.4/BA.5) COVID-19 mRNA vaccines from Moderna (mRNA1273.222) and Pfizer/BioNTech (BNT162b2) [17], which included data in adults with CLD, DM, CVD and IC adults. The same linear VE waning rates were applied for Moderna’s and Pfizer/BioNTech’s vaccines.
The base-case considered one-dose vaccination starting in September 2023. Vaccination coverage (Table S8) was based on cumulative observed COVID-19 vaccination coverage between September 24, 2023 and February 24, 2024 (2023/24 season), reported by the CDC [15]. Uptake was assumed to occur over a 6-month period between September 2023 and February 2024, based on observed uptake, and was assumed to be the same for both vaccines.
Vaccinated individuals could experience vaccine-related adverse events: grade 3 local (4.90%) or systemic (7.61%) infection-related events, anaphylaxis (0.0005%), and myocarditis/ pericarditis (ages 18–39 only, 0.0018%) [30]. The risk of adverse events was assumed equal for Moderna’s and Pfizer/BioNTech’s updated vaccines, and based on the previous US economic analysis for COVID-19 in the general population [30].
ProbabilitiesThe proportion of patients not hospitalized with outpatient care (41.00%) was based on influenza data (CDC 2019/20 influenza season) [33]. The rate of hospitalization given symptomatic COVID-19 infection in the unvaccinated general population (10.54% for adults) [31] was adjusted for high-risk groups by applying a RR from data on disease burden in patients with medical conditions [29, 34] (data on file) i.e., CLD RR of 1.52; DM RR of 2.01; CVD RR of 1.59; IC RR of 1.20; and CKD RR of 1.89. Although the COVID-19 hospitalization rate is expected to increase with age [35], the model conservatively assumed the same hospitalization rate across all age groups (Supplementary File S1, Table S3).
For patients with CKD, CLD, CVD and DM, the distribution by in-hospital level of care [no intensive care unit (ICU) or ventilator; ICU only; ventilator] was derived from the CDC COVID-NET hospitalization tracker in the season 2023/24 [36]. Due to the lack of condition-specific data, the general population estimates were assumed to be applicable for these populations. The distribution for the IC population was estimated by applying a RR to general population CDC data [35, 36] (Supplementary File S1, Table S3).
For patients with CVD, DM and IC, in-hospital mortality was estimated by applying RRs to the general population mortality due to COVID-19 [36], resulting in an RR of 1.23 for DM [37], of 1.62 for CVD [38], and 1.74 for IC [39]. For patients with CKD and CLD, in-hospital mortality rates were informed by CDC data reported for the general population [36], in line with previous studies [40, 41]. It was assumed that in-hospital mortality rates were the same across all levels of care. (Supplementary File S1, Table S3). The risk of post discharge mortality was based on previous estimates from a US economic analysis of COVID-19 [30], due to the lack of data in high-risk patients, and assumed to be the same for ICU only and ventilator (Table S3).
The risk of hospital re-admission by location of care was estimated by applying a RR to general population data [30, 42] i.e., CLD RR of 1.08 [42], DM RR of 1.27 [42], CVD RR of 1.38 [42], IC RR of 1.15 [43], and, for CKD, data were derived from the United States Renal Data System (USRDS) [44], and assumed to be the same for all levels of care. It was assumed that re-admission rates were the same for all model age groups (Supplementary File S1, Table S3).
Post-infection quality-adjusted life-year (QALY) losses and medical costs were assumed to occur in the year following acute infection and were more severe in hospitalized cases and older age groups [30, 45], while productivity losses were assumed for severe long COVID cases. For patients with CLD, CVD, DM and IC, the proportion of individuals with long COVID (overall and severe) was based on a previous US economic analysis for COVID-19 [30], due to a lack of data in the high-risk population. For patients with CKD, the proportion of people with additional impact from long COVID (e.g., severe long COVID) was adjusted by data from the USRDS [44] (Table S4).
The probability of hospitalization due to infection-related myocarditis in high-risk symptomatic patients was assumed to be the same as for the general population, and was based on a previous US economic analysis for COVID-19 [30] (Table S4).
Resource Use and CostsDirect healthcare costs included vaccination [46, 47] and vaccine administration costs [48], as well as acute outpatient care ($460.57), hospitalization with no ICU or ventilation ($15,089), with ICU only ($27,058) and with ventilator ($71,367), and inpatient follow-up per case ($1075), adjusted for each high-risk population when data were available. The proportion of patients not hospitalized with outpatient care (41.00%) was estimated using data on influenza from the CDC during the 2019–2020 influenza season [33]. Hospitalization costs for the general population [49] were not adjusted for the CLD population, as no increase in hospitalization costs was reported for patients with COPD [9], and this was assumed to be the same for patients with CLD. For patients with CKD, CVD, DM and IC, the general population hospitalization costs [49] were adjusted by a relative cost ratio [9] of 1.08 for DM, of 1.11 for CVD, of 1.25 for the IC population, and of 1.64 for CKD. Post-infection costs [10] reflected all medical costs incurred in the post-acute period for high-risk populations and varied by age and outpatient/inpatient status (Table S5).
Indirect lost productivity costs (Table S5) were included from a societal perspective, for those actively participating in the labor force, with calculations for the number of lost working days due to vaccine administration, outpatient care, hospitalization, hospitalization recovery and severe long COVID (see Supplementary File S2 for detailed estimations also considering adjustments for increased productivity losses due to the underlying condition).
QALYs/UtilitiesThe model applied baseline utility values stratified by age group [50], and utility decrements sourced from 5UM-CDC data [51] and a previous US economic analysis of COVID-19 in the general population [30], assumed to apply to high-risk populations (Supplementary File S2, Table S6).
Scenario AnalysesKey model inputs were varied in one-way scenario analyses, and the impact on healthcare cost-savings and on QALYs saved was assessed. For the comparison versus no updated vaccination: both higher and lower incidence rate scenarios were assessed, using data from the dynamic SEIR model [30] (Table S2); and variations in RR for hospitalization (Table S3); VE against infection and against hospitalization (Table S7); waning of VE against hospitalization (Table S7); and inpatient and post-infection costs (Table S5) were varied. For the comparison against Pfizer/BioNTech’s updated vaccine, a scenario assessed the impact of varying the rVE estimates (Table S7).
The impact of increasing relative vaccination coverage rates (VCR) by 10% compared with the current coverage (i.e., the observed VCR for the 2023–2024 season), and of achieving the target VCR reported for influenza of 70% [52] across all age groups was assessed (Table S8). A scenario assessed the impact of two-dose vaccination versus no updated vaccination, with an additional spring vaccine dose for people aged ≥ 65 years who received the updated vaccination. Uptake for the spring dose was assumed between March and April, reaching 10% coverage in April, based on data on the proportion of people who received two doses by April 27, 2024 [15] (Table S8).
Compliance with Ethics GuidelinesThis analysis is based on previously conducted studies and does not contain any new studies, with human participants or animals, performed by any of the authors.
Comments (0)