
Remember me

In total 61 participants participated in the study. They were all students at the Faculty of Behavioural and Movement Sciences of the Vrije Universiteit Amsterdam or friends of students. The participants were divided into two groups that practiced with a different reward criterion. In the Adaptive group (N = 30, age 22 ± STD 3 years, 20 female, 8 male, 2 non-specified), the reward criterion was adapted to the participant’s performance whereas in the Fixed group (N = 31, age 21 ± STD 3 years, 23 female, 6 male, 2 non-specified), the reward criterion was fixed. The data of 6 of the 30 participants in the Adaptive group 24 were measured specifically for the current study; the other 24 were measured using a slightly different protocol in a previous study (van der Kooij et al. 2023). All participants in the Fixed group were measured in the current study. Ethical approval for both studies was provided by the local ethics committee.
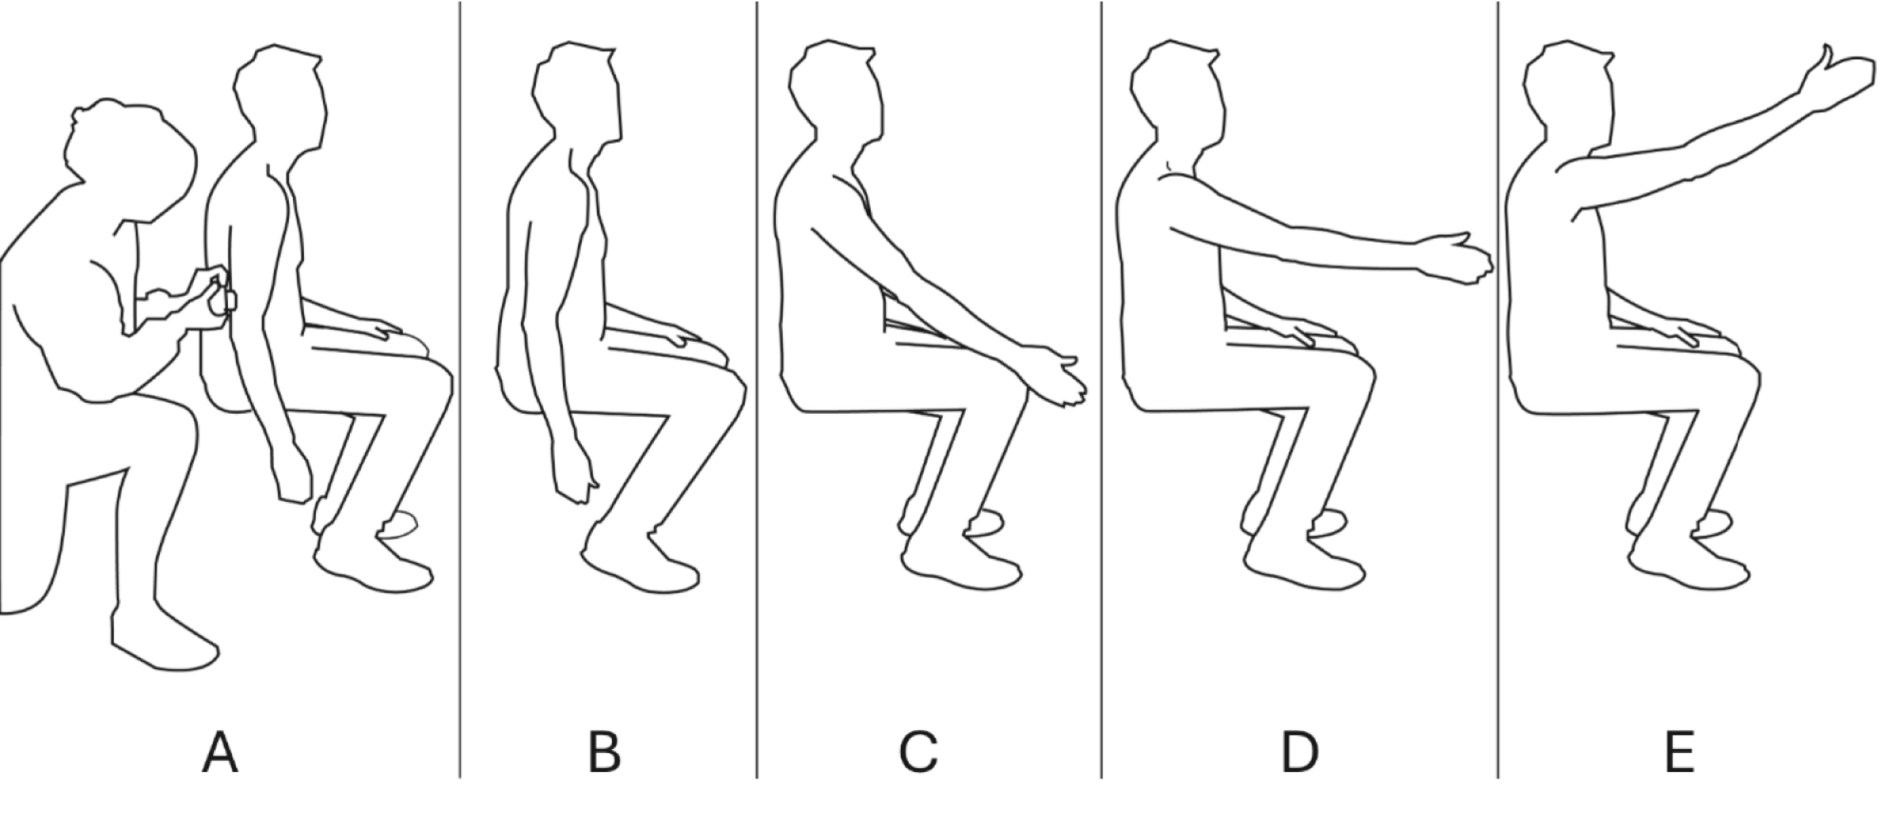
TaskThe task was the same as in a previous study (van der Kooij et al. 2023), except for the addition of a fixed reward criterion and the task being administered in the lab rather than at home. Participants performed a stencil-based task in which they viewed 1 cm diameter circular targets (random colour other than red or green) at the centre of a laptop screen and made erasing-like movements on a Wacom tablet (Intuos Medium, 4096 pressure levels) positioned on the table (Fig. 2) with a stylus that could register the force on the tip of the pen up to about 50 N. The movement of the stylus was displayed on the computer screen with the standard cursor. We report forces in normalized Wacom units (ranging from 0 to 100), rather than Newtons as part of the data was collected at home without supervision, so we are not sure about the tablet settings used. The participants were instructed to move the pen in such a way that it ‘erased’ the entire target area. They were furthermore instructed to perform the erasing movement with the correct force (randomly chosen from a range of 20–80 Wacom units); they had to find this force through binary reward feedback.
To start a trial, the participant moved the cursor to a start position (diameter 0.1 cm, 1 cm below the edge of the target). Once the cursor was in the start position, the target appeared, and the participant could move toward the target and start erasing. Once the cursor hit the target, we started recording the force with which the participant made the erasing movement. After 1.5 s we provided reward feedback based on the applied force: the mean force during the last second of the erasing movement. If a trial was rewarded, we coloured the target green. Otherwise, it turned red.
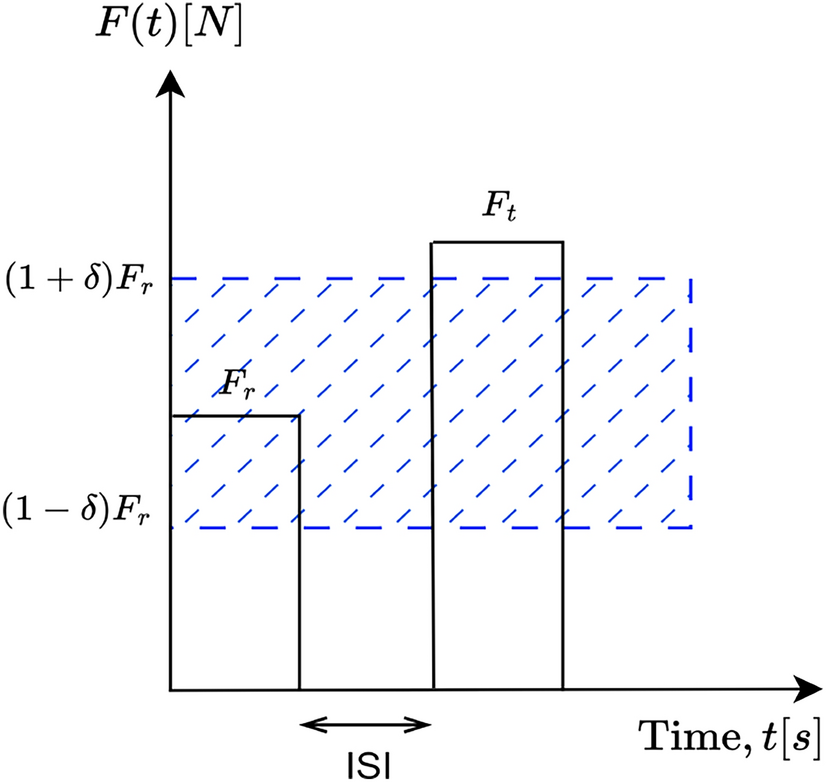
The reward criterion (range of forces that were rewarded) differed between the two groups. Participants in the Fixed group were rewarded if the applied force was within 5 Wacom units from the target force (the ‘fixed criterion, Fig. 1.b’). Participants in the Adaptive group were rewarded both when the applied force was within the fixed criterion and when the applied force was within an adaptive reward criterion. This adaptive reward criterion was based on force errors: the absolute difference between the applied force and the target force. If the force error in a trial was smaller than the 40% percentile of the errors in the previous ten trials, the trial was rewarded. For the first ten trials, participants were only rewarded based on the fixed criterion. To end the trial, the participant returned the cursor to the starting position.
For both groups, we considered the target force to be found once the applied force satisfied the fixed reward criterion in eight out of ten trials. To evoke exploration throughout the 300-trial task, we used a new target force once a target was found or had been attempted 100 times. The change of target force was communicated by a new random colour for the target. The new target force was randomly chosen, but such that it differed at least 5 Wacom unit from the previous target force, so that the old and new range of force that was rewarded according to the fixed criterion did not overlap. The task lasted 20 to 30 min. Following each resolved target, the participant indicated self-reported motivation using a Quick Motivation Index (QMI, van der Kooij et al. 2019). On a slider ranging from ‘not at all’ to ‘very much,’ participants answered two questions: (1) How much did you enjoy the task until now? (2) How motivated are you to continue? Self-reported motivation was measured as the mean QMI score across targets.
Fig. 2
Task. a) Picture of a participant performing the task. The lower-left inset shows the start position (yellow) and the target circle (red) when receiving feedback on failure. b) Trajectory of the movement of the stylus during a single trial (dashed line) sampled at 16 ms intervals. The QR code can be scanned to view the video that was used to instruct the participants about the task. c) Example data and reward criterion for a 300-trial session of a participant in the Adaptive group (top row) and for a participant in the Fixed group (bottom row). Dots are the registered forces during each trial; filled dots correspond to rewarded trials. The green area corresponds to the reward criterion
ProcedureParticipants first received information on the experimental procedure and provided informed consent. Next, they were instructed on the task with an instruction video (https://youtu.be/uda3KsNrD8g). For the current data collection, participants performed the task in the lab whereas in the previous study that was conducted during the COVID-19 pandemic, participants (24 participants in the Adaptive group) performed the task at home and were instructed in a video call.
Each participant performed 300 trials in a single session and thus experienced at least three different target forces. Participants received a break midway through the experimental phase, indicated by an instruction text. After two seconds, the next target reappeared automatically. Participants were free to decide when they initiated a movement to the target.
Data analysisThe aim of the data analysis was to quantify the exploration and learning. All data and code for the data analysis have been made publicly available at the Open Science Foundation: https://osf.io/et8qg/.
To quantify the sign of exploration, we used trial-to-trial changes in the applied force after failure (Fig. 3). These were calculated as the difference in the applied force between a trial (t) and the next trial (t + 1). A same-sign change was defined as a change in the same direction (either more or less force) for two consecutive failed trials. For trials after which the target force changed and participants had to rate their motivation, we did not calculate trial-to-trial changes. The proportion same-sign changes was calculated across all failure sequences longer than one trial. The first failure did not count as an opportunity for a same-sign change as we calculated changes relative to the previous failure (Fig. 3.c).
Based on random exploration, the expected proportion same-sign explorations relative to the target estimate is 0.5. For trial-to-trial changes, the probability for same-sign changes is 1/3. We use an example to explain the underlying logic. If we draw three values for a force (A, B, C with A > B > C), these values can be presented in six orders (ABC, ACB, BAC, BCA, CAB, CBA), which are equally probable. For these six orders, only two orders (ABC and CBA) involve repetitions of the sign of trial-to-trial changes, so a probability of 1/3. This is especially true with a fixed reward criterion, which is often far from current performance and will therefore define all possible trial-by-trial changes as failures (see Fig. 1.b). An adaptive reward criterion might affect the probability for the six orders to be selected as a failure. For instance, when the target is larger than the current performance, the trial-by-trial changes in the CBA order are more likely to be classified as successes than the ABC order (see Fig. 3.c).
We are interested in the overall quality of learning and therefore used a measure that combines the rate and the amount of learning (van Mastrigt et al. 2021). To quantify learning for each target force, we first smoothed the applied force on its corresponding trials by taking a moving average with a window containing three trials before and after, hence 7 trials in total (Fig. 3.a). For the first and last three trials, the window is asymmetric, so the smoothed force on the first trial (initial error) is the average of the first four forces and the smoothed force on the last trial is the average of the last four errors. We subsequently determined the force error (\(\:e\)) as the absolute difference between the (smoothed) applied force and the target force. Learning of each target force was determined as the force error on the first trial (the baseline error) to a target minus the average force error on the subsequent trials to the same target force. This measure is not only larger if the final amount of learning is larger, but also if learning is faster. To obtain one measure of learning across all targets of a session, we divided the total learning across all targets by the total baseline error across all targets. With this method, a value of one represents complete learning, a value of zero represents no change in performance, and negative learning values represent a worsening of performance.
To check whether the average force difference to learn was comparable across groups, we calculated the force difference to learn as the average force error on the first trial for a target.
Fig. 3
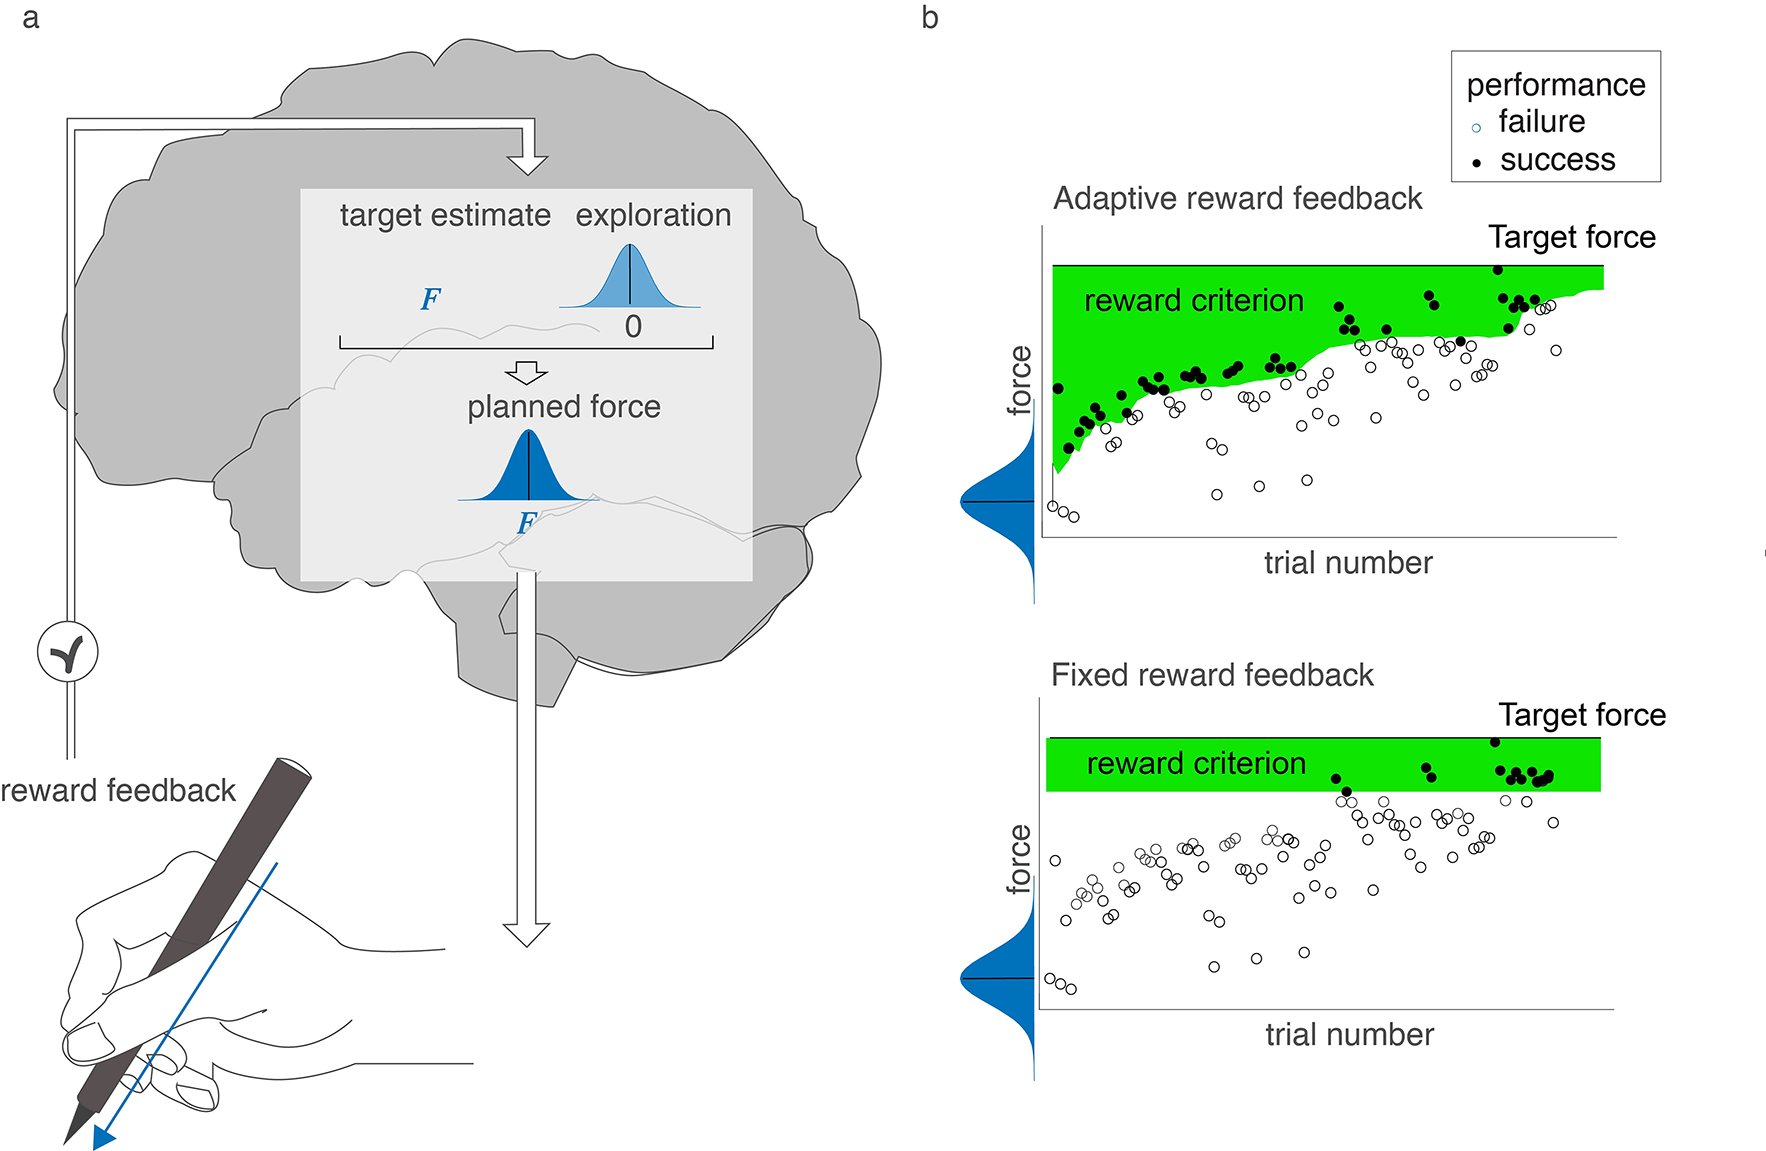
Data analysis. a) Forces on individual trials (circles) classified as failures and success as a function of trial number for a learner simulated with the Roth23 model. The horizontal lines indicate the target force at each trial and the curve represents the smoothed force that was used in the calculation of learning. b) The expected proportion same-sign changes relative to the target estimate (\(\:F\)), is 0.5. We measured same-sign changes as the sign of the trial-to-trial change in the applied force \(\:_\)). c) Illustration of the analysis of the repetition (‘rep’) of the sign of trial-to-trial change following failure for the three exploration draws (A, B, and C) with A > B > C
Statistical analysisWe predicted that, in both groups, the proportion of same-sign changes equals 1/3 as predicted by random exploration. To test this prediction, we used a two-sided one-sample t-test on the proportion of same-sign trial-to-trial changes. To explore whether the proportion same-sign changes in the behavioural data was related to learning, we performed a Spearman rank-order correlation test on the proportion same-sign changes and the learning in each group.
As motivation has been found to depend on the reward rate (van der Kooij et al., 2021) and motivation might affect motor variability (Codol et al. 2020; Manohar et al. 2015), we compared the reward rate and self-reported motivation between groups using Mann-Whitney U rank-sum tests.
Model simulationsWe used model simulations to check whether the proportion same-sign changes following failure is indeed 1/3 in the presence of learning based on performance-dependent feedback. For this, we used four different models that have been proposed by others (Cashaback et al. 2019; Dhawale et al. 2019; Roth et al. 2023; Therrien et al. 2018). As the basic structure of the models is the same, we report the details of the earliest model (Therrien et al. 2018) here and provide the details of the other models in the Supplementary Methods.
In the Therrien2018 model, we implemented our task by defining an applied force (\(\:F\)\(\:t\)) that is the sum of a target estimate (\(\:X\)), exploration (\(\:\eta\:\)), and sensorimotor noise (\(\:m\)):\(\:_=_+_+_\)
All models formalize exploration and motor noise in a trial as a random draw from a normal distribution, centred on zero, with standard deviation (\(\:_\) and \(\:_\) respectively):
$$\:_=N(0,\beta\:(R\left)_\right)$$
The variability due to exploration depends on the previous success and failure and can be learned from, whereas the variability due to motor noise does not depend on feedback and cannot be learned from. The variability due to exploration (\(\:_\)) depends on the successes and failures in the previous trial(s), with a variability scaling factor \(\:\beta\:\left(R\right)\) that equals one without reward and is less than one after reward (see Supplementary Material S1 for detail)
Following reward (R = 1), the target estimate is updated with learning rate (\(\:\alpha\:\)); without reward (R = 0) it remains unchanged:
The models further differ in whether the target estimate is updated with the rewarded exploration only (Roth et al. 2023; Therrien et al. 2018), a combination of motor noise and exploration (Cashaback et al. 2019), or with a reward prediction error (Dhawale et al. 2019). Additionally, models can update the target estimate following reward only (Cashaback et al. 2019; Roth et al. 2023; Therrien et al. 2018) or also following failure (Dhawale et al. 2019). Crucially, all models implement exploration as a random draw from a normal distribution with a zero mean.
Comparison of the models to the dataWe simulated our experiment for each of the four models and for both reward criteria (adaptive and fixed) for 1000 learners. The simulated target force and reward feedback were determined in the same way as we did for the human participants. Also, the applied force (\(\:F\)) we used to determine the exploration and the learning was capped to the Wacom detection range (0–1). We assumed that our participants were not aware of this range and therefore we did not cap the target estimate (\(\:X\)) in the simulations.
Each learner started using an aimed random value between zero and one hundred (the full range of possible normalized forces). The free parameters in the models are the width of the distributions from which exploration (\(\:_\)) and motor noise (\(\:_\)) are drawn (Cashaback et al. 2019; Dhawale et al. 2019; Roth et al. 2023; Therrien et al. 2018), learning rate \(\:\alpha\:\) (Cashaback et al. 2019; Roth et al. 2023) and the variability scaling factor (\(\:\beta\:\)).
As it can be assumed that the total variability is the sum of variability due to exploration and variability due to motor noise (van Mastrigt et al. 2021), we first estimated the total variability for each group (\(\:_\)) from the data. For each participant, we estimated the total variability based on the trial-by-trial changes following failure as in (van Mastrigt et al. 2021). This variability was averaged per group to obtain the group total variability (\(\:_\)). The standard deviation in the applied force was 5.67 for the Adaptive group and 7.86 for the Fixed group. For each of the 1000 simulated learners in the Adaptive and Fixed group, we varied the exploration fraction (\(\:a\)) in this variability from 0 to 1 in steps of 0.1 (Eq. 1.5).
$$\:_=\:\sqrt_}^}_=\:\sqrt_}^}$$
As the learning rate does not influence exploration following failure, we based the learning rate on the values reported in the literature. The learning factor we used for the Roth2023 model was \(\:\alpha\:=\)0.98 (Roth et al. 2023), for the Cashaback2019 model \(\:\alpha\:=\) 0.4 (Cashaback et al. 2019), and for the Dhawale model \(\:\alpha\:=\) 0.23 (Dhawale et al. 2019). For the Therrien2018 model, we used a variability scaling factor \(\:\left(\beta\:\right)\) of 0.2 (Therrien et al. 2018), for the Cashaback2019 and Roth2023 models we used a variability scaling factor of zero and for the Dhawale2019 model we used the variability scaling function which can be found in the Supplementary Material S1.
Additional model simulations with learning rates varying between 0 and 1 are reported in the Supplementary Material (S3). To statistically test whether the models can explain the proportion same-sign changes and learning by a certain combination of learning rate and exploration fraction, we statistically compared the median proportion same-sign changes and learning of the model simulations for each value of exploration fraction to the behavioural data using two-sided sign rank tests. We report the range of exploration fractions with which the behavioral data do not significantly differ from the simulation median.
Comments (0)