
Remember me

Fourteen adults (including three of the authors; median age 21 years old; range 20–67 years; both male and female) took part in the study. Details of the setup and calibration can be found in Brenner et al. (2023). In short, participants stood in front of a large screen (125 × 100 cm; 800 × 600 pixels; 120 Hz) onto which the starting position and target were back-projected. The room lights were on and the background was grey. The starting point was a 2 cm diameter green disk, 20 cm below the screen centre. The target was a 2 cm diameter black disk, 20 cm above the screen centre. The target was jittering laterally.
On each trial, participants had to make an upward movement from a starting point to tap on a target that jittered laterally at 120 Hz (new position every 8.33 ms) on a tilted screen (see inset of Fig. 1A). Participants were instructed to make a single movement, but they could take as long as they liked to reach the target. In the random walk block, the target followed a random walk with a 1.67 mm step size. In the stable jitter block, the target’s lateral position was selected independently for each frame from a normal distribution (Fig. 1A). Its standard deviation was 1.88 mm, so that the median size of the steps would be similar to the step size of the random walk. The mean of this normal distribution was at the centre of the screen except when it briefly shifted to quantify the response vigour (see below).
Fig. 1
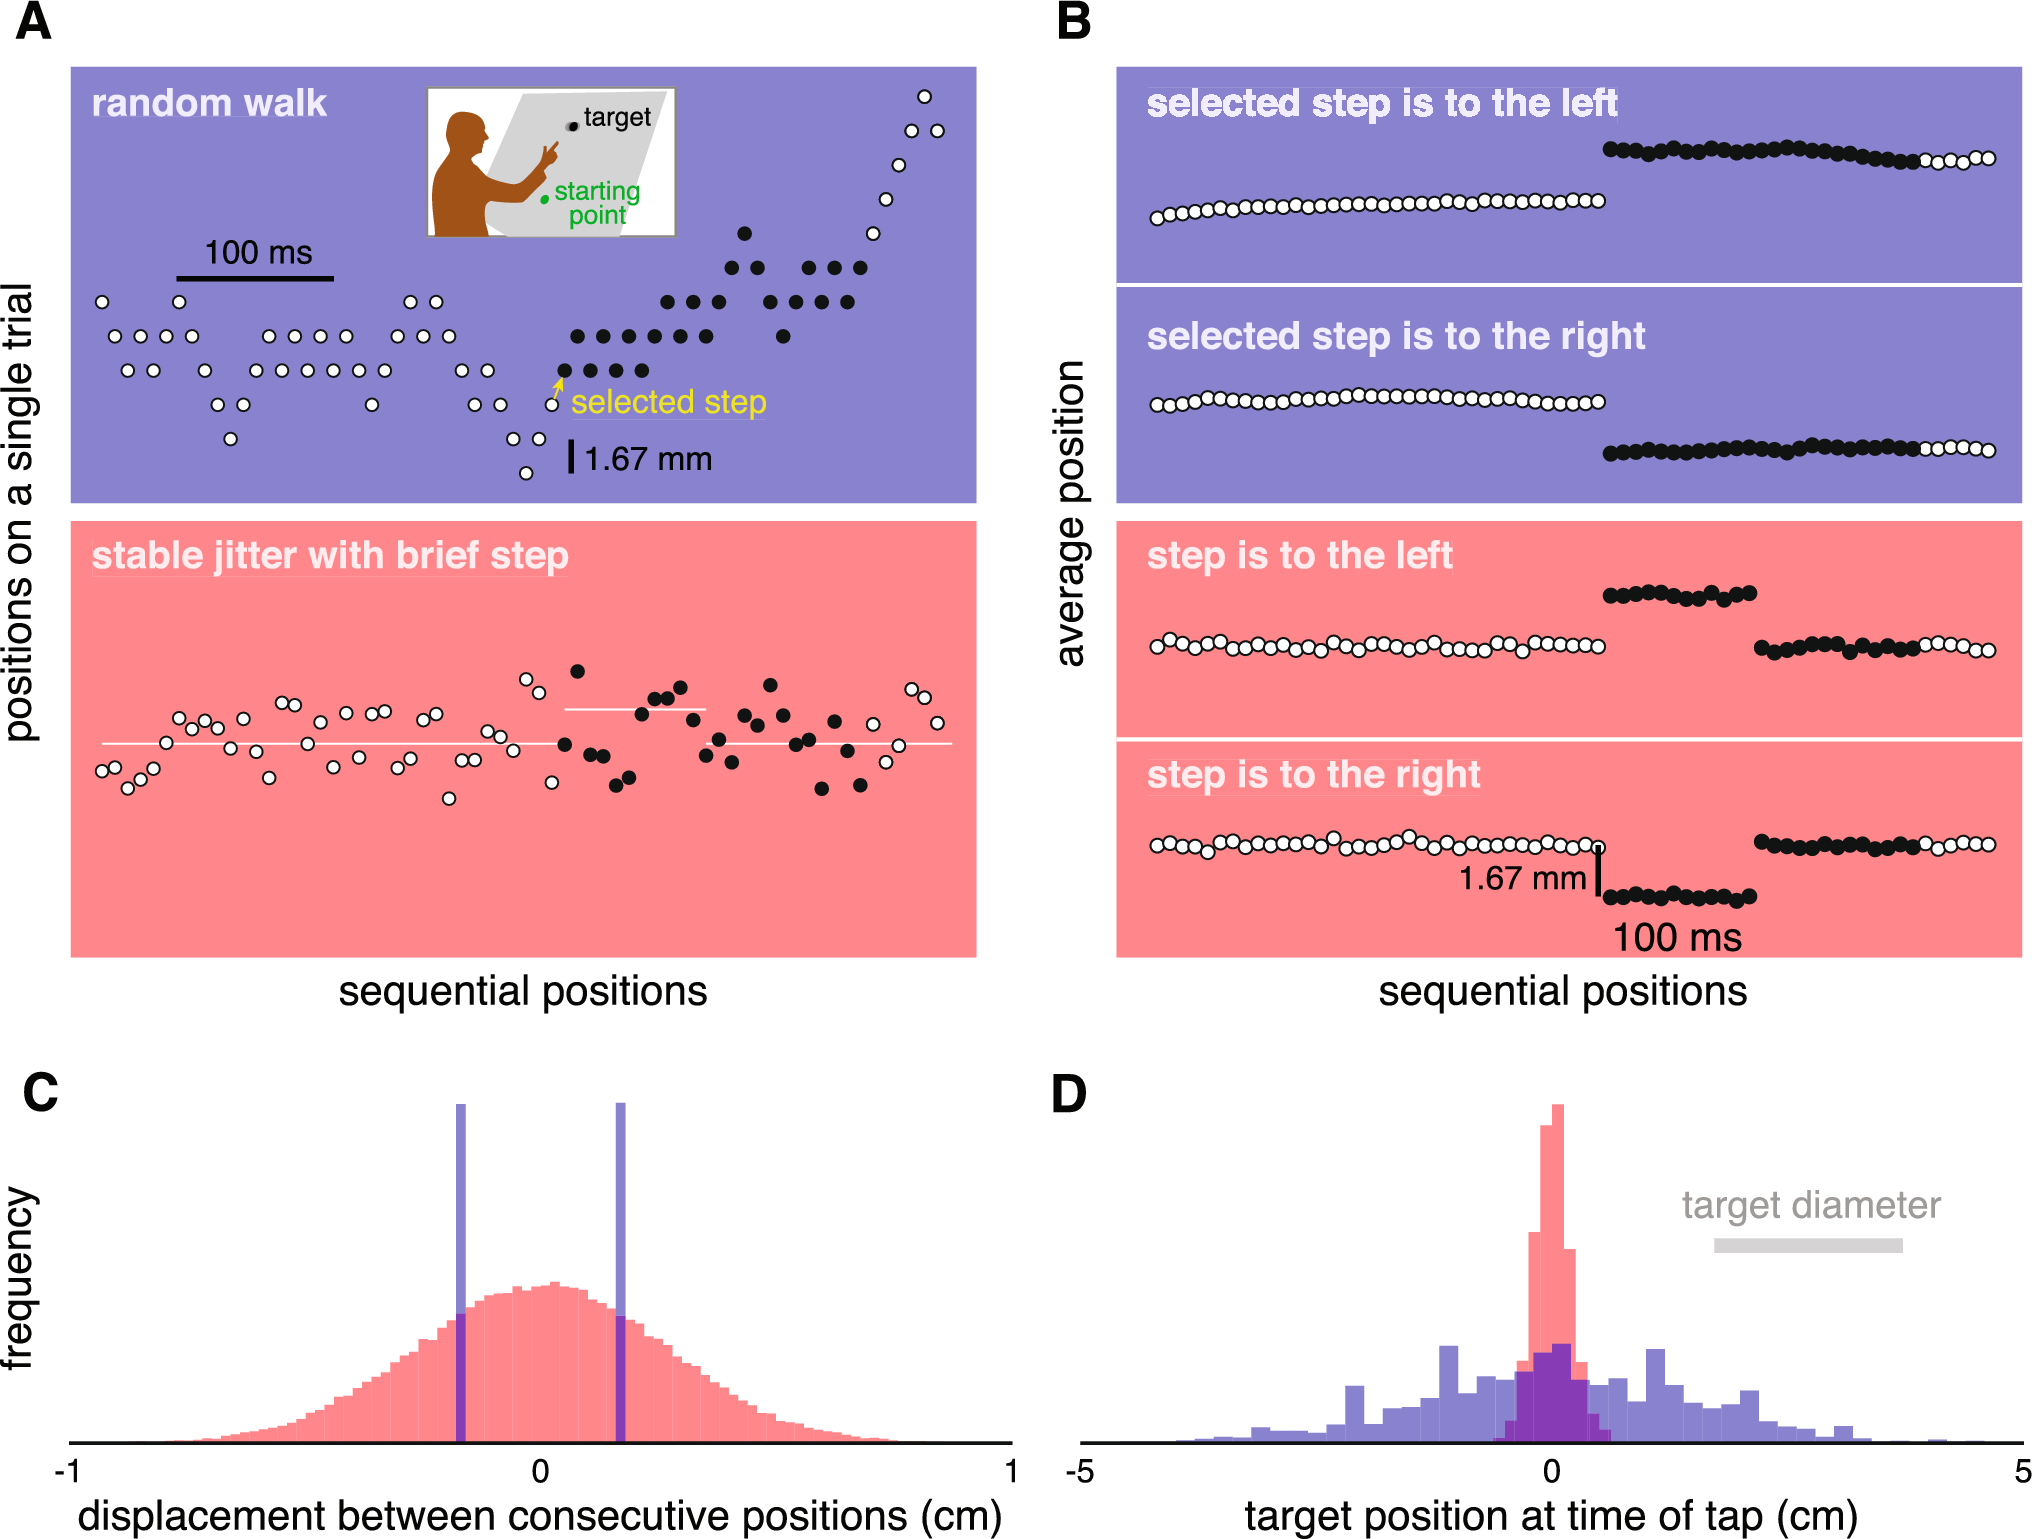
Variations in the lateral position of the target in the random walk (blue) and stable jitter (red) blocks. A Example trials. Dots show the target’s positions at different times during a single trial for each block. Target positions during the time that was used to determine the response are indicated by the dots being black rather than white. In random walk blocks, the target stepped 1.67 mm on each image frame, randomly either to the left or to the right. In stable jitter blocks, each new position was picked from a normal distribution around some value. This baseline value (white line) was the horizontal midline of the screen most of the time, but was briefly shifted by 1.67 mm to the left (as shown) or to the right on some trials. B Average target positions in each block after the trials were split into two sets (first 66 frames; 550 ms). The random walk trials were split by whether the target stepped to the left or to the right at the selected moment (yellow arrow in A). The stable jitter trials were split by whether the baseline value briefly stepped to the left or to the right. C Histogram of the displacements between consecutive target positions in the two blocks. D Histogram of the target positions at the moment participants tapped the screen in the two blocks. For clarity, the frequency scale differs between the two blocks in C and D
For targets that follow a random walk, we can determine the response to a 1.67 mm step at any moment by splitting the trials into two sets: one in which the step at that moment is to the left and one in which it is to the right (Brenner et al. 2023). Since the directions of the steps at all other moments are completely independent of the direction of the selected step, and are therefore as likely to be to the left as to the right, the average position will remain more or less the same after the selected step, so the positions will differ by twice the magnitude of the step between the two sets from that moment onwards (Fig. 1B). Thus, any systematic difference in the movement of the fingertip between the two sets of trials after that time can be considered to be a response to the position having changed at the selected moment. Until the selected moment, the average target positions are obviously about the same for both sets.
For targets that jitter at random around a stable baseline, we can’t directly use the response to the jitter to determine the vigour of a response to a 1.67 mm step, because the steps have many magnitudes (Fig. 1C) and consecutive steps are not independent (because the positions are sampled independently). Thus, although you could determine a response by separating trials by the direction in which the target stepped at a certain moment here too, one would only expect a very brief response because there will be no systematic difference between the sets for the next position. Moreover, it is not evident how one would equate the perturbation magnitude to that of the selected step in the random walk condition. To obtain a comparable measure of response vigour for such targets, we introduced a 1.67 mm shift of the baseline, 300 ms after the target appeared. To prevent this from introducing a benefit of relying on the latest value, the baseline returned to its original position 100 ms later. Thus, the average step size at the moment of interest is the same as the step of the random walk (1.67 mm), but the variability in the endpoints was much larger for the random walk (Fig. 1D). Most importantly, the latest position was the best predictor of future positions for the random walk, while it was no better a predictor than any other position in the stable jitter blocks. In fact, it was even a worse predictor during the 100 ms intervals in which the baseline shifted. Thus, if the vigour of the response to the steps that we introduced depends on the benefit of responding vigorously, for instance because it is learnt from previous trials, we expect to see less vigorous responses to the brief step in the baseline in stable jitter blocks than to the comparable steps in the random walk blocks. If movements are always guided by the latest information, the responses to the two kinds of steps should be similar.
The position of an infrared marker on the index finger of the participant’s preferred hand was measured at 500 Hz with an Optotrak 3020 (NDI, Waterloo, Ontario, Canada). A simple calibration procedure, involving placing the tip of the index finger on four dots on the screen, allowed us to convert measured marker positions in the Optotrak’s reference frame into positions of the fingertip relative to items on the screen. Deactivating a second measured marker whenever a flash occurred at the top left corner of the screen, and presenting such flashes whenever a new target appeared, allowed us to synchronise the measured fingertip positions with positions of the target on the screen to within 2 ms.
Each block started with 10 practice trials. After that, there were 200 trials per block. In the random walk block, all trials were the same except the random directions of the steps. In the stable jitter block, the baseline shifted to the right in 50 trials and to the left in 50 trials. In the practice trials and the remaining 100 trials the baseline did not shift. The 200 trials after the practice trials were randomly interleaved. As the practice trials and the trials in which the baseline did not shift were not used in the analysis, we had 300 trials per participant, and thus a total of 4200 trials that could contribute to the analysis. The order in which the two blocks were presented was counterbalanced across participants.
Participants started each trial by moving their finger to the starting point and keeping it there until a target appeared. The target appeared at a random moment between 600 and 1200 ms after the finger was placed at the starting point. If they moved away from the starting point before the target appeared, the target did not appear and they had to move back to restart the waiting period. Once the target appeared, they were to lift their finger off the screen and tap on the target. A tap was detected if the fingertip was within 5 mm of the screen and had an acceleration of at least 50 m/s2 away from the screen. If the fingertip was within the target area at the time of the tap, a sound was presented to indicate that the target had been hit, and the target was presented without jitter at its position at the time of the tap. If the fingertip was not within the target area at the time of the tap, the target moved away from the finger with respect to where it had been at the time of the tap (at 1 m/s). Thus, if the fingertip was to the right of and slightly below the target, the target moved away to the left and slightly upwards. This provided participants with accurate feedback about their errors.
To get an overall impression of performance, we determined how many targets participants hit in each block and the median amount of time it took them to do so. But we were mainly interested in how vigorously participants responded to shifts in target position. For this, we relied on determining differences between the lateral velocity of the fingertip after leftward and rightward steps. The lateral velocity was determined using a second order polynomial fit (Savitzky-Golay filter) with a window of 20 ms. Relying on differences between the movements after different steps isolates the response to the step from any other systematic lateral velocity of the fingertip (Fig. 2). For the stable jitter block, we compared the lateral velocity of the fingertip on trials in which the baseline briefly shifted to the left and to the right. For the random walk block, we compared the lateral velocity of the fingertip on trials in which the target happened to step to the left and to the right at the equivalent moment. The choice of an equivalent moment requires some thought.
Fig. 2
Determining the response and the vigour of the response. One participant’s data for the block with stable jitter. A The lateral position of the fingertip as a function of the time from when the baseline stepped to the left or to the right. Thin lines: individual trials. Thick lines: averages. The fainter curves are for leftward steps. Positive values are to the right. B The fingertip’s lateral velocity on the same trials. The difference between the average velocity after steps to the right and to the left (shaded area) is the response. C The response. Positive values are in the direction of the step. The average response between 100 and 200 ms after the step (grey bar) is the response vigour (point in inset)
Since we know that the vigour of responses to small steps in target position is larger when there is less time left in which to respond (Brenner et al. 2023), we considered the step after which there is the same amount of time left to be the equivalent moment in the two blocks. In the stable jitter block, the step in the baseline was always 300 ms after the target appeared. We determined the median time between this step and the moment of the tap, and then selected the step in the random walk block that best matched this remaining time. We did so for each participant separately, so the time from the target appearing was different for each participant (but the same for all trials by each participant).
The response is the difference between the average lateral velocity of the fingertip on trials with a rightward and leftward step (Fig. 2C). A positive response is movement in the direction of the step. Since it to takes about 100 ms to respond to a change in target position (Brenner and Smeets 1997; Brenner et al. 2023), and the step in the baseline of the stable jitter block lasted for 100 ms, we consider the responses in the two blocks to be equivalent until 200 ms after the relevant step. We therefore plot the response from the moment of the step until 200 ms after the step (black dots in Fig. 1B). We also determined the average value between 100 and 200 ms after the step for each block and participant. We use the magnitude of this average response as a measure of the vigour of the response (inset of Fig. 2C). This measure is used to evaluate whether the response is more vigorous for the random walk than for the stable jitter (one-sided paired t-test using the Python library SciPy).
To better understand the data, we also used the above-mentioned measure of response vigour to calculate various Spearman rank correlations (using the Python library SciPy). The first evaluated whether the response vigour in the two blocks is positively correlated across participants. The second examined whether the relationship between remaining time and response vigour that was previously found for steps at different moments is also present across participants. For each block, we checked whether the vigour is negatively correlated with the remaining time after the relevant step. We used rank correlations because we expect a monotonic, but nonlinear relationship between vigour and remaining time (Zhang et al. 2018). We used α = 0.05 for statistical significance.
Comments (0)