This study is part of a larger project at the University of Münster, Germany, focusing on cognitive-motor multitasking in older adults (Mack et al. 2022). This sub-study was performed between January 2022 and November 2022. Eligibility criteria and cognitive tests are described in detail elsewhere (Mack et al. 2022). In brief, interested participants were assessed for eligibility through a standardized telephone interview, querying the inclusion and exclusion criteria described below. All participants gave written informed consent before participating in the study and received financial compensation (€15 per test day). Inclusion criteria were: (1) age between 65 and 75 years (minor exceptions are made for couples for ethical reasons: < 65 and > 75 years, n = 1), (2) right-handedness and (3) willingness to participate in the OCTA study. Exclusion criteria were: (4) red-green deficiency or red-green color blindness, (5) perceived health concerns, (6) neurological disease, stroke and/or head/brain surgery. Additionally, participants were screened for visual acuity using the Freiburg Visual Acuity Test version 3.9.0 with a cut-off of 20/50 (Bach 2007). They were also asked about their medication use (Supplementary Table 1). Furthermore, participants were required to obtain medical clearance, including a stress electrocardiogram (ECG), from a physician or cardiologist to perform a cardiorespiratory fitness test (cycling spiroergometry). Blood pressure was monitored throughout the warm up, graded exercise testing and cool down phases (cycling spiroergometry).
Tests of global cognition and executive functions
Global cognition was assessed using the 30-point scale of the Mini-Mental State Examination (Folstein et al. 1975) (30 points = no cognitive impairment). A score < 25 was set as the threshold for mild cognitive impairment (Creavin et al. 2016). The test of the executive functions inhibitory control (‘inhibition’), working memory updating (‘updating’), and shifting were described elsewhere (Mack et al. 2022) and are briefly repeated here. The tests were computerized and conducted on a 24″ screen with a display resolution of 1920 × 1080 pixel and a screen distance of about 65 cm. Each test took about 10 min with up to three practice trials of about 1 to 2 min each. Feedback was provided after practice trials, but not after registered trials. For the assessments, visual (shifting) or visuo-spatial stimuli (inhibition, updating) were used, programmed in E-Prime 2.0 (Psychology Software Tools, Pittsburgh, PA, USA). The stimuli were presented in six blocks with breaks of 5 s between blocks (20 s after block 3). The maximum response window was 2000 ms. After a response or after a maximum of 2000 ms, a central fixation cross (0.3 cm width and height) was presented for a variable response-stimulus interval between 800 and 1200 ms. Participants responded by pressing the “X” or “M” key on a German keyboard with their left or right index finger, respectively. They were instructed to respond as fast and as accurately as possible. Reaction times and correctness of responses were recorded.
Inhibition was assessed using a modified Simon test. A black fixation cross was presented continuously on a white screen. At the beginning of a trial (n = 32 per block, 192 in total) an arrow (2 cm length, 0.5 cm height) pointing to the left or right was displayed for 500 ms either on the left or right side of the fixation cross (distance between arrows and fixation cross was 3.1 cm). For one half of the stimuli the direction and position of the arrow was congruent (congruent trials; e.g., leftward pointing arrow on the left side), while for the other half of the stimuli, direction and position was incongruent (incongruent trials; e.g., leftward pointing arrow on the right side, n = 96). Participants were instructed to press the left key “X” for leftward pointing arrows and the right key “M” for rightward pointing arrows, regardless of the stimulus position relative to the fixation cross.
Updating was assessed using the 2-back condition of a visuo-spatial working memory N-back test. A black 4 × 4 grid (18.4 cm width and height) was presented continuously. Dots (n = 19 per block, 2.6 cm diameter, 114 in total) were presented sequentially in the center of different grid cells (4.6 cm width and height) for 500 ms. Participants were instructed to memorize the position of the dots and to press the right key “M” when the position of the current dot was identical to the position of the second-to-last dot (target). They had to press the left key “X” when the current dot appeared at a different position as the second-to-last dot (non-target). In total, 30 targets and 72 non-targets were presented (plus 2 “starting trials” per block).
Shifting was assessed using a modified visual switching test. Geometrical shapes (n = 17 per block, 102 in total) were presented sequentially for 1500 ms in the center of the screen. The geometrical shapes were either quadratic or circular and either large (5.2 cm diameter/width and height) or small (1.8 cm diameter/width and height). Participants were instructed to indicate either the size of the shape (subtask A) or the form of the shape (subtask B) by pressing either the left key “X” for small or circular shapes or the right key “M” for large or quadratic shapes. In each block subtasks were presented in the following order: AABBAABBAABBAABBA (AA, BB: repetition trials; AB, BA: switch trials). No external cues about subtask order were provided.
OCTA measures
OCTA imaging was performed with the AngioVue OCT and OCTA imaging system (RTVue-XR Avanti optical coherence tomograph, Optovue Inc., Fremont, CA, USA). Only scans with an overall scan quality ≥ 5 and signal-strength-index > 50 were accepted. An active eye-tracking technology was used to reduce motion artefacts (Lauermann et al. 2017). Standardized, the right eye was measured unless ophthalmic conditions (i.e. cataract) reduced insight and aforementioned quality indices could only be achieved by measuring the left eye (n = 6 participants). For angiographic imaging of the macula, 3 mm × 3 mm scans, for imaging of the optic disc, 4.5 mm × 4.5 mm scans were obtained, respectively, and the retinal layers were segmented automatically using the integrated software (Lauermann et al. 2018). The custom boundaries for the superficial vascular complex (SVC) were set between the inner limiting membrane (ILM) and 9 µm above the inner plexiform layer (IPL), for the deep vascular complex (DVC) between 9 µm above the IPL and 9 µm below the outer plexiform layer and for the radial peripapillary capillaries (RPC) between ILM and below nerve fiber layer. The peripapillary region is defined as an annulus with an outer diameter of 4 mm and inner diameter of 2 mm around the optic disc, the parafoveal region as an annulus with an outer diameter of 3 mm and an inner diameter of 1 mm. The en-face images of the optic disc, as well as the OCT images of the macula revealed no pathological abnormalities of the optic nerve or macula. The intraocular pressure was not measured prior to the OCTA assessments – however, patients were questioned regarding previous ophthalmological diagnoses to exclude glaucoma and other relevant ocular pathologies.
Since hematocrit level has been reported to affect OCTA measurement, venous blood samples were drawn (K3-EDTA) with a time interval of no more than 7 days from OCTA analyses. Analysis was performed in the accredited laboratory of the University Hospital Münster, Germany, using standard procedures.
Various OCTA parameters can be extracted from the software as mentioned elsewhere (Zinn et al. 2020; Alten et al. 2021). For this study, OCTA parameters were selected according to the principle that the VD in the examined area should be as uniform and undisturbed as possible in order to have a comparable situation to the microcirculation in the brain. Therefore, the areas of the papilla (optic disc) and the fovea were excluded. The selected areas were the parafoveal area between a 1 mm and 3 mm diameter around the fovea with differentiation between SVC and DVC as well as the peripapillary capillaries with recess of the optic nerve head.
Data analysis
For all trials with correct responses, a measurement of speed (RT of correct responses), accuracy (percentage of correct responses) and variability (coefficient of variation, CV across reaction times of correct trials) was extracted for each executive function tested. The selected parameters and their definitions are given in Table 1. For each test, outliers of individual performance were eliminated before the results were calculated by first removing trials with reaction times < 80 ms or > 1300 ms for the individual participant and then using a two-sided 1 ‰ criterion to exclude values that were more than 3.29 times the standard deviation from the mean value of the participant. Accuracy was quantified as the percentage of correct responses across all presented stimuli and speed as the mean reaction time of correct responses. CV, defined as the ratio of the standard deviation (SD) to the mean, was calculated by dividing the SD of RTs by the average RT of the participant. To verify participants’ understanding of the tasks, we examined whether the mean accuracy across all trials (Simon task: congruent and incongruent trials, n-back: target and non-target trials; visual switching: repetition trials and switch trials) for participants exceeded 55%. Next, we calculate cost values by subtracting the RT/CV/accuracy of the incongruent trials from the congruent trials (Simon task), the RT/CV/accuracy of the non-target trials from the target trials (n-back task), and the RT/CV/accuracy of the switch trials from the non-switch trials.
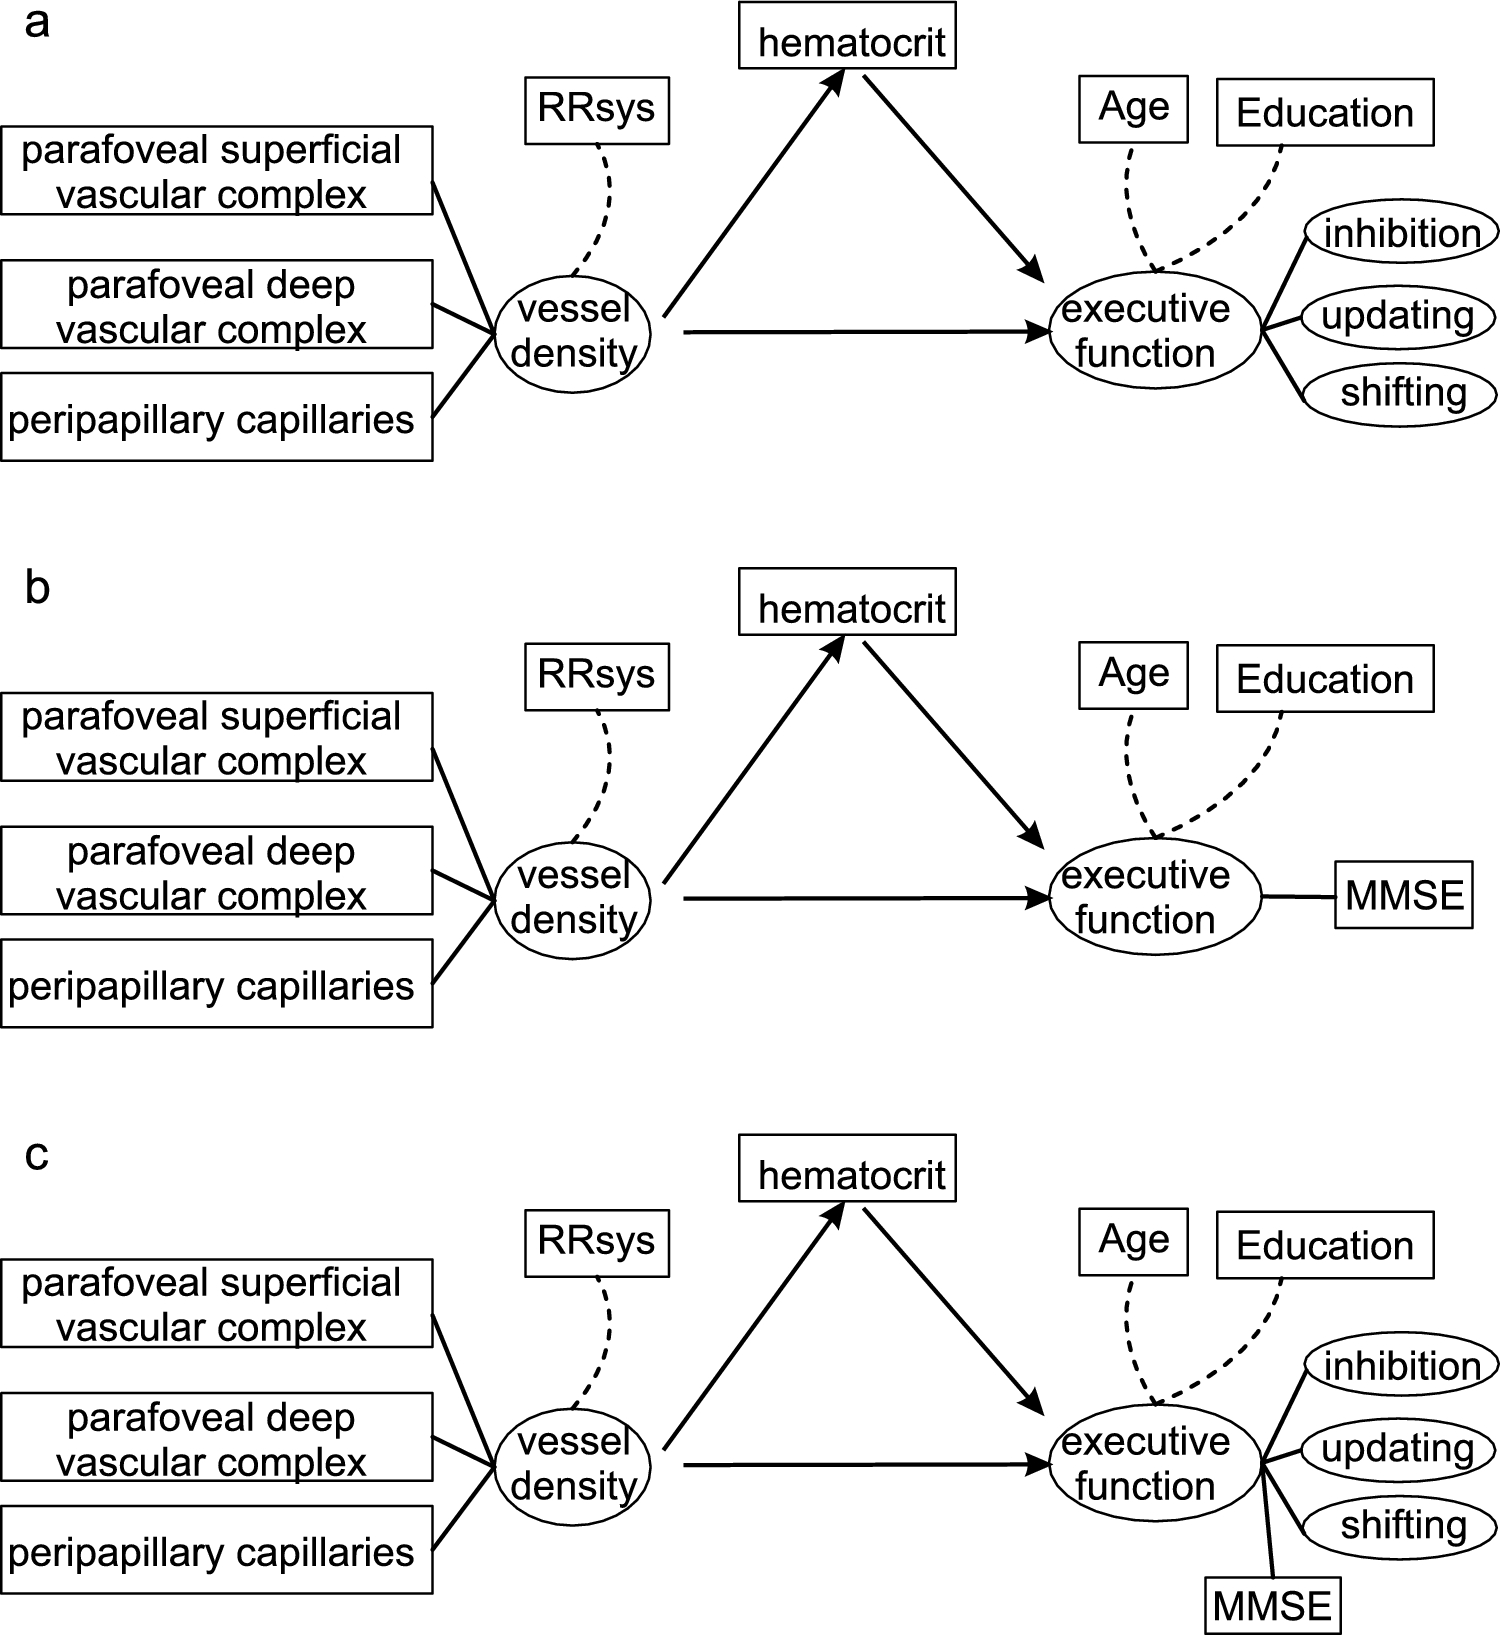
Table 1 Selected parameters of the cognitive tests (Simon inhibition task, n-back working memory (WM) task, and visual switching task) to assess the executive functions inhibition, updating and shiftingAll statistical analysis were performed using the R 4.3.2 base package (Team 2018, 2024). For mediation analysis, structural equation modeling (SEM) was done using the R-package lavaan 0.6–15 (Rosseel 2012). To meet minimum requirements for an SEM, the respective parameters either had to be approximately normally distributed or were adjusted accordingly through suitable transformation (e.g., logarithmic transformation). Subsequently, individual values that deviated by more than 2.17 SDs from the group mean were identified as outliers and excluded from the SEM using a two-sided 1.5% criterion. The three selected OCTA parameters were used as parameters for the latent variable VD. It is possible that elevated blood pressure may have affected the OCTA measurement. In addition, some participants were taking antihypertensive medications (see Supplement Table 1 for list of medications). Therefore, we selected systolic blood pressure (RRsys) measured under similar conditions in all participants as a covariate for vessel density (VD). We chose the minimum RRsys value recorded during the warm-up period at 0W power output because, based on previous experience, participants tend to have their lowest values during this period. Earlier blood pressure readings tend to be high due to participants’ tension about the unfamiliar laboratory environment. For the first model (Model 1), the latent variable EF was formed hierarchically with two levels. The top level was formed by the executive functions inhibition, updating, and shifting as latent variables. On the second level, each individuals’ executive function formed its own latent variable, which was based on three selected parameters (Table 1). Age and years of education were included as covariates in the model and hematocrit level as a mediator of the relationship between VD and executive functions. As alternative models, SEMs were examined by replacing the latent variable EF with the MMSE score (Model 2), as well as a model in which the latent variable cognition consisted of the MMSE score combined with the latent variables inhibition, updating, and shifting. Model optimization and evaluation followed standard procedures of confirmatory factor analysis (Schermelleh-Engel et al. 2003; Gäde et al. 2020). The occurrence of negative variance estimates (so-called Heywood cases) was considered a convergence problem or an incorrect solution of the model. In these cases, further parameters were eliminated until a stable model was determined (Schermelleh-Engel et al. 2003). For comparing the models robust estimates of the χ2 value, the Comparative Fit Index (CFI), and the Tucker-Lewis Index (TLI), as well as the sample-size adjusted Bayesian Information Criterion (SABIC) were used (Schermelleh-Engel et al. 2003; Gäde et al. 2020).


Comments (0)