Study participants
This was a prospective cohort study using the CKB data. The baseline survey of CKB was conducted between 2004 and 2008, recruiting over 0.5 million participants aged 30 to 79 from the general population across five cities and five rural areas in China. The program was designed to assess the lifestyle, environmental, and genetic risk factors, by combining questionnaires, physiological measurements, and blood and biological samples, with the goal of identifying key determinants of health outcomes. A total of 18,261 participants with available biomarkers were eligible for this study. The CKB study was approved by the Ethical Review Committee of the Chinese Center for Disease Control and Prevention (Beijing, China) and the Oxford Tropical Research Ethics Committee at the University of Oxford (Oxford, UK). The current analysis was approved by the Ethical Review Committee of School of Public Health, Zhejiang University School of Medicine. Written informed consent was provided by all participants. Details have been presented previously [18, 19].
Morbidity and mortality
The disease status was self-reported by participants, and the death records were collected from the local Disease Surveillance Point death registries [19]. The cause of death was primarily obtained from official death certificates and medical records [20]. In this study, the mortality data included final vital status, underlying leading cause of death, and follow-up time. For survivors, the follow-up time extended until the end of the mortality follow-up period (December 31, 2016), while for deceased individuals, it was calculated from the date of interview to the date of death or loss to follow-up. The causes of death were classified using the 10th International Classification of Diseases (ICD-10): malignant neoplasms (C00-C97), endocrine, nutritional and metabolic diseases (E00-E90), including diabetes mellitus (E10-E14), mental and behavioral disorders (F00-F99), disease of the circulatory system (I00-I99), including hypertension (I10-I15), ischemic heart diseases (I20-I25), and cerebrovascular diseases (I60-I69), disease of the respiratory system (J00-J99), including chronic lower respiratory diseases (J40-J47), and disease of the genitourinary system (N00-N99).
Biological age construction and validation
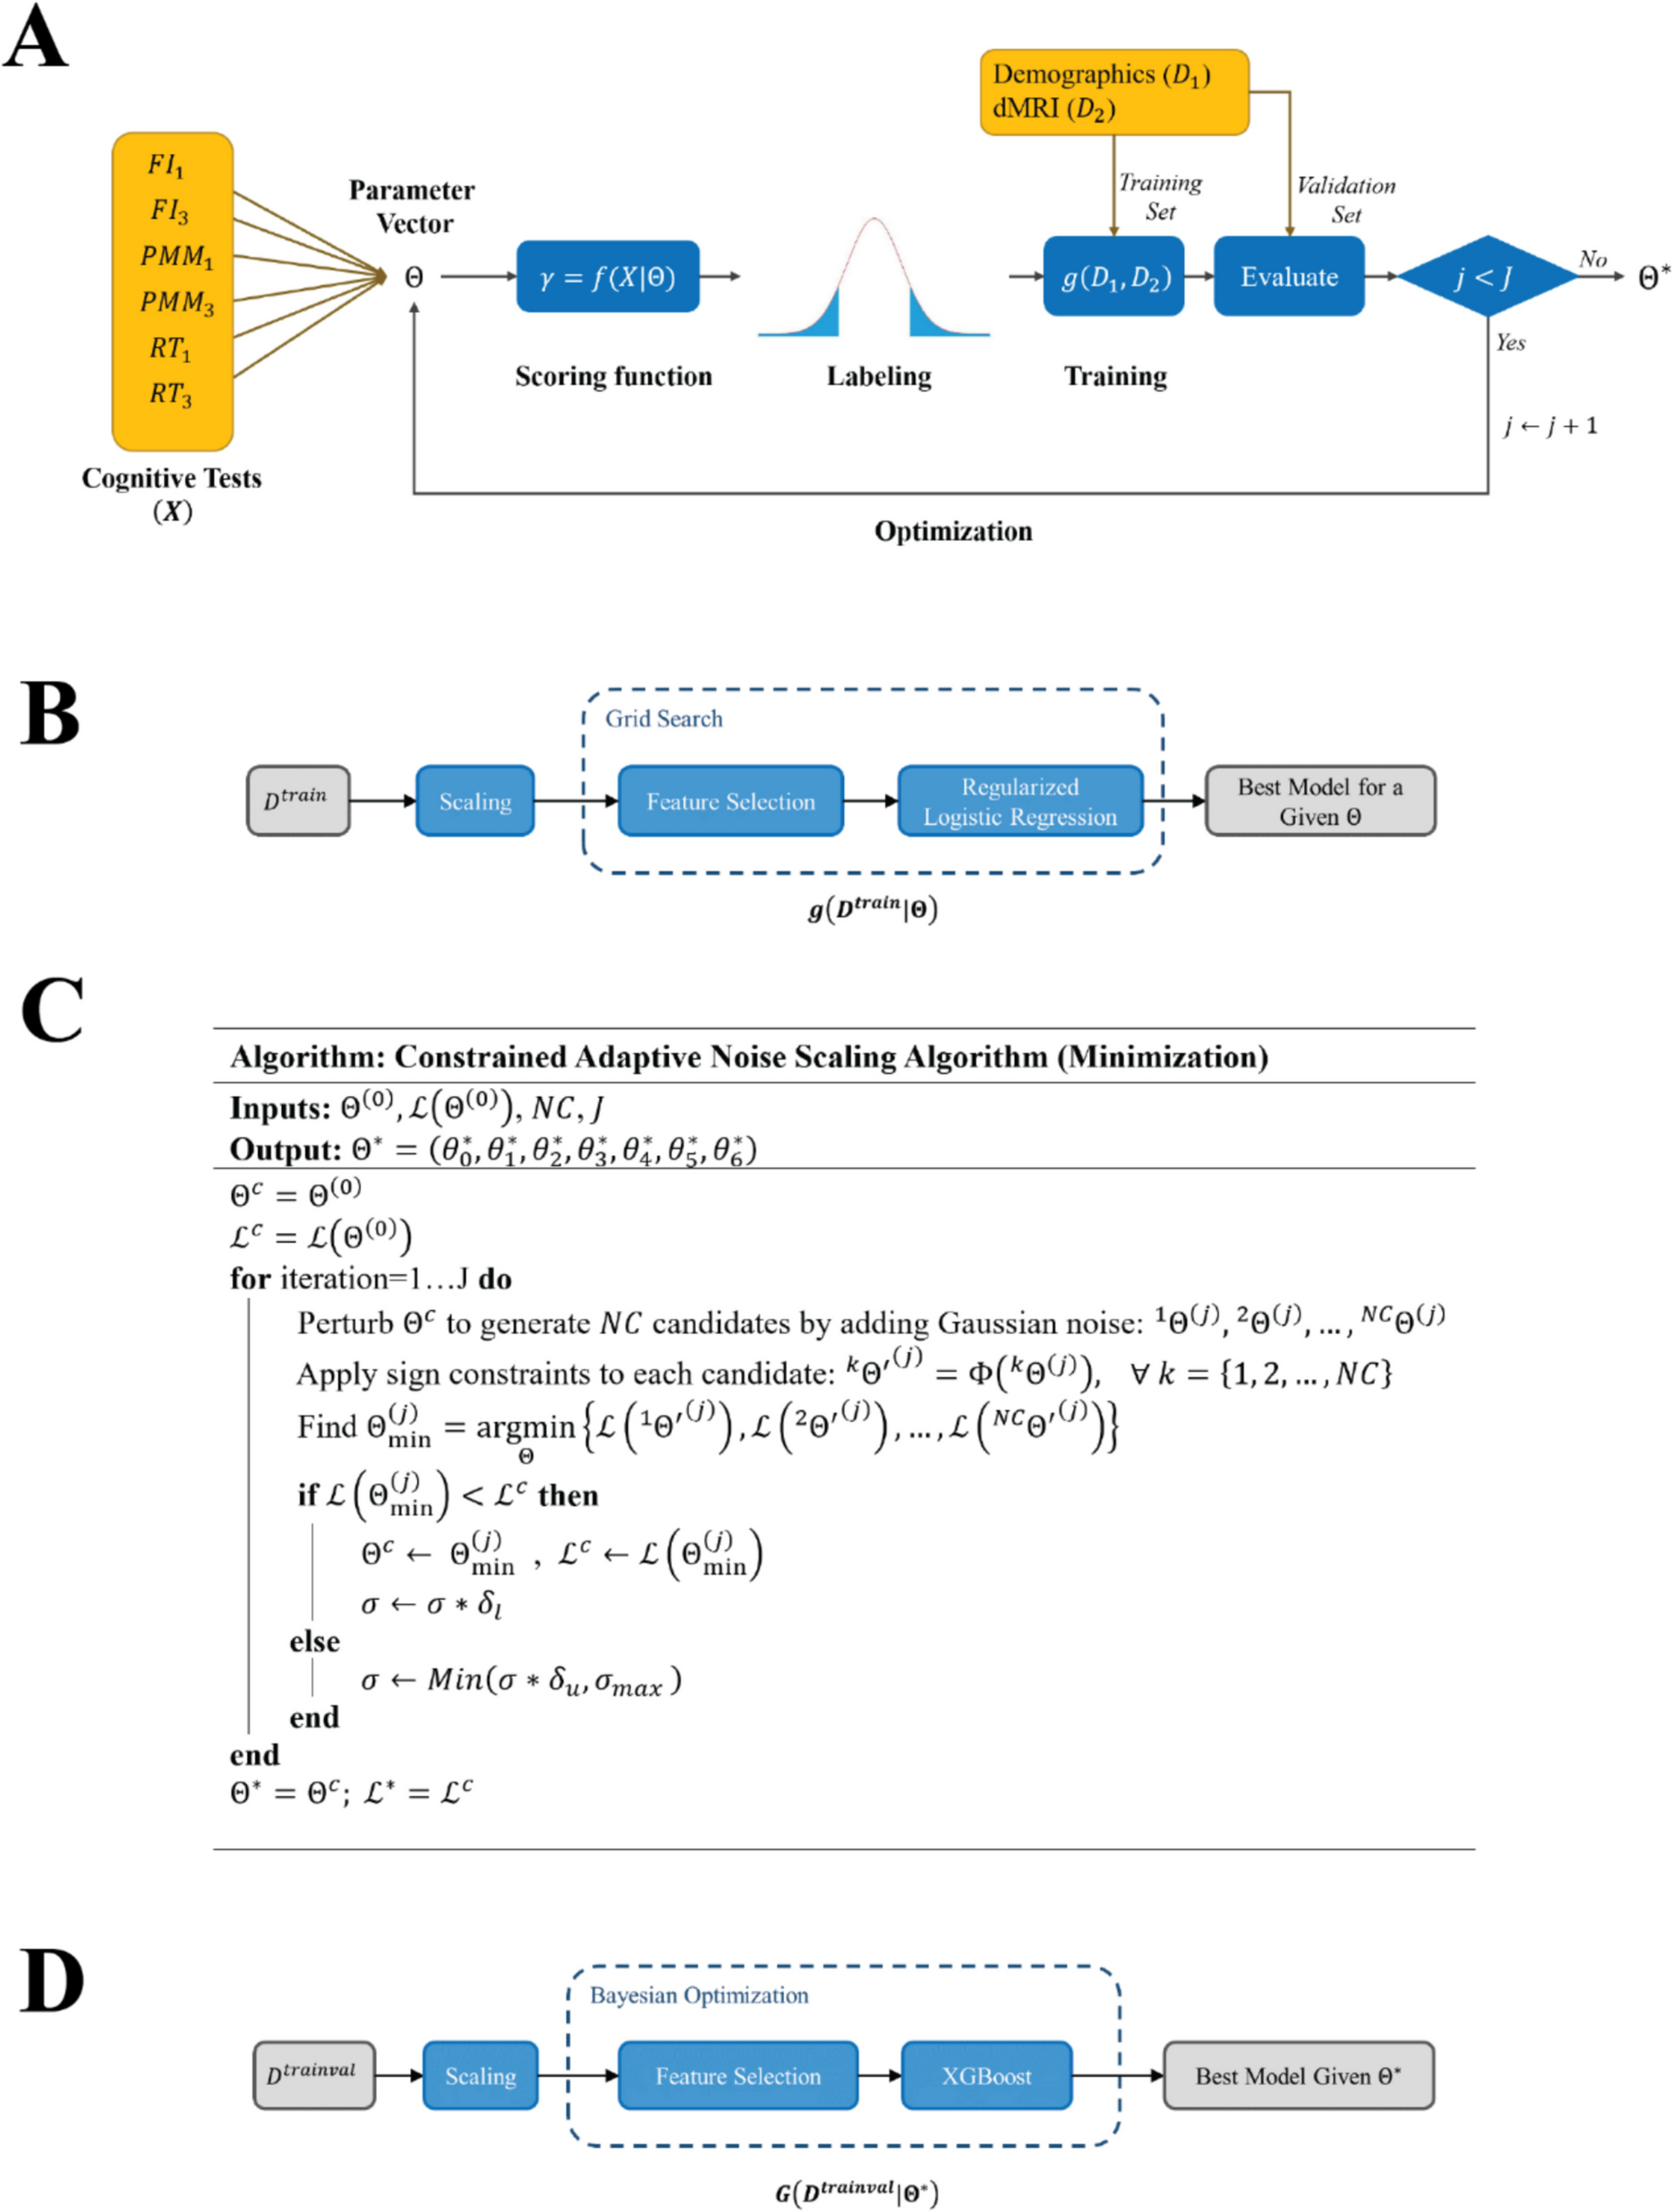
Based on previous literatures and the availability of samples, we selected 18 biochemical, 7 physical and 26 questionnaire indicators to construct a Deep Neural Network (DNN) model for the prediction of biological age (Table. S1). The result of Pearson rank correlation coefficients is shown in Fig. S1. The model architecture consists of 5 hidden layers with 256, 128, 64, 10, and 1 neuron, respectively. Each layer employs the ReLU activation function, followed by a Dropout rate of 30% for regularization in the first four layers. The final output layer consists of a single neuron for continuous age prediction. The network was trained using the Adam optimizer, with a learning rate of 0.01, a batch size of 1024, and Mean Squared Error (MSE) as the loss function. Training was performed for 1000 epochs, using an 80% random extraction of the dataset (N = 14,609), with a 20% internal validation set to mitigate overfitting. To enhance model robustness, we conducted 10 independent test runs, averaging the results for evaluation. The model’s performance was assessed on the test set (remaining 20% of the dataset, N = 3,652) using Pearson correlation coefficients and MAE between chronological age and biological age as evaluation metrics.
In addition, to quantify the aging rate of different participants, we regressed their biological age on chronological age and calculated the residual value, which was defined as “△age”. If △age is greater than 0, it indicates accelerated aging for the individual (assign to the “accl” group), if △age is less than 0, it indicates non-accelerating aging (assign to the “normal” group).
Influencing factors of biological age
As described in previous studies [17, 21], five influencing factors were primarily considered, including BMI, smoking, drinking, physical activity, and sleep.
BMI was calculated by dividing a person’s weight in kilograms by the square of their height in meters, and was classified into four groups, with BMI < 18.5 kg/m2 classified as underweight, 18.5–25.0 kg/m2 as normal, 25.0–30.0 kg/m2 as overweight, ≥ 30 kg/m2 as obesity.
Smoking status was classified into three categories, including never, former, and current. For drinking, we calculated the weekly pure alcohol intake based on the type and frequency of alcohol consumption (measured in g/week). The average alcohol content (v/v) for different beverages was as follows: beer (4%), rice wine (10%), wine (12%), spirits with ≤ 50% alcohol (40%), and spirits with ≥ 50% alcohol (60%). We classified alcohol consumption into four categories: never drinking, former drinking (more than 12 months ago), light drinking (< 210 g of pure alcohol per week for males or < 105 g per week for females), and heavy drinking (≥ 210 g of pure alcohol per week for males or ≥ 105 g per week for females) [17].
To explore the effect of physical activity, individuals were divided into three groups (low, moderate, high) based on metabolic equivalent of task (MET) levels, using tertiles and stratified by gender [22]. The MET ranges were < 9.9 MET-hours/day, 9.9–23.0 MET-hours/day, and > 23.0 MET-hours/day for males, and < 10.7 MET-hours/day, 10.7–19.2 MET-hours/day, and > 19.2 MET-hours/day for females.
Sleep quality was assessed by constructing a sleep score based on several sleep-related indicators, including sleep duration, delayed or fitful sleep, sleep affecting daily life, sleep needing medicine, waking up too early, and daytime naps [23]. First, the reference values were set as follows: “7 ~ 8 hours” for sleep duration, “No” for delayed or fitful sleep, sleep affecting daily life, sleep needing medicine, waking up too early, and daytime naps. Then, these indicators, along with chronological age, were incorporated into a Cox model with mortality as the outcome to obtain the coefficients for each sleep indicator. The standardized coefficients were then rounded to the nearest integer, and the final sleep score was calculated by summing these values. Detailed scoring criteria are provided in Table. S2.
Covariates
Information on participants’ socio-demographic characteristics included age, gender, education attainment, marital status, and household income. Education attainment was categorized into primary school or lower, middle school, and high school or higher. Marital status included with spouse, widowed/divorced, and never married. Household income was divided into four categories, namely less than 10,000 Chinese yuan (CNY)/year, 10,000–19,999 CNY/year, 20,000–34,999 CNY/year, and 35,000 CNY/year or more.
Statistical analysis
We presented the baseline characteristics of the participants as mean (standard deviation [SD]) for continuous variables and as count (percentage) for categorical variables. Multiple imputations using random forests were applied to impute missing values. Receiver Operating Characteristic (ROC) curves based on multivariable Cox regressions were used to compare the predictive power of chronological age and biological age for all-cause mortality.
We employed multivariable Cox regressions, which satisfied the proportional hazards assumption, to assess the risk for both all-cause and cause-specific mortality, and reported the hazard ratio (HR) for each additional year of △age. Our analysis included three models, the initial model (model 1) was unadjusted, model 2 was adjusted for age and gender, and model 3 was adjusted for age, gender, education attainment, marital status, household income, BMI, smoking, drinking, physical activity, and sleep. Additionally, we explored the relationship between △age and morbidity (diabetes, hypertension, rheumatic heart disease) at baseline using multiple logistic regression, adjusting for the same covariates. We calculated the risk of disease associated with each additional year of △age and reported the odds ratio (OR). Furthermore, a mutually adjusted multiple linear regression was conducted to analyze the associations between behavioral factors, covariates and △age.
The DNN model was built using Pytorch (version 2.1.1) in Python (version 3.11.5). Data cleaning and analysis were carried out using R software (version 4.3.2). The Cox model was applied using the “survival” package. A two-tailed P-value less than 0.05 was considered statistically significant.


Comments (0)