
Remember me
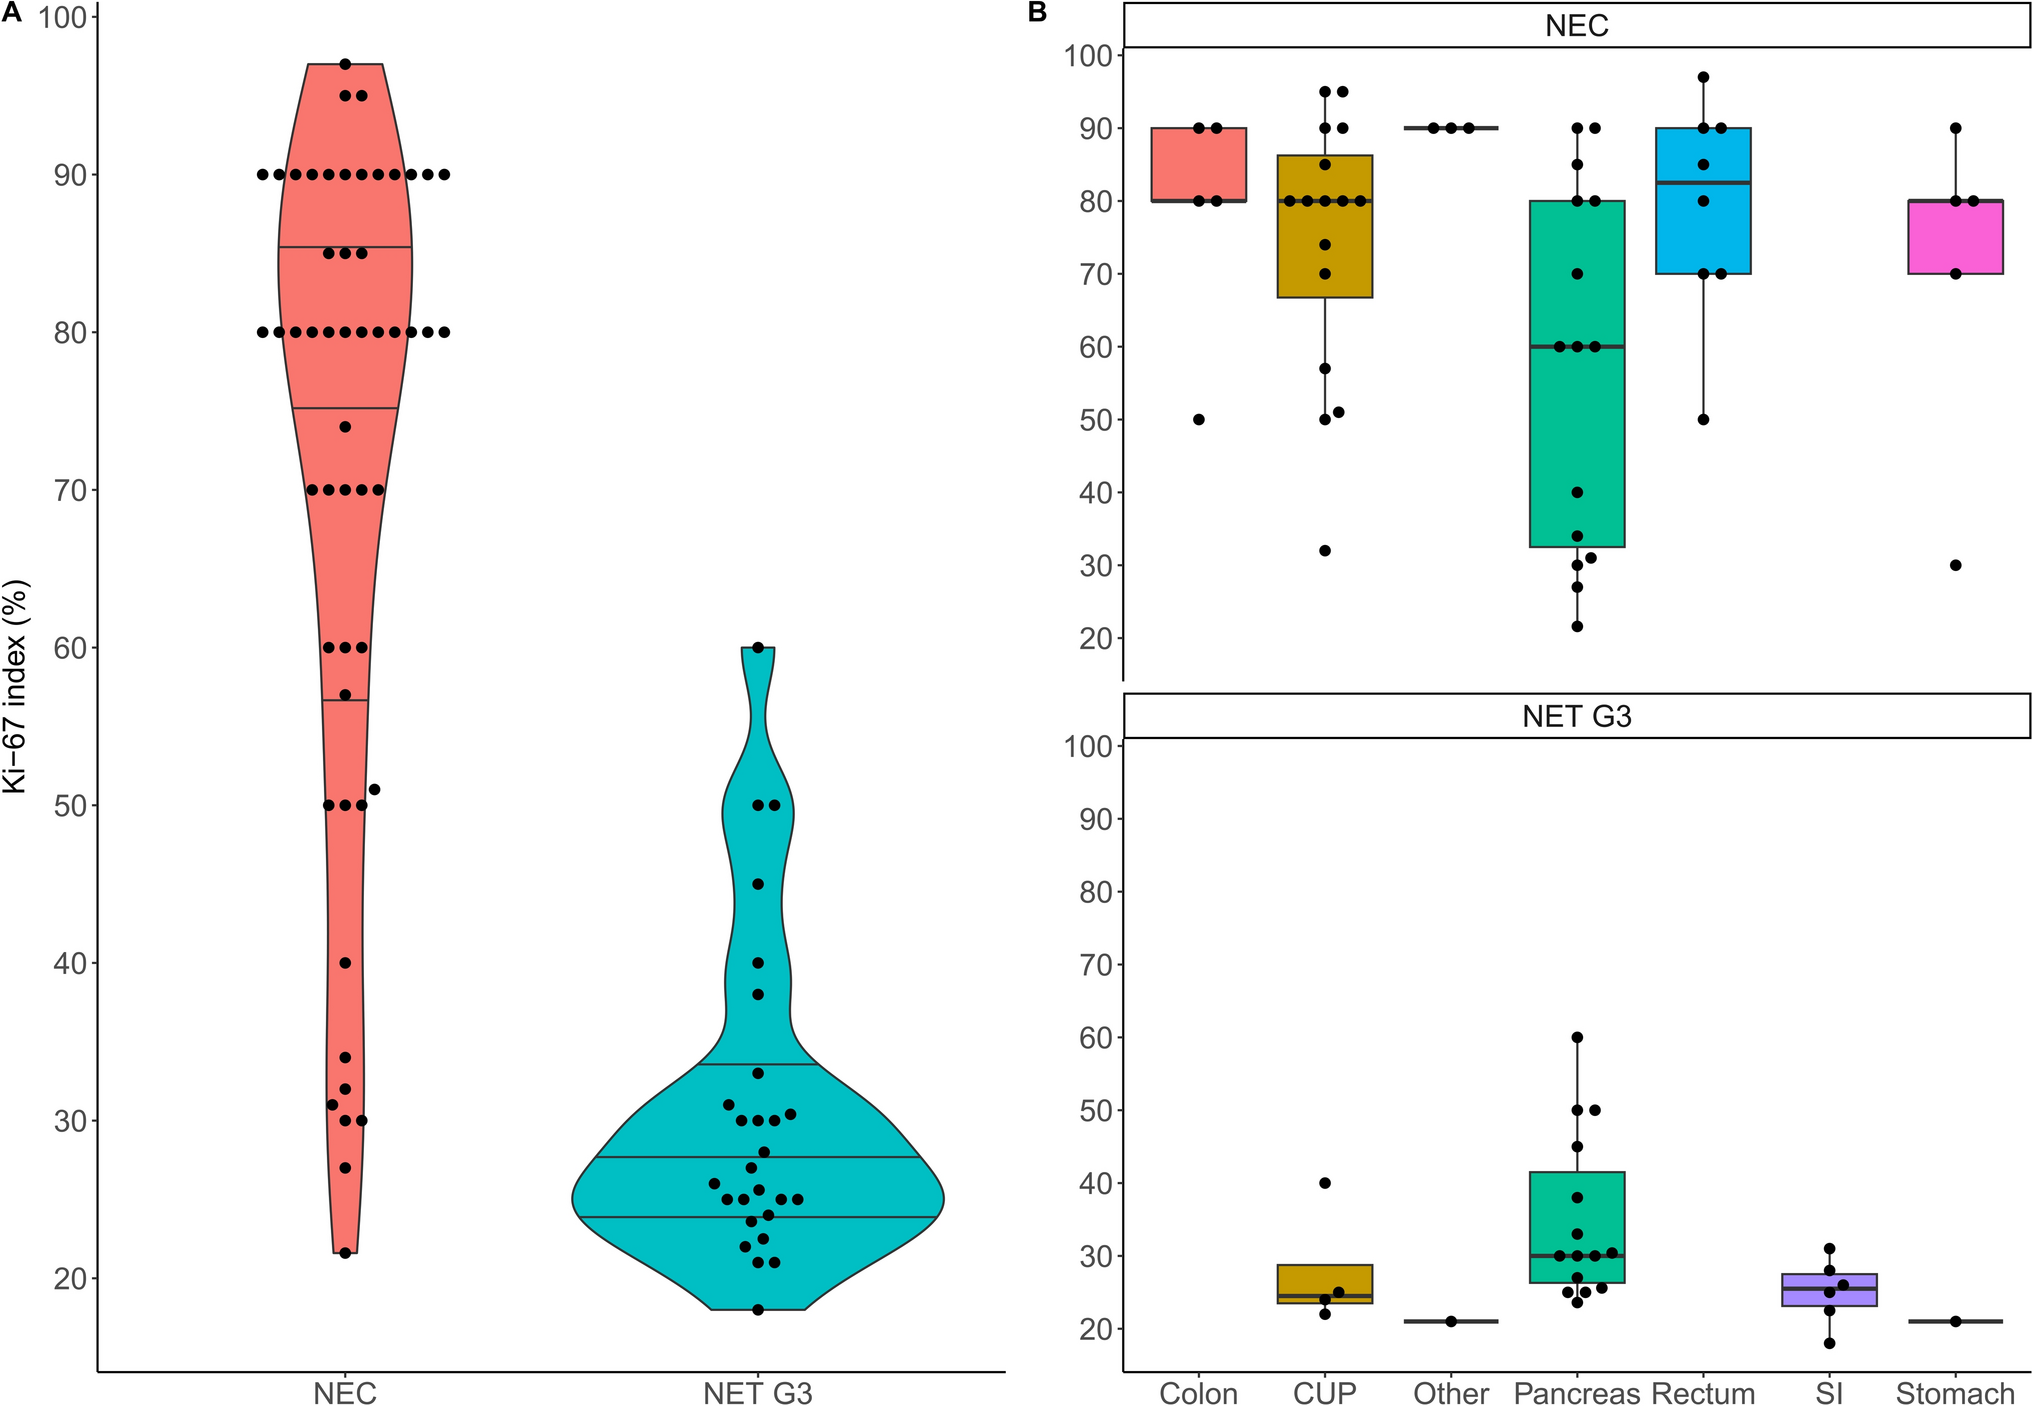


Out of 101 extrapulmonary high-grade NEN patients, 80 patients with metastatic disease could be included (pathological reassessment was not possible in seven, six had no metastases, five a MiNEN diagnosis, and basic information was missing in three). Of the included 80 patients, 42 (53%) were male. At diagnosis, the median age was 58 years (range: 25–80 years) and the ECOG performance status good in most patients (ECOG 0 in 88%). Twenty-seven patients (34%) had a diagnosis of NET G3 and 53 (66%) had NEC histology, of which 23 (43xxxx%) and 25 (47%) were of small cell (SCNEC) and large cell (LCNEC) morphology, respectively (not available [NA] for 5 patients). The median Ki-67 index of all patients was 60% (range: 18–97%) but differed significantly (Wilcoxon test: p < 0.001) between NET G3 (27%, range: 18–60%) and NEC (80%, range: 22–97%), with apparent differences between primary tumor sites, see Fig. 1. In total, 40/52 NEC patients (77%) had a high Ki-67 index (> 55%), while this was found in only one NET G3 patient (4%).
Fig. 1
Ki-67 index (%) according to A histological subgroup (violin plot) and B primary tumor localization (box plots). The Ki-67 index was determined in 79/80 patients. One NEC patient had no Ki-67 index available, but a mitotic count of 20/2 mm2. One patient had a Ki-67 index of 18% and was diagnosed with NET G3 due to the high mitotic count (22 mitoses/2 mm2)
Stage IV disease was present at diagnosis in 66/80 patients (83%), 10 (13%) were in stage III, 3 (3.8%) in stage II, and 1 (1.3%) in stage I. All patients developed metastases during the course of the disease, with a median of 3 metastatic sites (mean number was 3.1 in NEC and 2.9 in NET G3), see Table 1. The liver was the most commonly affected organ (n = 68, 85%), followed by metastatic spread to the bone (n = 33, 41%) and lungs (n = 15, 19%). Seven patients had brain metastases (9%). Primary tumor site differed significantly between NET G3 and NEC, with cancer of unknown primary (CUP, n = 16, 30%) and pancreas (n = 15, 28%) being the most frequent in NEC and with pancreas (n = 15, 56%) as well as small intestine (n = 6, 22%) being the most common tumor origin in NET G3. Furthermore, 8 patients (10%) had a primary in the rectum, and 6 patients each (7.5%) in the colon and stomach. Four patients had CUP NET G3. One patient had a duodenal NET G3, one duodenal NEC, one esophageal NEC, and one patient gall bladder NEC, see Table 1.
Table 1 General patient characteristicsRegarding the somatostatin receptor 2 (SSTR2) status, 90% of evaluated NET G3 patients were SSTR-positive (n = 19) on immunohistochemistry, whereas only 66% of NEC patients were immunohistochemically positive (n = 19). SSTR imaging by 68 Ga-DOTANOC PET/CT was performed in 23 patients (17 NET G3 and 6 NEC) at the time of diagnosis, with 13 (76%) of NET G3 and 4 (67%) of NEC patients showing a positive imaging result. 18F-FDG-PET was performed in 20 patients, and 5 (71%) of NET G3 and 12 (92%) of NEC patients had FDG-positive lesions. In total, 4 NET G3 patients (15%) exhibited hormone secretion (three had serotonin secretion with diarrhea or flushing and one had insulin hypersecretion), whereas no NEC patients analyzed showed hormonal symptoms (p = 0.012), see Table 1.
Treatment patternsAll but 4 included NEC patients underwent systemic antitumor treatment (two with pending chemotherapy, one died before chemotherapy start, and one refused chemotherapy). Surgical primary tumor resection occurred in one third of patients (n = 26), and 15 NEC patients received radiotherapy. In total, 178 treatments were recorded. Two NEC patients had neoadjuvant cisplatin/etoposide, and 8 therapies were adjuvant (7 cisplatin/etoposide and one octreotide, three of them in NET G3). Of these 10 patients with neo-/adjuvant treatment, two NEC patients did not subsequently receive palliative therapy. In most cases, the time from diagnosis of metastatic disease to first-line palliative treatment initiation was short (median 1.2 months [NEC 0.9 and NET G3 1.3 months] and interquartile range 0.6–2.1 months [NEC 0.5–1.8 and NET G3 0.8–2.5 months]).
In the palliative setting, the first-line treatment in 47/74 patients (64%) was cis-/carboplatin in combination with etoposide, and it was the therapy of choice for most NEC patients (41/47, 87%) and about a quarter of NET G3 patients (6/27, 22%). The most frequently applied regimen in the first line for NET G3 patients was capecitabine/temozolomide (14/27, 52%), and it was also administered to four patients (8.5%) with NEC as an initial palliative therapy (3 had prior adjuvant platin-based chemotherapy). In line with good SSTR expression, SSTR-targeted treatment was given in 6 NET G3 patients initially (3 each had somatostatin analogs [SSA] or PRRT), and these therapies were also employed in later lines (second line: 1 PRRT, 2 SSA; third line: 4 PRRT, 3 SSA; fourth line: 4 PRRT and 2 SSA, fifth line: 1 PRRT), whereas PRRT and SSA were used only in individually selected NEC patients (5 PRRT across all therapy lines, including one PRRT + CAPTEM combination therapy).
There was a significant difference in the number of administered palliative systemic treatments (median 1 for NEC and 3 for NET G3 and mean 1.7 in NEC and 2.9 in NET G3, Wilcoxon test: p = 0.005). Hence, NET G3 patients were much more likely to receive later lines of therapy, i.e., 14/27 NET G3 patients (52%) had a third palliative treatment, while only a third of NEC patients (14/47, 30%) reached such an advanced treatment line, see Fig. 2. Overall, 29/74 patients (39%) had no subsequent systemic antiproliferative treatment following first-line therapy (21 NEC patients and 8 NET G3 patients). Of those patients, 16 died during first-line treatment, 5 were lost to follow-up (last check-up more than 6 months ago), and 8 patients were still on first-line therapy at last visit. In total, 45 second-line treatments, 28 third-line, 11 forth-line, and 6 fifth-line therapies were recorded (one patient had 9 treatments), including 13 rechallenges (5 CAPTEM, 3 platinum/etoposide, and 3 Re-PRRT). With regards to the second line, CAPTEM was administered in 9 patients with NET G3 (following SSA, PRRT, platin/etoposide, and STZ/5-FU, and after CAPTEM as re-induction) as well as in 4 NEC patients upon disease progression following palliative platin/etoposide therapy. Platin/etoposide rechallenge was performed in one NEC patient. Twelve patients had second- or later-line treatment with 5-fluorouracil/leucovorin/oxaliplatin (FOLFOX) and five with 5-fluorouracil/leucovorin/irinotecan (FOLFIRI). For further information on the treatment patterns for this collective, including further chemotherapy regimens, everolimus, and immunotherapy, see Fig. 2.
Fig. 2
Sankey diagram of palliative treatment sequencing of patients with NEC (A) and NET G3 (B). CAPTEM, capecitabine/temozolomide. PRRT, peptide receptor radionuclide therapy. FOLFIRI, 5-fluorouracil/leucovorin/irinotecan. FOLFOX, 5-fluorouracil/leucovorin/oxaliplatin. STZ/5-FU, streptozotocin/5-fluorouracil. SSA, somatostatin analogs. Other administered therapies include FOLFOX + bevacizumab, STZ-doxorubicin, topotecan, sunitinib, ACO (adriamycin/cyclophosphamide/vincristine), capecitabine mono, EPICO (epirubicin, cyclophosphamide and vincristine), doxorubicin/5-FU, irinotecan mono, XELIRI (capecitabine/irinotecan), and cisplatin/temozolomide. Immunotherapies in use were nivolumab, pembrolizumab, and spartalizumab. One PRRT was administered in combination with CAPTEM
Clinical outcomesThe progression-free survival following first-line palliative treatment was 16.1 months in 27 NET G3 (95% CI 7.6–28.2 months) and 6.1 months (95% CI 5.3–7.6 months) in 47 NEC (p < 0.001), with no difference (p = 0.5 and p > 0.9 in the log-rank tests, respectively) between SCNEC and LCNEC (median 6.1 versus 4.8 months) and different primary tumor localizations (median for CUP 7.6, gastrointestinal 6.1, and pancreatic 6.2 months). There was a significant difference based on high versus low Ki-67 index (median PFS of 6.0 months versus 13.0 months, p < 0.001). The median OS following first-line palliative therapy was 18.7 months (95% CI 13.2–24.7 months), with a statistically significant difference (p < 0.001) between NET G3 (median OS of 43.9 months, 95% CI 24.7–NA months) and NEC (12.7 months, 95% CI 8.5–16.4 months) and between high (12.7 months, 95% CI 7.9–17.8 months) and low Ki-67 index (39.0 months, 95% CI 20.4–88.6 months). Regarding SSTR imaging in NET G3, there was a difference in PFS and OS (both p < 0.001) between SSTR-positive and SSTR-negative patients (n = 13 versus n = 4, median PFS 22.6 versus 3.1 months, and median OS 68.1 versus 19.6 months).
The median PFS with first-line CAPTEM in NET G3 was 16.9 months (95% CI 9.2–NA months) and the PFS with first-line platin/etoposide in NEC 6.1 months (95% CI 5.6–7.6 months), see Fig. 3A. The median OS from treatment start was 37.8 months (95% CI 20.4–NA months) for the former and 12.7 months (95% CI 8.5–17.8 months) for the latter, see Fig. 3B. There was no difference (p = 0.8) between cisplatin/etoposide (n = 32) and carboplatin/etoposide (n = 9), with a median PFS of 6.1 and 6.3 months, respectively. The overall response rate (ORR) with platin/etoposide in NEC was 56% (1/39 complete remission [CR], 21 partial remissions [PR], 8 stable disease [SD], and 9 progressive as best response, excluding 1 pending and one missing). By comparison, 6/13 NET G3 patients on CAPTEM had a partial remission (46%), 5 SD, and 2 only progressive disease (one missing). Most NEC patients (n = 14/39, 36%) had 6 cycles of platin/etoposide, with 7 patients given 8 cycles and 3 cycles applied in 6 patients (range: 1–9 cycles, 2 NA). There was no target number of CAPTEM cycles in NET G3 (median: 8.5, range: 2–36 cycles).
Fig. 3
Kaplan–Meier analysis of PFS (A) and OS (B) from first-line palliative treatment start for CAPTEM in NET G3 and platin/etoposide in NEC as well as Kaplan–Meier analysis of second-line PFS for NEC (C) and NET G3 (D)
Factors associated with a worse first-line treatment PFS in univariate Cox regression analysis were male sex (HR 2.02), NEC histology (HR 3.31), high Ki-67 index > 55% (HR 2.94), ECOG performance status of 1 or worse (HR 2.70), and treatment with platin/etoposide (HR 2.98), while history of primary tumor resection (HR 0.42) and positive SSTR imaging (HR 0.21) were associated with better progression-free survival. In the multivariable analysis, male sex (HR 1.98) and surgery (HR 0.47) were independent prognostic factors for PFS. Regarding OS from first-line treatment start, NEC histology (HR 4.23), high Ki-67 index (HR 3.81), surgery (HR 0.50), ECOG ≥ 1 (HR 11.5), and positive SSTR imaging (HR 0.11) were significant prognosticators in univariate analysis, while NEC histology (HR 2.95) and ECOG ≥ 1 (HR 11.5) remained statistically significant in multivariable analysis, see Table 2.
Table 2 Cox regression analysis for PFS / OS following first-line treatmentConsidering the limited sample size, progression-free survival intervals achieved with second-line treatments were short in NEC, with 2.8, 2.6, and 2.6 months for FOLFIRI, FOLFOX, and other treatments (including platin/etoposide and immunotherapy), respectively, whereas the 4 NEC patients on CAPTEM had a median PFS of 5.4 months, see Fig. 3C. In NET G3, CAPTEM (including 4 re-inductions) resulted in a median PFS of 8.2 months (other treatments 11.1 months), see Fig. 3D.
Across all treatment lines, the median PFS for therapies in NEC was in the range of 1.8–6.1 months, while in NET G3, therapies like everolimus, SSA, and PRRT led to median PFS intervals of 8.9, 12.1, and 15.7 months, respectively. Other chemotherapies (STZ/5-FU, platin/etoposide, and FOLFOX) only had median PFS durations of 3.0–3.6 months in NET G3. Table 3 shows the median PFS for different therapies across all treatment lines, but for some treatments only a few administrations were recorded.
Table 3 Progression-free survival across all palliative treatment linesFor the overall cohort, the median overall survival from diagnosis was 21.2 months (95% CI 15.2–39.7 months), and 53/80 (66%) patients had died at the data cut-off date after a median follow-up time of 63.8 months (95% CI 31.2–NA months) according to reverse Kaplan–Meier. In 48 of the deceased patients, the cause of death was attributed to tumor progression and consecutive organ failure, and this information was missing in five patients. There was a significant difference (p < 0.001) in OS between NEC (median of 13.4 months, 95% CI 10.8–19.4 months) and NET G3 (median of 44.7 months, 95% CI 39.2–NA months) as well as between high Ki-67 index (> 55%) with a median of 13.7 (95% CI 10.8–21.2 months) and patients with a Ki-67 proliferation index below that cut-off (median of 39.7 months, 95% CI 21.7–97.2 months). OS curves were similar between SCNEC (n = 23) and LCNEC (n = 25) with 13.7 versus 13.4 months median OS from diagnosis (p = 0.4).
Comments (0)