
Remember me
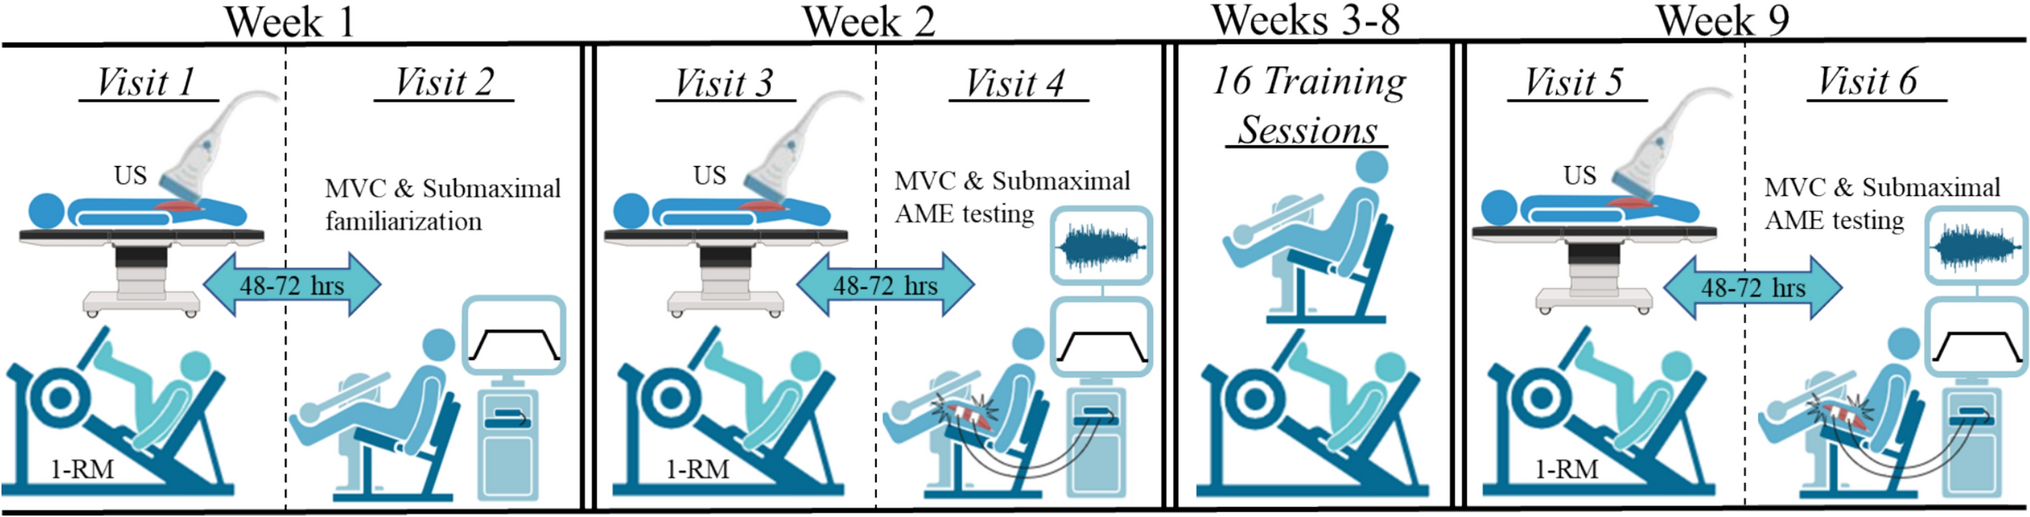
The study used a randomized, cross over, controlled, repeated measures design (Fig. 1). Participants signed an informed consent form after they were fully informed about all the benefits and risks of the study and filled in and signed a medical history questionnaire. Participants were then instructed by a dietitian how to record a 7-days diet recall to ensure that they would not consume to greater extent nutrients that may affect EIMD and fatigue (e.g. antioxidants, amino acids, etc.) and that the energy intake during the trials would be the same. Somatometric assessment and measurement of aerobic capacity (VO2max) were performed. Thereafter, participants randomly performed one of the four different trials: (a) unresisted sprint-training (UST), (b) resisted sprint-training with additional external load of 10% BM (RST10), (c) resisted sprint-training with additional external load of 20% BM (RST20), or (d) control trial (no training—measurements only, CT). The randomization of the trials was made via a random integer set generator (Random.org) available online.
Fig. 1
Blood sampling (to measure CK), and assessment of 10-m and 30-m sprint-time, 10-m and 30-m average speed, DOMS of knee extensors (KE) and flexors (KF) of dominant (DL) and non-dominant (NDL) limb, concentric and eccentric isokinetic peak torque, and countermovement jump (CMJ), were performed pre-, and at 24, 48 and 72 h post-exercise. DOMS was further assessed post-exercise. Blood lactate concentration [La], was determined pre-exercise and four minutes post-exercise to measure the peak post-exercise concentration (Fujitsuka et al. 1982). The participants performed the remaining trials, according to the previous randomization. Between trials, a 7-day wash out period was adapted.
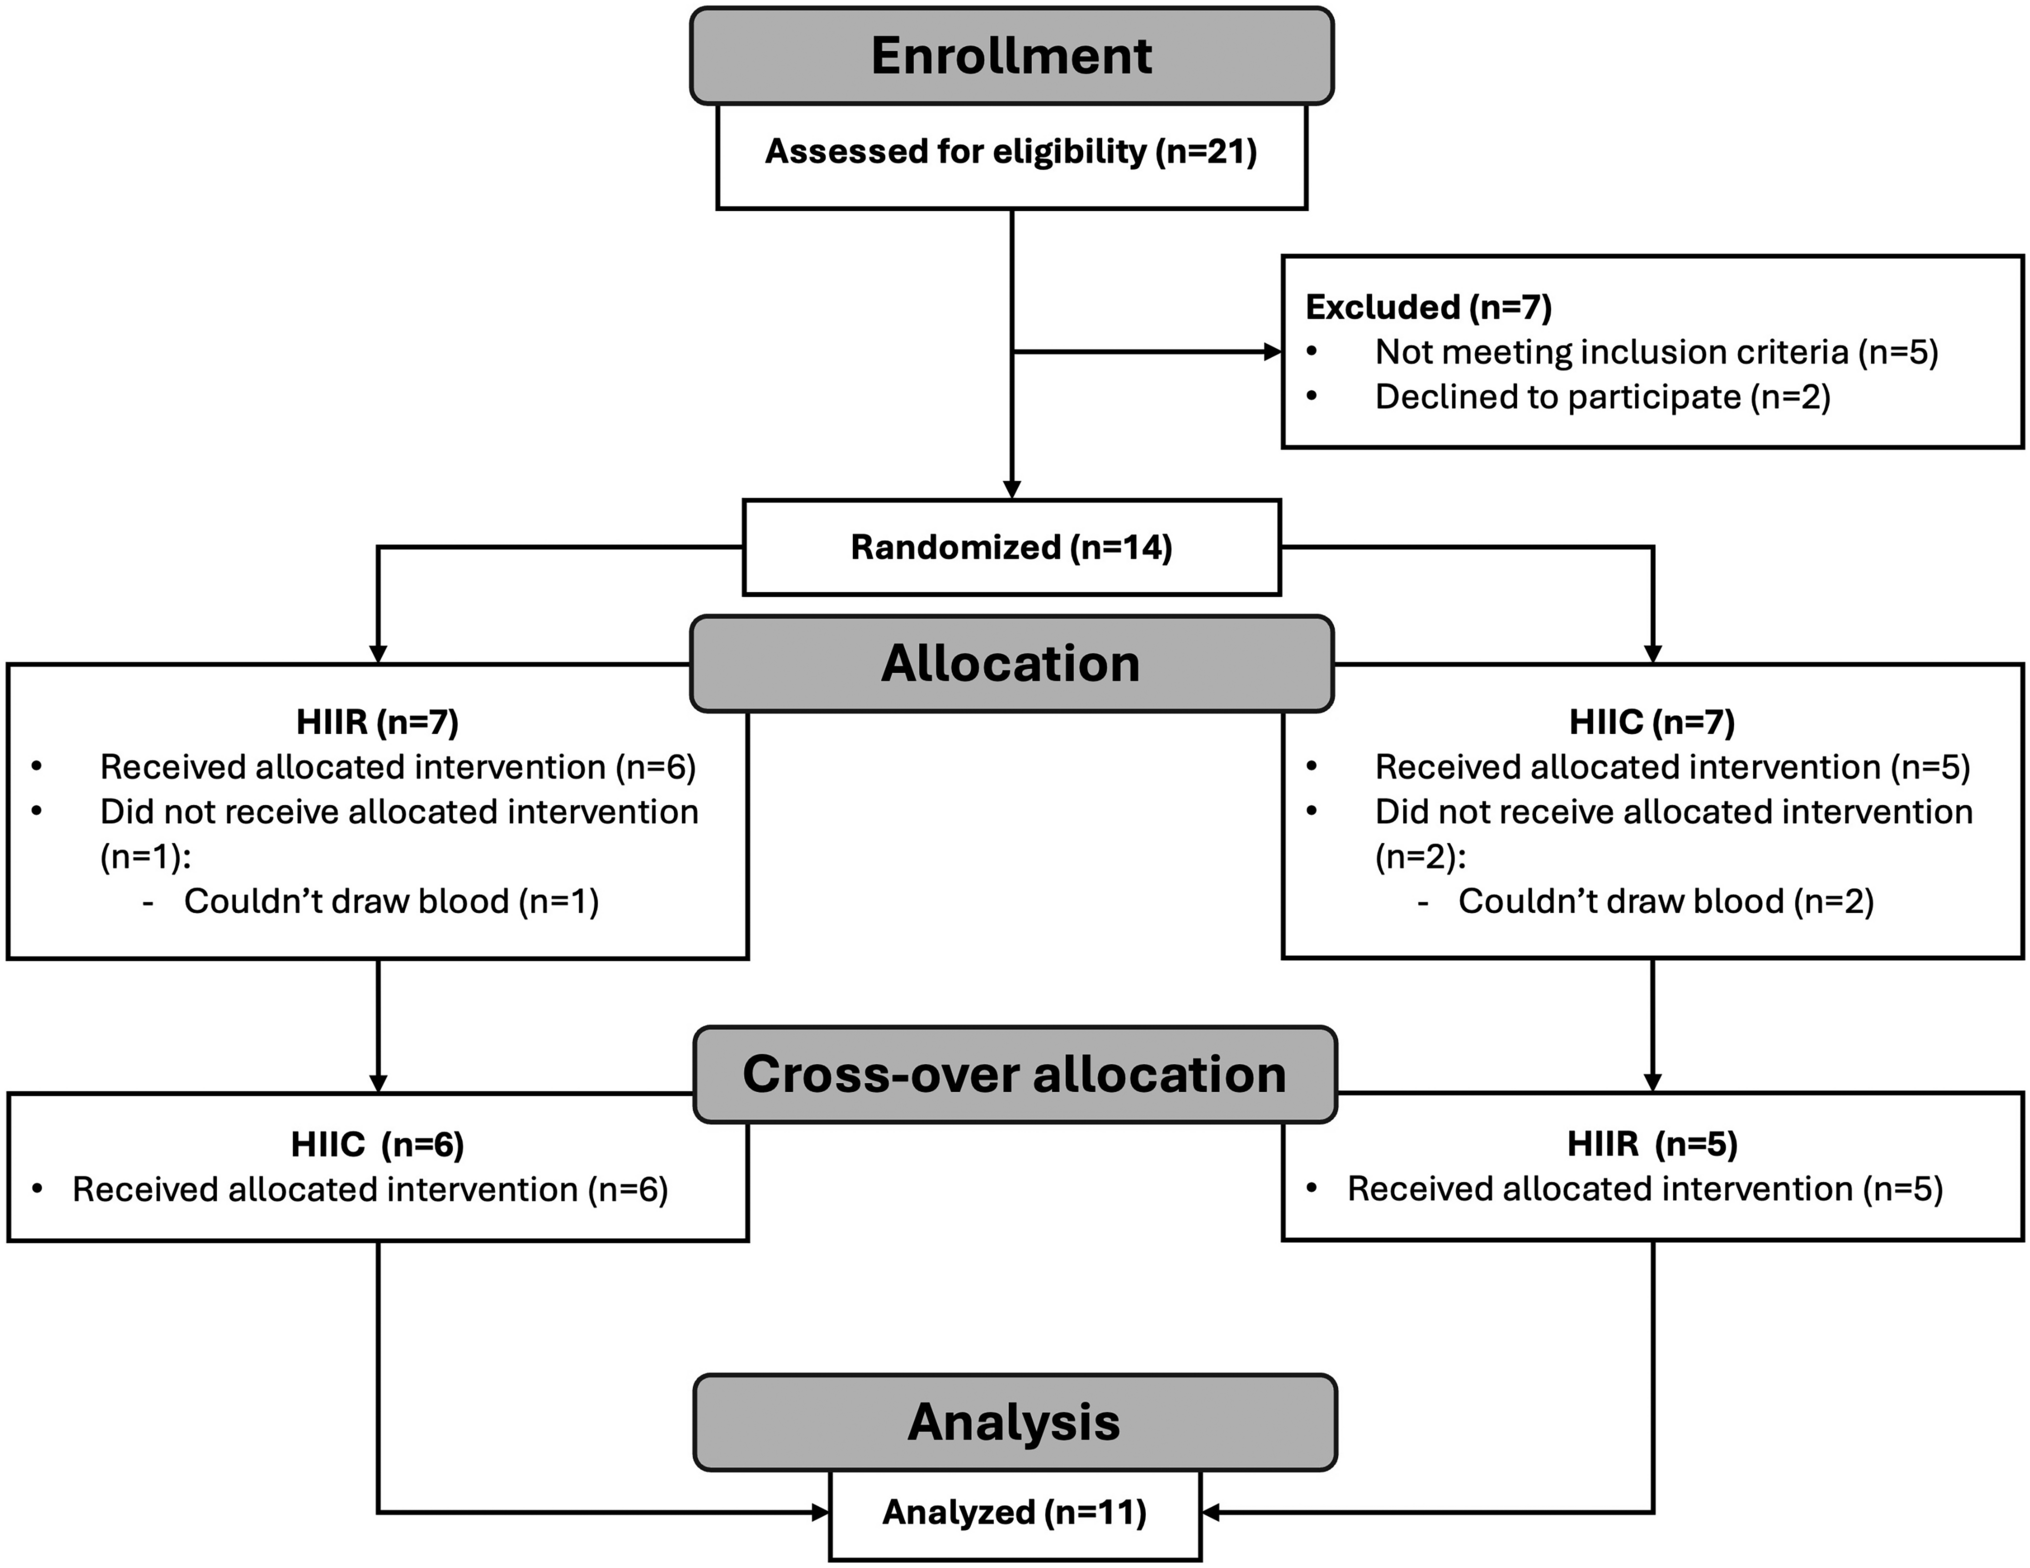
Participants and ethics statementAccording to a preliminary power analysis (a probability error of 0.05 and a statistical power of 80%), a sample size of 8–10 participants/group was considered appropriate to detect statistically meaningful changes between trials. Thus, ten male and female competitive athletes (sprinters, long jumpers, and soccer players) aged 18–26 years participated in the study (Fig. 2). Sprinters and long jumpers were competing in the National championships, while soccer players were competing at first division level. Participants were training 5–6 days/week, at least 2–3 h/day, performing acceleration sprint-training twice per week, and were all familiarized both with unresisted and sled-pulling sprint-training. Participants’ baseline characteristics are shown in Table 1. Volunteers were eligible to participate in the study if: (a) were competitive athletes incorporating sprinting in their regular training, (b) had no musculoskeletal injury during the last 6 months, (c) abstained from use of ergogenic supplements, medications and/or drugs for the last 2 months, (d) abstained from eccentric exercise training for at least 7 days before the study, (e) abstained from alcohol or energy drink consumption before the study. All participants provided written informed consent to participate to the study, following detailed explanation of the benefits and potential risks. Procedures were in accordance with the 1964 Declaration of Helsinki, as revised in 2013 and approval was received from the Ethics Committee of the School of Physical Education and Sport Science of the University of Thessaly (Protocol number: 1715/09-12-2020). The study is registered at ClinicalTrials.gov (Identifier: NCT04766411).
Fig. 2 Table 1 Baseline characteristics of the participantsDietary analysis
The participants recorded their dietary intake (Table 2) for seven days before each trial to ensure that the athletes diet was consistent with the typical suggestions regarding daily macronutrients intake (i.e., 20–30% of total energy for fat, 3–10 g kg−1 BM for carbohydrates, and 1.2–2 g kg−1 BM for protein) for optimal performance during training (Markus et al. 2021; Thomas et al. 2016). Participants received a copy of their dietary record sheets, and were asked to follow the same diet before the other trials so that the energy intake and the consumption of nutrients that may affect EIMD and fatigue (e.g. antioxidants, amino acids, etc.) (Markus et al. 2021) would be the same during the trials to avoid a potential effect of diet on the recovery process. Dietary records were analyzed using the ScienceFit Diet 200A (Science Technologies, Athens, Greece).
Table 2 Participants’ dietary analysisExercise trials and control trialEach training protocol consisted of 2 sets of 3 × 20 m sprints and 1 set of 3 × 30 m sprints. 2-min and 3-min rest periods were applied between repetitions for the 20-m and 30-m sprints, respectively, while a 3-min rest was applied between sets. The specific training protocol was selected according to current practice and sprint training recommendations for acceleration improvement in athletics and team sports (Haugen et al. 2019; Jeffs 2014; Petrakos et al. 2016). The same indoor track and field stadium and sled model (Amila, Vws-1835, India) (for resisted sprinting) were used to avoid variations in the coefficient of friction of the running surface and ultimately an inconsistency in training load (Linthorne and Cooper 2013). All the athletes performed the sprints wearing spikes. Each trial (including the control trial) was performed in a random order in order to minimize the repeated bout effect.
Blood sampling and assaysAfter an overnight fast, blood samples (8 mL) were collected from an antecubital arm vein by venipuncture using a disposable 10-gauge needle with the participants sitting as previously described (Deli et al. 2017a, b). Blood was collected into tubes containing coagulation agent and after remaining at room temperature for 20 min to clot, it was centrifuged (1370g, 10 min, 4 °C) and serum was collected. Serum was stored in multiple aliquots at − 80 °C and thawed only once before the analysis of CK.
Assessment of somatometrics and aerobic capacityBody mass was measured to the nearest 0.05 kg (Beam Balance 710; Seca, Birmingham, United Kingdom) while being lightly dressed and barefoot, and standing height was measured to the nearest 0.1 cm (Stadiometer 208; Seca, Birmingham, United Kingdom) as previously described (Deli et al. 2017a, b). Body mass index was calculated as mass per height squared. Body composition (fat mass, fat-free mass, fat percent, lean body mass, bone mineral density, bone mineral content) was assessed by dual emission X-ray absorptiometry (DXA, GE-Healthcare, Lunar DPX NT, Belgium) as described before (Tzatzakis et al. 2019).
Μaximal oxygen consumption (VO2max) was assessed through an automated online pulmonary gas analyzer (Vmax Encore 29, BEBJO296, Yorba Linda, CA, USA) during a graded exercise protocol on a treadmill (Stex 8025T, Korea). Participants performed a warm-up of ~ 8 min on the treadmill (~ 60% of maximal heart rate) and ~ 5 min of stretching exercises. The initial speed for the testing protocol was 10 km h−1, then increased at 11 km h−1 for the second minute, and increased thereafter by 0.5 km h−1 for every one minute until exhaustion. The O2 and CO2 rates in the exhaled air were measured through a gas analyzer (Vmax Encore 29, BEBJO296, Yorba Linda, CA, USA), which was calibrated before each test using commercially available precision gases (16% O2, 4% CO2, 80% N2), while the heart rate was recorded continuously using a heart rate monitor (Polar Tester S610TM, Electro Oy, Finland). VO2max was determined if at least three of the following criteria were fulfilled: (i) a < 2 mL kg−1 min−1 increase in VO2 with an increase in work rate, (ii) respiratory quotient > 1.10, (iii) heart rate within 10 bpm of the theoretical maximum heart rate (Gellish et al. 2007), (iv) participant’s exhaustion.
Lactate[La] was assessed in capillary blood (~ 0.7 μL) collected through puncturing of the middle finger with a sterile needle, using a hand portable analyzer (Lactate Plus, Nova Biomedical, USA) as previously described (Tzatzakis et al. 2019). Blood lactate was measured four minutes post-exercise to determine the peak post-exercise concentration (Fujitsuka et al. 1982).
Muscle damageDOMS of KE and KF of both limbs was evaluated. The participants performed three repetitions of full-squats, and rated their soreness on a visual analog scale from 1 to 10 (with “no pain” at one end and “extremely sore” at the other) using palpation of the belly and the distal region of relaxed KE and KF. CK was measured using an automated Clinical Chemistry Analyzer (HumanStar 200, HUMAN, Magdeburg, Germany) with commercially available kits (HUMAN, Magdeburg, Germany).
Performance and muscle functionSprint-time (sec) at 10-m and 30-m sprint was measured on an indoor track and field stadium with participants wearing spikes, using infrared photocells with a precision of 0.01 s (Newtest, Finland) as previously described (Tzatzakis et al. 2019), and the best of the two attempts was recorded. Average speed during the 10-m and 30-m sprint was calculated by dividing sprint-time by the distance covered.
During a CMJ test, jump height, ground reaction force, peak power, mean power, vertical stiffness, and peak rate of force development, were measured on two force platforms at 1000 Hz (Bertec, FP4060‐10‐2000, Bertec Corporation, Columbus, OH, USA), with each foot in parallel on the two platforms providing a separate yet time‐synchronized measurement data for each leg as previously described (Mina et al. 2019).
Isokinetic strength was assessed through maximal concentric and eccentric torque of the KE and KF muscles of both limbs on an isokinetic dynamometer (Cybex, HUMAC NORM 360, Ronkonkoma, NY) at 60° s−1 as previously described (Deli et al. 2017a, b).
Statistical analysisThe normality of the data distribution was examined with a Shapiro–Wilk test. CK and DOMS were not normally distributed and were analyzed with non-parametric tests. Friedman and Wilcoxon Signed Rand tests were performed for within trials analysis and Kruskal–Wallis and Mann–Whitney tests were applied for between trials comparisons. All the remaining dependent variables were analyzed using a two-way ANOVA (trial × time) with repeated measures on time to examine possible differences on recovery, and between trials differences. Statistical significance was set at p < 0.05. Effect Sizes (ESs) and confidence intervals (CIs) were calculated using the Hedge g method, corrected for bias. Accordingly, ES was interpreted as trivial, small, medium-sized, and large for values 0.00–0.19, 0.20–0.49, 0.50–0.79, and ≥ 0.8, respectively. Statistical analyses were performed with SPSS, version PASW 18.0 (SPSS Inc., Chicago, Ill.). The results are presented as mean ± SD.
Comments (0)