
Remember me
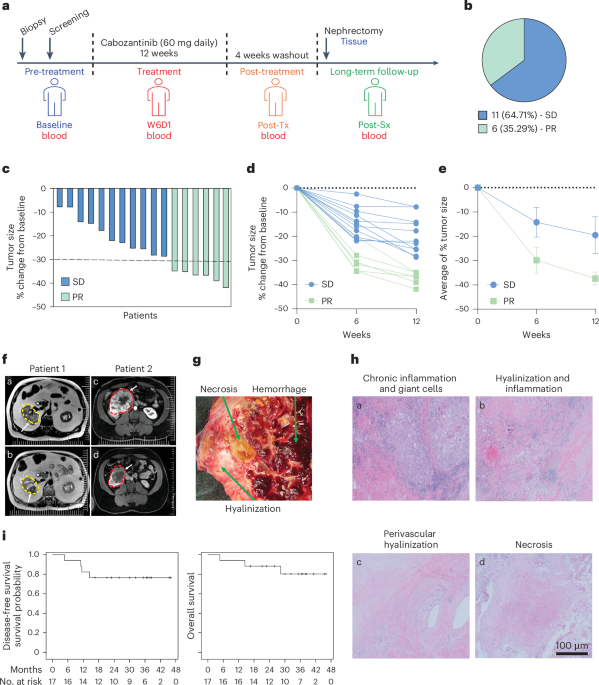

We assembled a soft-shell clam reference genome from a single healthy female clam collected from Larrabee Cove, Machiasport, Maine, USA (Fig. 1b,c; MELC-2E11). We assembled PacBio long reads into contigs using FALCON-Unzip23, scaffolded contigs to the chromosome-level with Hi-C sequences using FALCON-Phase, polished the scaffolds using 10x Chromium reads and annotated with RNA-seq reads using MAKER to yield a high-quality reference genome. The final reference genome is 1.22 Gb, organized into 17 phased scaffolds, matching the 17 chromosomes expected based on karyotype data24. The contig N50 is 3.4 Mb and the metazoan BUSCO (Benchmarking Universal Single Copy Orthologs25) score is 94.9%. Our assembly is similar in size, GC and repeat content of a recently published M. arenaria genome26 but with drastically improved contiguity and completeness (Supplementary Table 1), allowing for comprehensive genomic investigation into the evolutionary history of MarBTN.
We performed whole-genome sequencing (WGS) on three healthy uninfected clams and eight isolates of MarBTN from the hemolymph of highly infected clams (for example Fig. 1d) sampled from five locations across the established MarBTN range27 (Fig. 1a and Supplementary Table 2) and called single-nucleotide variants (SNVs) against the reference genome. Contaminating host variants were removed from MarBTN sequences via variant calling thresholds, rather than using paired tissue sequences as has been conducted for other transmissible cancers, as MarBTN hemolymph isolates were of high purity (>96% cancer DNA), whereas paired tissue samples from the host often contained high cancer DNA due to dissemination (Extended Data Fig. 1).
To investigate somatic evolution of the MarBTN lineage, it is important to distinguish between founder variants, those present in the genome of the founder clam from which the cancer initially arose, and somatic mutations, which occurred during the propagation and evolution of the cancer lineage. We observed that 10.7 million SNVs were shared by all MarBTN samples but not present in the reference genome. Of these, 8.1 million were found in at least one of the three healthy clams, indicating that these variants are likely from the germline of the founder.
A MarBTN phylogeny, built from pairwise SNV differences between samples, confirmed the previous analysis identifying two distinct sub-lineages of MarBTN6, here referred to as the Prince Edward Island (PEI) and United States of America (USA) sub-lineages (Fig. 1e). While the original founder clam is lost, we are able to leverage this deep split between the sub-lineages to identify those mutations likely to be somatic and not founder, as SNVs that occurred after the divergence of the two subgroups would be somatic. Most SNVs identified in the cancers and also found in healthy animals (and therefore highly likely to be founder variants) were present in both sub-lineages of MarBTN, but we observed some genomic regions with clusters of these founder SNVs in one sub-lineage but not the other. These are unlikely to be somatic mutations, instead they likely indicate loss-of-heterozygosity (LOH) events that took place after divergence of the sub-lineages. LOH was identified in 8% and 13% of the USA and PEI sub-lineage genomes, respectively (Extended Data Fig. 2). LOH regions were excluded during identification of somatic mutations in the following SNV analysis unless otherwise noted, since we are unable to determine which mutations are founders and which are somatic in these regions. SNVs found in all cancer samples, but no healthy samples, represent a mix of both founder variants and somatic mutations (2.3 million), whereas SNVs found in just one or the other sub-lineage represent likely somatic mutations (700,242). The majority of these SNVs were shared by all individuals in a sub-lineage and are herein referred to as ‘high-confidence somatic mutations’ (320,715 for PEI and 331,167 for USA).
Mutational biases in MarBTNBy analyzing all identified SNVs and their trinucleotide context, we observed a distinct SNV mutational bias in somatic mutations within both the PEI and USA sub-lineages that was not found in healthy clams (Fig. 2a). These biases are nearly identical in somatic SNVs from both sub-lineages and were also present in more recent mutations, such as SNVs unique to each MarBTN sample (Extended Data Fig. 3a). De novo signature extraction, which deconvolutes mutational biases in their trinucleotide context between samples28, yielded four mutational signatures (Extended Data Fig. 3b). Three signatures were found in both healthy clams and MarBTN samples and thus are likely endogenous within the germline of clam genomes. One signature closely resembles COSMIC signature 1 (termed Sig1′), showing a characteristic bias for C > T mutations at CpG sites, which is associated with the deamination of methylated CpGs in humans29. Sig1′ represents a greater fraction of mutations in the PEI sub-lineage (Extended Data Fig. 4), which may indicate that PEI has more methylated CpG sites than USA. Sig1′ also represents a greater fraction of mutations in coding regions, fitting previous observations that methylation is elevated in gene regions in bivalves30. The other two signatures are ‘flatter’ and less distinctive, most closely resembling COSMIC signatures 5 and 40 (termed Sig5′ and Sig40′), which are both associated with aging in humans31,32.
Fig. 2: Unique mutational signature found in somatic mutations dates cancer to >200 years old.
a, Trinucleotide context of SNVs found in healthy clams (top) and high-confidence somatic mutations in PEI (middle) or USA (bottom) sub-lineages, corrected for mutational opportunities in the clam genome. The trinucleotide order is the same as in b. b, De novo extracted mutational biases for SigS. c,d, Sig5′ (c) and SigS (d) attributed mutations per Mb (signature fitting estimates with fitting error) across USA MarBTN samples (n = 5) by sampling date. Results of linear regression with 95% CI (gray) overlaid. SNVs found in healthy clams, PEI MarBTN samples or LOH regions are excluded. e, Fraction of SNVs attributed to SigS from healthy clams (black), variants found in all MarBTN samples (gray) and high-confidence somatic mutations (colored). Variants found in all MarBTN samples are divided by whether they are found in healthy clams and whether they are homozygous (hmz) or heterozygous (htz). Dashed lines display SigS fraction estimates for likely somatic mutations and likely founder variants. f, Age estimate of the most recent common ancestor (MRCA) of the USA and PEI sub-lineages using Sig5′ and SigS and of the BTN origin from SigS mutations. g, dN:dS ratios (ratio of 1 indicates neutrality) for SNVs found in healthy clams (black), SNVs found in all MarBTN samples (gray) and high-confidence somatic mutations (colored) (n = 20,075,227, 7,676,209, 2,596,657, 320,715, 331,167 and 651,882 as shown from left to right). Error bars in all plots display 95% CI.
A single signature captured the biases specific to the somatic mutations in MarBTN, termed SigS (Fig. 2b). The closest analog in the COSMIC database of human mutational signatures is signature 9, which shares a T > G bias in A/T trinucleotide contexts31. Signature 9 in humans represents mutations induced by polymerase eta during somatic hypermutation and translesion synthesis in humans31,33. This may indicate that an error-prone polymerase with similar biases to human polymerase eta is broadly upregulated in cancer or induced due to a high level of DNA lesions during MarBTN replication. In addition to the notable T > G bias in A/T contexts, there is also a notable bias toward C > A mutations compared to healthy clam SNVs, particularly CC > CA and TCT > TAT. Notably, both C > A and T > G mutations have been linked to oxidative DNA damage34. Clam hemolymph is strongly hypoxic in late stages of the disease35, so this environment may also be contributing to these mutational biases.
MarBTN is several centuries oldSignatures 1 and 5 are considered clock-like in humans and other mammals36,37 and signature 1 was used to date CTVT’s origin to 4,000–8,500 years before present12. We took advantage of the temporal distribution of our USA samples to test whether any signatures were clock-like in MarBTN. We fitted somatic mutations for each sample (SNVs not in other sub-lineages and outside LOH regions) to the four extracted signatures and regressed mutations attributed to each signature against sample collection date (Extended Data Fig. 5a). Sig1′ did not correlate with time, perhaps due to methylation changes affecting CpG > TpG mutation rates and/or inherent differences between clams and mammals. Sig5′ mutations did display a strong correlation with time within the USA samples (Fig. 2c; P = 0.013). Assuming the Sig5′ mutation rate has remained steady since USA diverged from PEI, this corresponds to the sub-lineages diverging 319 years ago (95% CI 199–801 years); however, PEI samples have 33% fewer Sig5′ mutations than USA samples, indicating that the Sig5′ mutation rate differs between sub-lineages. SigS mutations also seem to increase with time and although the correlation is not statistically significant within the USA sub-lineage (Fig. 2d; P = 0.085), the number of SigS mutations in PEI samples fall within the range predicted by the linear regression of USA samples (Extended Data Fig. 5a). Minimal deviation in the SigS accumulation over time across both sub-lineages, despite their deep divergence, indicates that the mechanism producing SigS mutations is remarkably steady, although the lack of recent PEI samples does not allow us to independently test whether SigS continues to accumulate at the same rate in PEI. Based on the rate calculated from the USA samples, the sub-lineages diverged 315 years ago (95% CI 139–infinity years), in close agreement with our Sig5′ estimate. This estimate lacks an upper bound due to the small number of USA samples and higher deviation of SigS in comparison to Sig5′; however, we can be more confident in the stability of the SigS mutation rate than Sig5′ given the consistency in SigS between the sub-lineages.
As SigS is specific to somatic mutations, we can use it to estimate how many of the mutations shared by all cancers are somatic mutations and therefore estimate how long before the sub-lineage divergence the cancer first arose in the founder clam and began horizontal transmission. SigS contributed roughly half of high-confidence somatic mutations in each sub-lineage but was virtually absent from SNVs in the healthy clam population (Fig. 2e). If we assume that the SigS mutation rate has remained constant since oncogenesis and that the founder clam SNVs have a similar profile of genomic SNVs to those observed in healthy clams, we estimate that 3.1% of heterozygous SNVs found in all cancer samples, but no healthy samples, are somatic mutations attributed to SigS. This corresponds to 108 years by the SigS rate estimate above, for a total cancer age estimate of 423 years (95% CI 187–infinity years) (Fig. 2f), long before the first recorded observations of disseminated neoplasia in soft-shell clams in the 1970s19,20.
If we also assume the fraction of SigS somatic mutations has remained constant since oncogenesis, we estimate that, in addition to the 3.1% SigS SNVs estimated above, approximately 3.7% (95% CI 3.4–4.0%) of heterozygous SNVs found in all cancer samples, but no healthy clams, are somatic mutations due to the other three signatures. Combining this estimate (116,765 mutations) with sub-lineage-specific mutations (320,715 and 331,167) we calculate a total somatic SNV estimate of 441 and 452 mutations per Mb for the PEI and USA sub-lineages, respectively. This is a much higher mutation density than that estimated for the <40-year-old DFTD lineages (DFT1, <3.1 mutations per Mb; DFT2, <1.3 mutations per Mb)15, but less than the >4,000-year-old CTVT (~867 mutations per Mb from exome data)12, showing that mutation density generally scales with age across the small number of characterized transmissible cancer lineages.
Selection on SNVs is largely neutralWe used the ratio of nonsynonymous to synonymous coding changes (dN:dS) to infer selection acting on coding regions in our sample set. After correcting for mutational opportunities in coding regions, a ratio of one indicates neutral selection, >1 indicates positive selection and <1 indicates negative/purifying selection. We used dNdScv38 to determine that the global dN:dS for healthy clam SNVs was 0.454 (95% CI 0.451–0.457), indicating that genes are generally under negative selection in clam genomes, as expected. On a gene-by-gene basis, 70% of intact coding genes (16,222 out of 23,273) in healthy clams have significantly negative dN:dS, whereas 0.4% (88 out of 23,273) are significantly positive. Genes under positive selection in hosts may be those at the host–pathogen interface that are under selection for continued nonsynonymous mutation. In the case of clams, some of these genes may be a response to MarBTN evolution itself, though this hypothesis cannot be tested by the current study.
High-confidence somatic mutations had a global dN:dS of 0.982 (95% CI 0.943–1.024), indicating that MarBTN is largely dominated by neutral selection, reflecting observations in human cancers39 and CTVT12 (Fig. 2g). We found no genes with a dN:dS ratio significantly <1, indicating that no genes are under significant negative (or purifying) selection, but we did identify five genes with a dN:dS ratio significantly >1, indicating positive selection (Supplementary Table 3). For all five of these genes, nearly all somatic mutations were found in a single sub-lineage. Only one of these genes has a dN:dS ratio above one in healthy clams, suggesting that four of five genes are truly under positive selection in only a single sub-lineage and they are not founder or host clam SNVs. The only characterized gene among the four is a TEN1-like gene that is under positive selection in the USA sub-lineage. TEN1 is a component of the CTC1–STN1–TEN1 complex, which plays a crucial role in telomere replication and genome stability40.
Widespread structural mutationPolyploidy has been described in disseminated neoplasia in several bivalve species27,41. In M. arenaria, disseminated neoplasia cells have approximately double the chromosome count and genome content of healthy clam cells24. Given the discovery that these cells are of clonal origin6, we had hypothesized that a full genome duplication occurred early in the cancer’s evolution and that most of the MarBTN genome should be 4N. To test this theory, we called copy number states across each non-reference sample genome based on read depth (Fig. 3a). As expected, both healthy clams were 2N across nearly the entire genome (Fig. 3b). Notably, MarBTN samples displayed a wide variety of copy number states.
Fig. 3: Widespread copy number gain and structural mutation.
a, Copy number calls across clam genome, rounded to the nearest integer (black) and unrounded (gray) in 100-kB segments. The healthy clam is a representative individual and the MarBTN sub-lineages are averages of each individual sample from that sub-lineage, which were in close agreement. b, Summary of copy number states across entire genomes for two non-reference healthy clams and MarBTN sub-lineages. Gray lines display copy number summaries for individual samples within each sub-lineage, which are in close agreement. c, Number of SVs in each sample. The reference clam was excluded as one haplotype from that animal was used to build the reference genome and thus does not contain SVs. Values were normalized to the average number of SVs in non-reference healthy clams for each SV type (numbers below SV type labels). P values are from two-sided unequal variance t-test between MarBTN samples (n = 8) and non-reference healthy clams (n = 2). Exact P values are 1.9 × 10⁻⁵, 2.9 × 10⁻², 1.0 × 10⁻⁵ and 8.0 × 10⁻¹¹, respectively. Labels follow DELLY abbreviations of SV types: BND, translocations; DEL, deletions; DUP, tandem duplications; INV, inversions. Bars indicate means and error bars indicate s.d. d, Size distribution of tandem duplications in each non-reference sample. Dashed line indicates 11 kB. e, Telomere length estimated by TelSeq for each sample. f, Tandem duplicate copies of the mitochondrial D-loop region per sample. Healthy clams are black, MarBTN from PEI are red and MarBTN samples from USA are blue.
PEI samples were predominantly 4N with substantial 3N and 2N portions, whereas USA samples were more evenly distributed between 4N, 3N and 2N (Fig. 3b). Copy number calls in cancer samples displayed close agreement within sub-lineages (R2 > 0.94). There was a positive correlation between copy number calls between the two sub-lineages, but large differences could be observed suggesting that copy number changes have occurred since sub-lineage divergence (R2 = 0.53–0.56) (Extended Data Fig. 6a). Variant allele frequencies (VAFs) for high-confidence somatic mutations largely support copy number calls (Extended Data Fig. 6b,c), with some off-target VAF peaks, most notably in the lower copy number regions (<3N), indicating that some of these regions have higher copy numbers than called through this method but seemed lower likely due to reduced read mapping in polymorphic genome regions.
To estimate timing of duplication events we looked at VAF in regions called CN4 across both sub-lineages (14% of the genome; Extended Data Fig. 6d–g). While the majority of founder variants were distributed around a VAF of 0.5 (2 of 4 alleles) in both sub-lineages, as expected for a CN2 > CN4 duplication, USA also had VAF distributions around 0.25 and 0.75 (1 of 4 and 3 of 4 alleles) that were absent in PEI, indicative of CN2 > CN3 > CN4 duplication where not all haplotypes duplicated evenly. Additionally, we observe more 2 of 4 high-confidence somatic mutations in PEI than USA, indicative of later duplication events. The fraction of 2 of 4 somatic mutations in the USA sub-lineage was low in nearly all CN4 segments of the genome, indicating most segments duplicated before or shortly after the USA–PEI sub-lineage split, with a low rate of duplications occurring after that time. In contrast, many segments in PEI sub-lineage have around 20% of the somatic mutations at 2 of 4 alleles, suggesting a burst of duplications at some point after the USA–PEI sub-lineage split. Overall, these frequencies indicate the USA and PEI sub-lineages arrived at CN4 largely via independent duplication events, rather than the assumed single whole-genome duplication and that duplication events have occurred at multiple points throughout MarBTN evolution.
Many mid-chromosome breakpoints were apparent in the copy number calls, indicating that the MarBTN genome has likely undergone widespread structural alterations in addition to whole-chromosome and within-chromosome copy number gain. We are unable to resolve the structure of the MarBTN genome with the short sequence reads in our current dataset but were able to call likely structural variants (SVs) from split reads. Relative to non-reference healthy clams, MarBTN samples had a significantly higher number of deletions, inversions, tandem duplications and inter-chromosomal translocations, indicating substantial somatic structural alterations (Fig. 3c).
Comparing likely somatic SVs specific to each sub-lineage, USA samples had significantly more translocations and tandem duplications than PEI (Extended Data Fig. 6h). Median somatic tandem duplication sizes displayed a distinct distribution around a mode of ~11 kB (Fig. 3d and Extended Data Fig. 6i). In human cancers, tandem duplication phenotypes of this same size distribution are thought to be driven by the loss of TP53 and BRCA1 (ref. 42), indicating that a parallel mutational process may be influencing the observed genome instability in MarBTN and more active in the USA sub-lineage.
Maintenance of telomere length is a requirement for an immortalized cell line such as MarBTN and would be necessary for long-term survival. We estimated telomere lengths for each sample and found them to be highly variable within the USA sub-lineage (8–47 kB), whereas they were short but relatively stable within the PEI sub-lineage (8–11 kB) compared to healthy clams (18–19 kB) (Fig. 3e). Variable telomere lengths in the USA sub-lineage may relate to the TEN1-like gene that is under positive selection in that sub-lineage, as the CTC1–STN1–TEN1 complex inhibits telomerase and is involved in telomere length homeostasis40.
Mitochondrial genome evolutionA tree built from pairwise mitochondrial SNV differences between samples reflects a similar phylogeny to that built from genomic SNVs (Extended Data Fig. 7a). This indicates no evidence of mitochondrial uptake or recombination with host mitochondria, which has been observed in other transmissible cancers8,43,44. Transitions were highly overrepresented in both healthy and cancer samples, with C > T mutations composing 41 of 50 likely somatic mutations (Extended Data Fig. 7b). Somatic mutations resulted in missense mutations in at least 10 of the 12 mitochondrial genes, and the genes seem to be under relaxed selection, with dN:dS ratios of 0.97 (95% CI 0.45–2.1) versus 0.26 (95% CI 0.11–0.58) for SNVs in healthy clams (Extended Data Fig. 7c).
When aligned to the published M. arenaria mitochondrial genome45, short read sequences from all MarBTN and healthy samples display increased coverage across the mitochondrial D-loop (Extended Data Fig. 7d), indicating the region is multi-copy. The D-loop is part of the non-coding control region of the mitochondrial genome and is the origin of both replication and transcription. We resolved this region with PacBio long reads from the healthy reference clam, revealing three copies in tandem. Two of the copies contain a 236-bp insertion not found in the published mitochondrial genome. The insert includes an 80-bp region with 70% guanine content, likely complicating previous PCR-based efforts to resolve it. Altogether, the observed copies extend the D-loop region of the reference clam genome from 845 bp to 2,727 bp and the full mitochondrial genome to 19,815 bp.
Read coverage of the D-loop region suggest that there have been additional somatic tandem duplications in the MarBTN mitogenome. While read coverage indicates 3–4 copies in the non-reference healthy clams, PEI MarBTN samples have 5–6 copies and USA MarBTN samples have 8–11 (Fig. 3f). These somatic tandem duplications likely arose via replication errors and the trend toward increased copies in cancer suggests that they may be under selection. Selection can act on the level of the mitogenome itself, giving it a replicative advantage over other mitogenomes (as hypothesized for CTVT) or on the level of the cancer cell, if this duplication provides cancer cells a replicative advantage over others. Notably, the mitogenome site suspected to be under selection during repeated mitochondrial capture in CTVT is in the control region44, the same region we see amplified in MarBTN.
Transposable element mobilizationMarBTN is known to contain the LTR retrotransposon, Steamer, at a much higher copy number than healthy clams, indicating likely somatic expansion46. To test whether Steamer activity is ongoing we identified Steamer insertion sites using split reads spanning Steamer and the reference genome. Only 5–11 sites were found in each healthy sample, versus 275–460 sites in each cancer sample. A total of 193 sites are shared by all cancer samples, indicating that Steamer expansion likely began early in the cancer’s evolution, whereas sub-lineage-specific Steamer integrations indicate that Steamer has continued to replicate somatically in the MarBTN genome (Fig. 4a); however, Steamer has generated more insertions within the USA sub-lineage (n = 248) than the PEI sub-lineage (n = 64), indicating the regulatory environments of the sub-lineages have not remained stable since they diverged.
Fig. 4: Somatic expansions of Steamer and other TEs.
a, Phylogeny of all samples built from pairwise differences of Steamer insertion sites, colored by healthy (black), USA MarBTN (blue) and PEI MarBTN (red). Numbers along branches indicate the number of insertions unique to and shared by individuals in that clade, numbers on nodes indicate bootstrap support, with bootstrap values below 75 not shown. b, Logo plot of insertion bias relative to the 5-bp target site duplication (TSD) of all Steamer insertions, normalized by nucleotide content of the genome. c, Steamer insertion probability in annotated genome regions, normalized by read mapping rates and relative to full genome. Displayed for insertions found in all MarBTN samples but no healthy clams and unique to each sub-lineage but shared by all individual in that sub-lineage. Dashed line indicates expectation given random insertions. d, Volcano plot comparing copy number of all repeat elements in MarBTN and healthy clam samples by two-sided unequal variance t-test. Dashed lines correspond to significance threshold (P = 0.05, Bonferroni-corrected) and fivefold differences. Elements annotated as DNA transposons are marked in gray.
We also observed strong biases for Steamer to insert at specific genomic sequences. Steamer has a palindromic bias for NATG outside the five bp target site duplication (CATNnnnnnNATG), inserting at these locations 45× more frequently than expected by chance (Fig. 4b). Steamer was also >3× more likely to insert within 1,000 bp upstream of genes than would be expected by chance (Fig. 4c). We also observed early Steamer insertions (those found in all MarBTN samples) upstream of cancer-associated orthologs more often than expected by chance in the reverse but not the forward orientation (Extended Data Fig. 8a and Supplementary Table 4). This bias, which could indicate either an insertion preference for those locations or a selective advantage to MarBTN cells, was associated with those insertions.
We further investigated whether other transposable elements (TEs) in addition to Steamer have expanded somatically by identifying a library of repeat sequences (putative TEs) found in clam genomes and counting the copy number of each TE type in each sample. Forty-five TEs were present at a significantly higher copy number in cancer samples relative to healthy clams after removing TEs with fewer than fivefold differences (Fig. 4d). TEs annotated as DNA transposons were enriched in this dataset (8 of 45, 17.8%) compared to the total TE library (171 of 4,471, 3.8%), indicating this TE type may have been particularly successful in somatically expanding its copy number in MarBTN. LTR retrotransposons (such as Steamer) seem to have had more success in the USA versus PEI sub-lineage. Thirty-six TEs have significantly more copies in the USA sub-lineage than PEI and eight of those are LTR retrotransposons, compared to 0 LTR retrotransposons out of 20 of those more highly expanded in PEI (Extended Data Fig. 8b). Reduced copy numbers of LTR retrotransposons and other TEs in the PEI sub-lineage could be linked to the increased methylation indicated by mutational signature analysis, as methylation is thought to repress TE mobilization30,47. Our finding of widespread increases in TE copy numbers alongside structural mutations indicate general genome instability of the MarBTN lineage and provides further evidence of a higher rate of certain mutation types in the USA sub-lineage, which cannot be explained by the temporal distribution of the samples alone (Extended Data Fig. 5b).
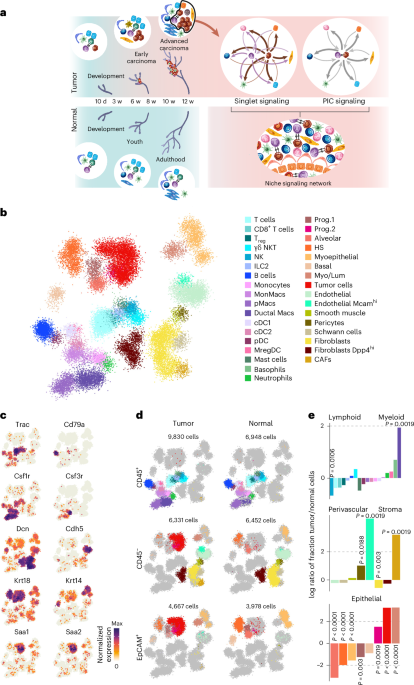
MarBTN gene expressionTo investigate the role of genes implicated in MarBTN evolution we sequenced RNA from a new set of five MarBTN isolates from the USA sub-lineage, six tissues (hemocytes, foot, gill, adductor muscle, mantle and siphon) across three healthy clams and hemocytes from an additional two clams (Supplementary Table 5). Both principal-component analysis and hierarchical clustering clearly separate MarBTN and hemocytes from all solid tissue samples (Fig. 5a and Extended Data Fig. 9a), indicating MarBTN likely originated as a hemocyte. This origin has been hypothesized due to MarBTN being most obviously detectable in the hemolymph6,48, but had not previously been tested.
Fig. 5: Expression indicates hemocyte origin and possible mutagenic pathways in MarBTN.
a, Principal-component analysis of normalized expression across all genes, with PC1 separating MarBTN and hemocytes from all other tissues. b, Volcano plot of expression of polymerase genes (n = 28 genes) for MarBTN (n = 5 isolates) compared to hemocytes (n = 5 clams). c, Normalized expression, in reads per gene, of TP53, HSPA9 (mortalin) and BRCA1 for MarBTN (n = 5 isolates), hemocytes (n = 5 clams) and non-hemocyte tissues (n = 15: 5 tissues for three clams). Error bars display standard deviation, differential expression comparison results from Wald test displayed as *P < 0.05; **P < 1×10⁻⁵; NS, not significant. Exact P values, adjusted for multiple comparisons, are 5.5 × 10⁻¹, 6.8 × 10⁻¹, 8.4 × 10⁻⁸, 5.0 × 10⁻⁷, 3.3 × 10⁻² and 1.6 × 10⁻⁹, respectively.
MarBTN-specific SigS resembles an error-prone polymerase signature in humans, so we first compared the expression of the 28 polymerase genes identified in the clam genome. We observed widespread upregulation across polymerases in MarBTN (Fig. 5b and Extended Data Fig. 9b), likely facilitating increased cellular replication and/or DNA damage repair. The most highly upregulated polymerase is homologous to polymerase Nu (POLN), a very low fidelity polymerase that plays a role in translesion synthesis and cross-link repair by homologous recombination49,50. Polymerase Nu frequently mis-incorporates dT opposite a template dG in humans51,52, a bias which does not match SigS; however, given the distance between bivalves and humans, it is possible that this polymerase introduces different biases in clams and is in part responsible for the observed SigS biases and/or genome instability.
We next looked at the expression of four genes under putative positive selection as identified by dN:dS (Extended Data Fig. 9c). Positive selection in cancer can indicate repeated selection for either loss-of-function or gain-of-function mutations. Two genes were not expressed in MarBTN, including the TEN1-like gene, indicating a potential loss of function, whereas two genes were upregulated in MarBTN versus healthy hemocytes, indicating a potential gain of function.
Finally, we investigated genes implicated by the distinct ~11 kB tandem duplication phenotype; TP53 and BRCA1. Previous work identified the deactivation of p53 via cytoplasmic sequestration by overexpressed mortalin
Comments (0)