Participants and Study Setting
This study was conducted in Santiago de Cali, Colombia, a region with high levels of genetic admixture and historical underrepresentation in genomic research. Participants were recruited from the Centro Médico de Atención Neurológica “Neurólogos de Occidente,” which provides outpatient services to socioeconomically diverse populations in the southwest of the country. The cohort included individuals clinically diagnosed with AD and cognitively healthy controls (CHC). Control participants were matched to AD cases by age and sex and recruited through a public call in Cali.
Inclusion Criteria and Diagnostic Framework
AD diagnoses were established by consensus among neurologists, neuropsychologists, and general practitioners involved in the study. In cases of diagnostic uncertainty, a neuropsychiatric evaluation was sought to confirm eligibility. All diagnoses adhered to the National Institute of Neurological and Communicative Disorders and Stroke–Alzheimer’s Disease and Related Disorders Association (NINCDS–ADRDA) criteria, consistent with NIA-AA recommendations [28, 29]. Beyond comprehensive neuropsychological and functional assessments, all participants underwent 3 T MRI scans, which were systematically reviewed to identify disease-related atrophy and to exclude other causes of dementia, including significant cerebrovascular disease, such as large infarcts, Fazekas grade 3 white matter lesions, mass lesions, or alternative neurodegenerative syndromes. Biomarkers from CSF or PET/SPECT were not collected due to feasibility constraints. Inclusion criteria for all participants required the absence of acute medical illness, cancer, or recent hospitalization. All participants provided written informed consent before enrollment.
Clinical and Neurocognitive Assessment
Demographic, clinical, and neuropsychological assessments were conducted to characterize participants’ cognitive status and health background comprehensively. Variables including age, sex, years of education, handedness, socioeconomic status, and vascular comorbidities (e.g., arrhythmia, cardiac surgery, diabetes, dyslipidemia, hypertension, hypothyroidism, and obesity) were collected through structured interviews and a review of medical charts.
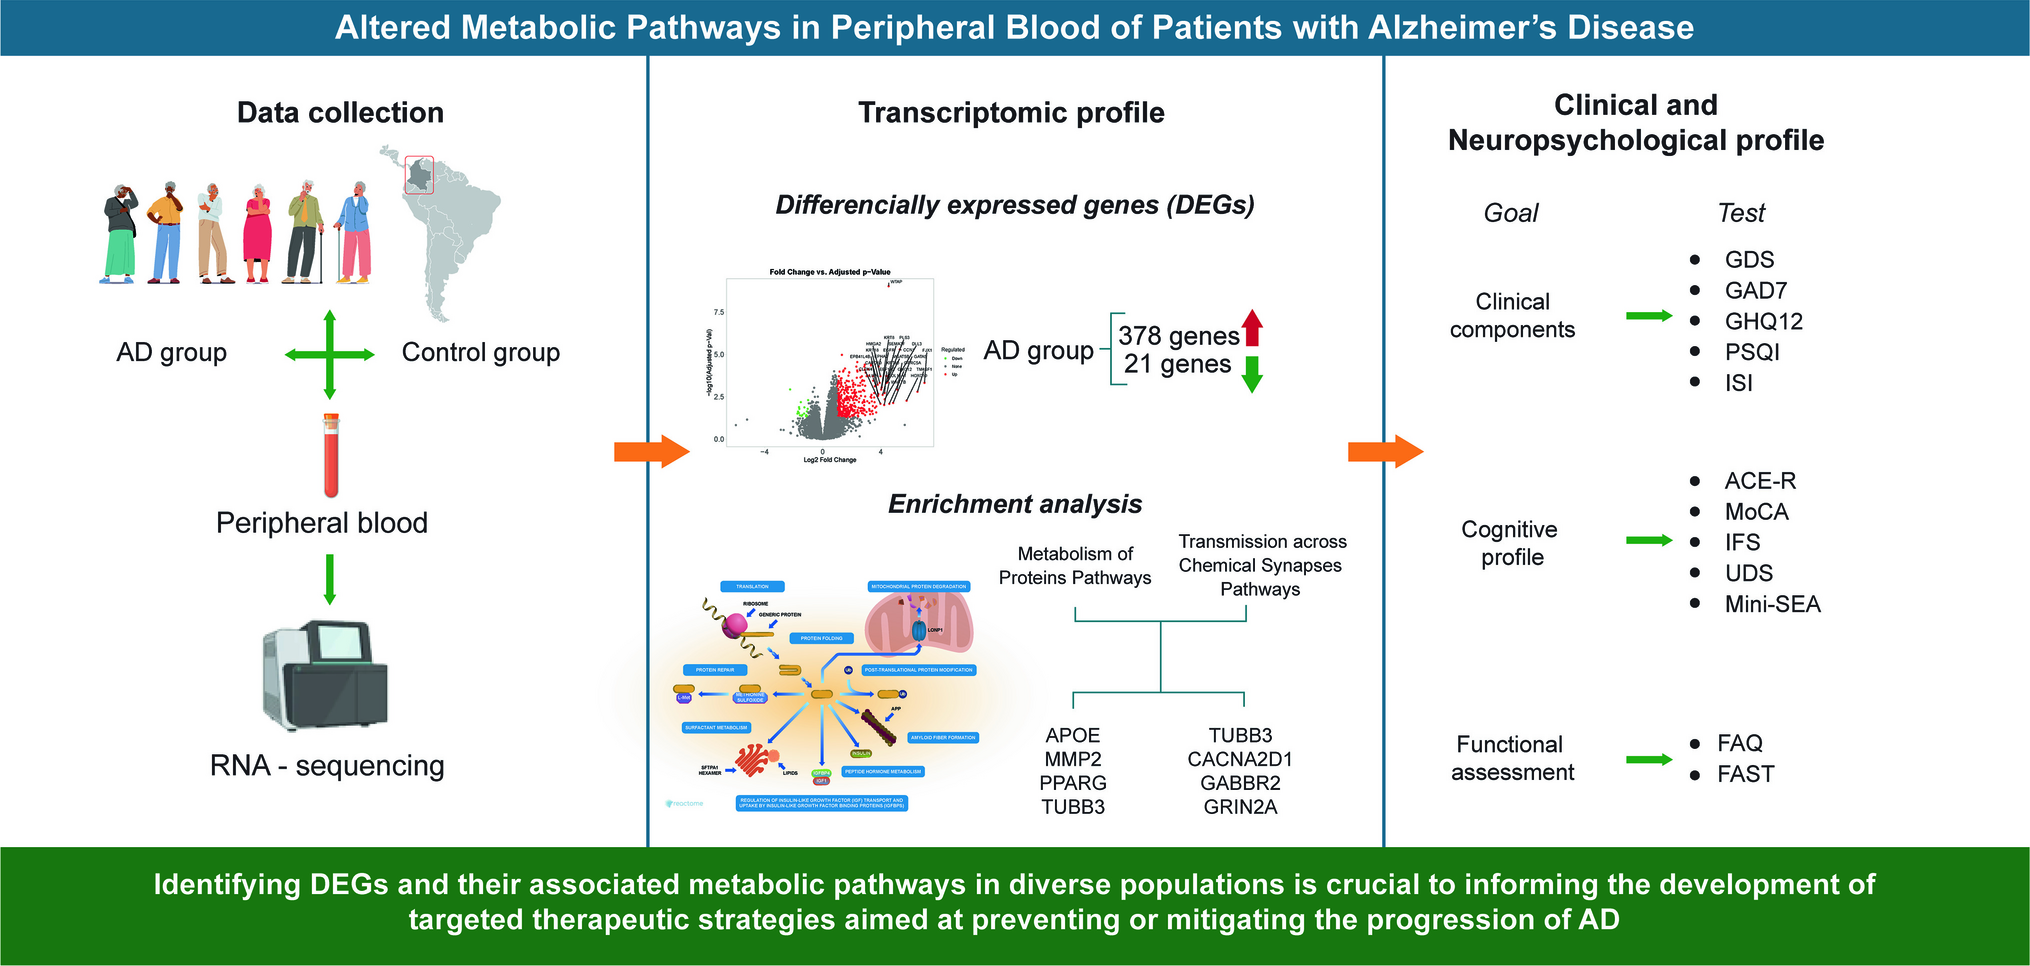
Global cognitive functioning was assessed using the Addenbrooke’s Cognitive Examination–Revised (ACE-R) and the Montreal Cognitive Assessment (MoCA), both widely validated tools in clinical and research settings. Executive functioning was evaluated using the INECO Frontal Screening (IFS), which captures deficits in inhibitory control, abstraction, and working memory. Education-adjusted norms were applied to minimize the influence of educational disparities, which are critical in LMIC settings where formal schooling is often limited or inconsistent.
Domain-specific cognitive abilities were further characterized using the Uniform Data Set (UDS) neuropsychological battery from the US National Alzheimer’s Coordinating Center (NACC), providing standardized composite scores for episodic memory, language, and visuospatial function. The Mini-Social Cognition and Emotional Assessment (Mini-SEA) was administered to assess socioemotional cognition, offering sensitivity to early changes in theory of mind and affective processing in neurodegenerative diseases.
Functional status was evaluated using the Functional Activities Questionnaire (FAQ) and the Functional Assessment Staging Tool (FAST), capturing declines in instrumental and basic activities of daily living, respectively. Emotional and psychiatric symptoms were assessed using the Geriatric Depression Scale (GDS) and the Generalized Anxiety Disorder scale (GAD-7). Sleep quality and related disturbances were measured with the Pittsburgh Sleep Quality Index (PSQI), the General Health Questionnaire (GHQ-12), and the Insomnia Severity Index (ISI), given the growing evidence linking sleep disruption to neurodegeneration.
All assessments were performed by trained clinicians or graduate-level researchers under supervision, ensuring consistency and inter-rater reliability. These evaluations provided a multidimensional phenotypic profile, essential for subsequent correlation with gene expression patterns.
RNA Extraction and Quality Assessment
Peripheral blood samples were collected in the morning, under fasting conditions and without tourniquet application, to minimize circadian and hemodynamic variability. Venipuncture was performed using PAXgene Blood RNA tubes (Becton Dickinson, Franklin Lakes, NJ), following the manufacturer’s protocol to preserve RNA integrity. All samples were immediately placed on dry ice and transported to the Molecular Biology Laboratory at Universidad del Valle within 2 h for processing.
Total RNA was extracted using the PAXgene Blood RNA Isolation Kit (Qiagen, Valencia, CA), following the manufacturer’s instructions. RNA concentration and purity were assessed using the Nanodrop 2000 spectrophotometer (Thermo Scientific, Waltham, MA), evaluating A260/A280 and A260/A230 ratios. The Qubit RNA High Sensitivity (HS) Assay Kit (Thermo Fisher Scientific) was used for accurate quantification. RNA integrity was further validated using the Agilent 2100 Bioanalyzer (Agilent Technologies, Santa Clara, CA), ensuring that all samples met the established thresholds for downstream sequencing applications.
Only RNA samples with optimal integrity and minimal contamination were advanced to library preparation. This strict quality control protocol was crucial in ensuring the reliability of transcriptomic analyses and minimizing technical noise in gene expression profiling.
Library Preparation and Sequencing
Following the manufacturer’s protocol, RNA samples that passed quality control underwent library preparation using the Universal Plus Total RNA-Seq with NuQuant kit (Tecan Genomics, Redwood City, CA). This protocol employs a stranded, second-strand synthesis approach (fr-second-strand), optimized for the detection of both abundant and low-expression transcripts in whole blood RNA.
RNA integrity was confirmed using the Agilent 2100 Bioanalyzer, and library quality was verified with the Qubit 2.0 Fluorometer (Invitrogen, Carlsbad, CA). To enhance reproducibility, technical replicates were generated for each sample, and only libraries with consistent replicate performance were advanced for sequencing.
Sequencing was performed on the NovaSeq 6000 platform (Illumina, San Diego, CA) using 150-bp paired-end reads, providing high-depth coverage and enabling robust detection of transcript-level expression. Each sample generated an average of ~ 60 million paired-end reads, ensuring sufficient resolution for downstream differential expression analysis and functional enrichment.
This workflow reflects best practices in blood transcriptomics and was designed to optimize sensitivity for detecting gene expression alterations relevant to AD, particularly in genetically diverse and underrepresented populations.
Bioinformatics Analysis
Raw sequencing reads underwent initial quality control using FastQC (Babraham Bioinformatics) to detect base call errors, adapter contamination, and sequence bias. High-quality reads were then aligned to the GRCh38.p14 human reference genome using the STAR aligner (v2.7.11a), a high-performance tool optimized for spliced read alignment in RNA- Seq datasets [30].
Gene-level quantification was performed using featureCounts (v2.0.0), which reads to genomic features to generate count matrices. Raw counts were normalized using the regularized log (rlog) transformation implemented in DESeq2 (Bioconductor), reducing heteroscedasticity and enabling reliable inter-sample comparison, particularly for low-abundance transcripts.
To reduce noise and increase biological relevance, we applied a minimum expression threshold: genes were required to exhibit more than 0.5 counts per million (CPM) in at least one sample to be retained. Differential expression analysis was conducted using DESeq2, applying a Benjamini–Hochberg false discovery rate (FDR) correction, with a significance threshold set at FDR < 0.05. To ensure biological relevance, we also imposed a log2 fold-change cutoff of ± 1, corresponding to a minimum two-fold difference in expression between groups.
Pathway-level functional enrichment analysis was performed using the Reactome Pathway Database, which employs a hypergeometric test to assess the overrepresentation of differentially expressed genes within curated signaling pathways. To account for multiple testing, p values were adjusted using the Benjamini–Hochberg False Discovery Rate (FDR) method, and both raw and adjusted values were retrieved. Pathways with FDR-corrected q-values < 0.05 were considered statistically significant.
This multi-step pipeline adheres to best practices in transcriptomic data processing and is particularly well-suited for studies involving ancestrally diverse populations, where technical robustness and noise reduction are essential for detecting biologically meaningful patterns.
Statistical Analysis
Following the identification of DEGs, we conducted a multivariate analysis to explore the relationships between transcriptomic alterations and neurocognitive outcomes in participants with AD. Specifically, we focused on genes mapped to three major metabolic pathways—protein, lipid, and carbohydrate metabolism, as defined by Reactome functional annotations.
To evaluate the associations between these metabolic signatures and neuropsychological performance, we employed multiple factor analysis (MFA) and variable clustering, both implemented in R (version 4.4.1). These techniques allowed us to integrate heterogeneous datasets, gene expression profiles, and cognitive/clinical measures into a unified analytical framework.
MFA, conducted using the FactoMineR package [31], facilitated the simultaneous analysis of multiple variable groups, identifying shared variance structures between metabolic gene clusters and cognitive domains. We used dimension reduction techniques and visualized associations via biplots to enhance interpretability, highlighting the most influential genes and clinical measures on the principal components.
In parallel, variable clustering, performed using the ClustOfVar package [32], grouped correlated variables based on similarity in their loading patterns. This approach was particularly suited to our analytic goals, as it emphasized variable-level relationships rather than participant-level clustering, relevant in a cohort exclusively composed of AD patients. Clusters were validated using an adapted k-means algorithm, and their stability was assessed through the adjusted Rand index [33], providing a robust measure of internal consistency.
This analytical strategy enabled the identification of transcriptomic profiles most strongly associated with cognitive performance, functional decline, and behavioral symptoms, providing an integrative view of molecular and phenotypic variation in AD.


Comments (0)