
Remember me
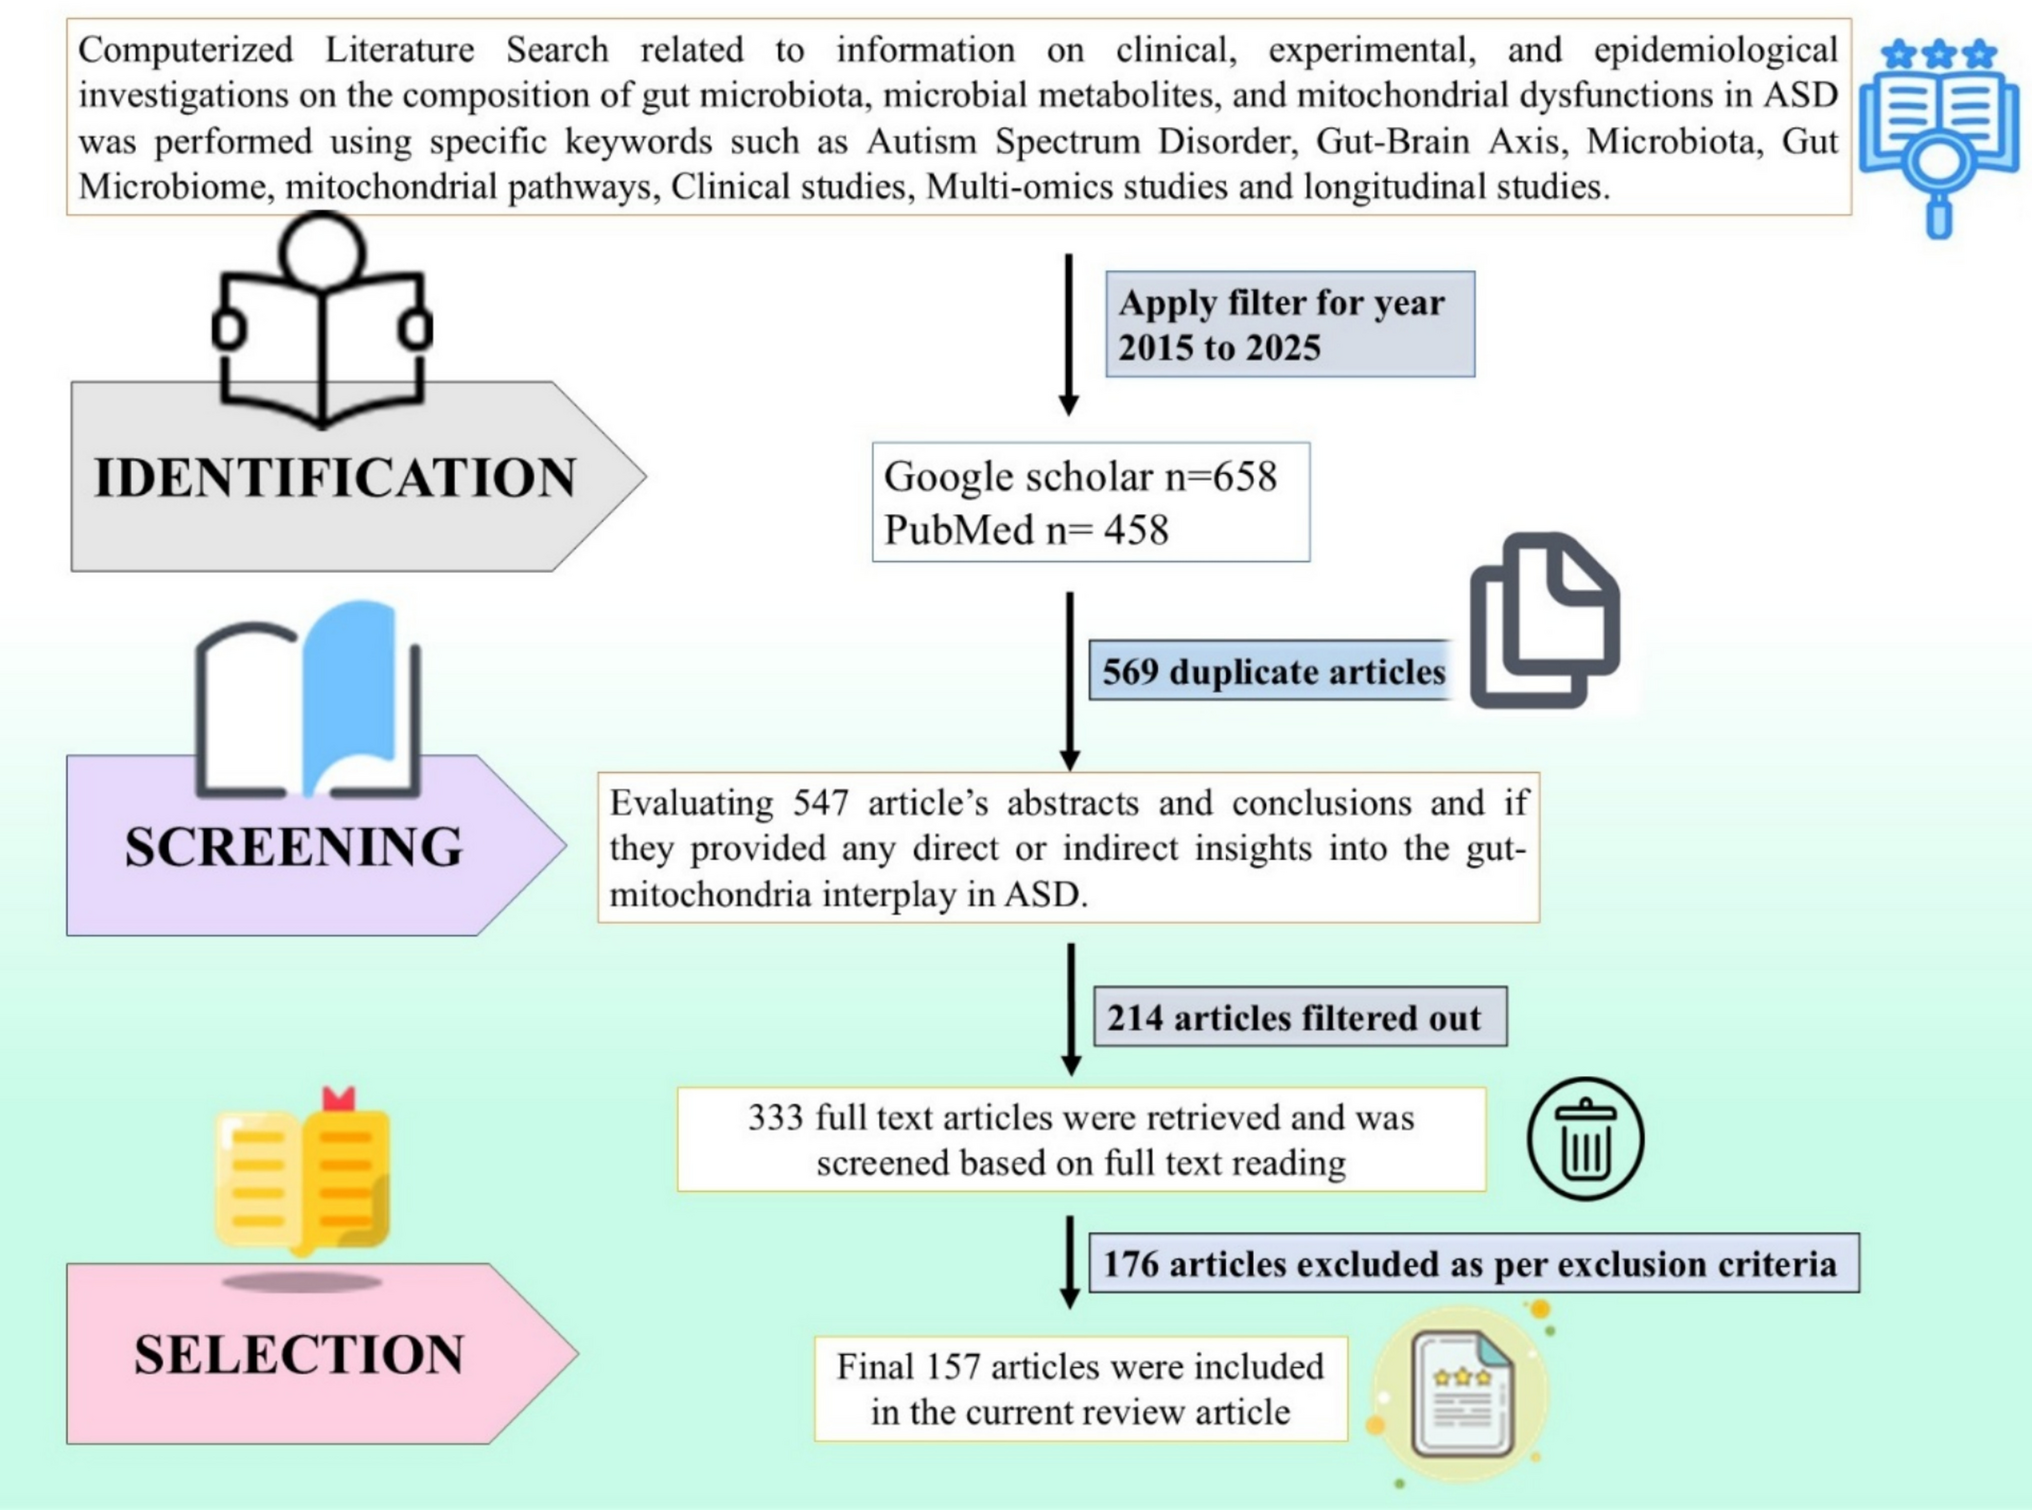
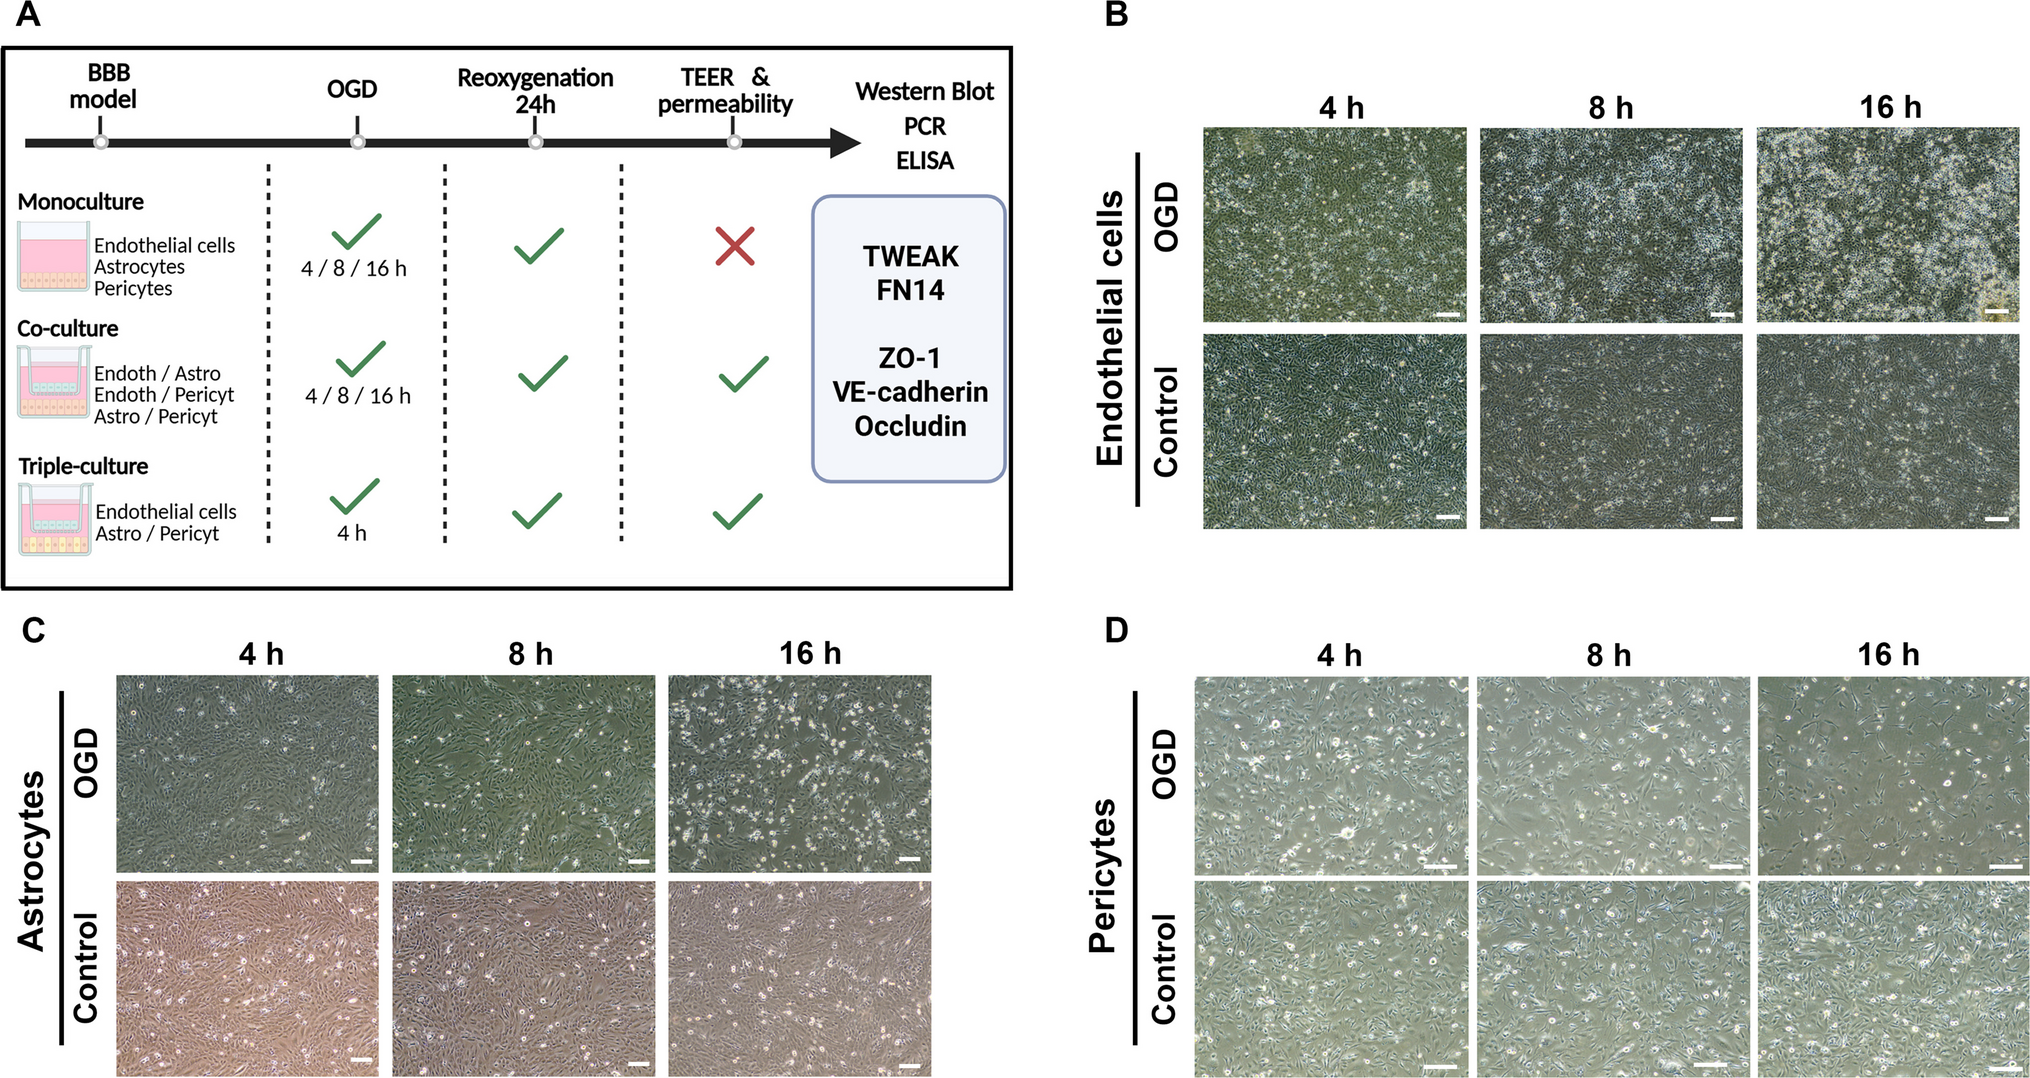

A schematic overview of the culture setup, experimental timeline, and analysis procedures is provided in Fig. 1A.
Fig. 1 The alternative text for this image may have been generated using AI.
A Schematic overview of the culture and analysis procedures. Representative images of endothelial cells (B), astrocytes (C), and pericytes (D) after 4, 8, and 16 h of OGD or normoxia (control) (scale bar = 200 µm)
Cell CultureImmortalized human brain endothelial cells (hCMEC/D3, Merck Millipore) [31, 32], human brain immortalized astrocytes (P10251, Innoprot), and human immortalized pericytes (CL 05008CLTH, CELTHER) were used in the experiments after confirming the absence of mycoplasma contamination via PCR. Cells were cultured in pre-coated flasks with: i) Collagen-I (1:7 in PBS, Thermo Fisher Scientific) for endothelial cells, ii) Poly-L-lysine (0.015 µL PLL/µL sterile water, Innoprot) for astrocytes, and iii) 0.5% gelatin (Sigma-Aldrich) for pericytes. Microvascular endothelial cell growth medium (Pelo Biotech, GmbH) was used for endothelial cells, pericytes, and co- and triple-culture models, while astrocytes were maintained in Astrocyte Medium (Innoprot) with the supplements recommended by the manufacturer. The culture medium was refreshed every 48 h, and cells were detached using TrypLE (Thermo Fisher Scientific) when necessary.
Generation of 2D BBB ModelIn monoculture experiments, endothelial cells, astrocytes, and pericytes (all at 24,000 cells/cm2) were cultured separately under standard conditions (5% CO₂, 37 °C, in a humidified incubator) in 6-well plates (clear polystyrene, Corning). For co-culture and triple-culture models, endothelial cells (8000 cells/cm2) were seeded on the apical side of 0.4µm pore-size Transwell inserts (#3450, Corning) in 12-well plates (clear polystyrene, Corning). In co-culture, pericytes or astrocytes (both at 24,000 cells/cm2) were plated at the bottom of the well. In triple-culture, a 1:1 mixture of astrocytes and pericytes (both at 12,000 cells/cm2) was plated at the bottom, enabling cross-talk between cell types via soluble factors, better mimicking physiological BBB conditions. The 12-well plates were specifically selected to allow transepithelial electrical resistance (TEER) measurements. Cells were maintained under standard culture conditions for 3–5 days, depending on the specific cell combination, until confluence was achieved [32].
OGD ExperimentsOnce the cells reached confluence (visually confirmed using phase-contrast microscopy), quiescence was induced to promote the characteristic endothelial phenotype. This was achieved by replacing the culture medium with 1% fetal calf serum (FCS), without vascular endothelial growth factor (VEGF), and incubating the cells for 24 h prior to the experiment. This procedure was applied to all cultures except pericyte and astrocyte monocultures, which were maintained in their specific media as described earlier [32,33,34].
For the OGD experiments, cells were incubated in a hypoxic chamber set to 1% oxygen using a deoxygenation system. Dulbecco’s Modified Eagle Medium (DMEM) with low glucose and without pyruvate, glutamine, or phenol red (Thermo Fisher Scientific) was used. The selected conditions aimed to mimic the ischemic penumbra, as it is a region potentially treatable after a stroke with reduced but non-zero cerebral blood flow [35]. Two experimental groups were established: i) the OGD group and ii) the reoxygenation group. In both groups, cells were exposed to OGD for 4, 8, or 16 h.
In the OGD group, samples were collected immediately after OGD exposure. In the reoxygenation group, immediately after OGD, the medium was replaced without any intermediate washing steps, and the cells were subjected to an additional 24 h reoxygenation phase in a standard incubator. Endothelial cells, co-cultures, and triple cultures were reoxygenated using microvascular endothelial cell growth medium supplemented with 1% FCS and no VEGF, while astrocyte and pericyte monocultures were maintained in their respective media.
Based on previous experiments with mono-cultures and co-cultures, 4 h of OGD was determined to be the optimal condition for the triple-culture system.
In all experiments, control groups for both OGD and OGD with reoxygenation were maintained in parallel under normoxic conditions for the corresponding durations. Medium changes were performed identically to those in the experimental groups to ensure consistent handling and timing across all conditions. The expression and levels of TWEAK, Fn14, and other in vitro BBB markers in response to OGD conditions was evaluated in both the OGD and reoxygenation groups.
Western Blot AnalysisAfter OGD experiments, cells were lysed using RIPA buffer (50 mM Tris, pH 8.0, 150 mM NaCl, 0.1% SDS, 0.5% sodium deoxycholate, 1% NP-40) supplemented with a protease inhibitor cocktail (cOmplete Protease Inhibitor Cocktail, Roche). The samples were mixed with Laemmli buffer (750 mM Tris–HCl, pH 6.8, 5% SDS, 40% glycerol, and 80 mM DTT) and denatured at 95 °C for 10 min. Proteins were then separated on a 10–12% SDS-PAGE gel and transferred overnight onto a PVDF membrane using a Mini Trans-Blot Electrophoretic Transfer Cell (Bio-Rad).
The membrane was blocked with 5% non-fat dry milk and incubated overnight with primary antibodies targeting the following proteins: (i) anti-TWEAK (1:1000, #4437, Cell Signaling Technology),(ii) anti-TWEAKR (1:1000, #4403, Cell Signaling Technology), (iii) anti-ZO-1 (1:500, #33–9100, Thermo Fisher Scientific), (iv) anti-VE-cadherin (1:500, #sc-52751, Santa Cruz),(v) anti-occludin (1:500, #33–1500, Thermo Fisher Scientific), and (vi) anti-β-actin (1:25,000, #A5316, Sigma-Aldrich) used as a loading control.
After incubation with primary antibodies, the membrane was washed and then incubated with secondary antibodies, anti-mouse (#7076, 1:3000, Cell Signaling Technology) or anti-rabbit (#7074, 1:3000, Cell Signaling Technology), overnight at 4 °C. Protein detection was carried out using an enhanced chemiluminescence solution and was visualized with an Image FluorChem FC2 system (Cell Biosciences), employing AlphaView Software (Version 1.3.0.7, Innovatech Corporation). Densitometric analysis were performed using Image Lab Software (Version 6.0.1.34, Bio-Rad) to quantify protein levels.
Quantitative Real-Time PCR (RT-qPCR)Total RNA was extracted using the NucleoSpin® RNA Isolation Kit (Machery-Nagel), following the manufacturer’s instructions. Subsequently, 500–1000 ng of total RNA was reverse transcribed using the High Capacity cDNA Reverse Transcription Kit (Thermo Fisher Scientific). RT-qPCR was performed using TaqMan probes for the following target genes: (i) OCLN (Hs00170162_m1), (ii) CLDN5 (Hs00533949_s1), (iii) CDH5 (Hs00901465_m1), (iv) TJP1 (Hs01551871_m1), (v) TNFRSF12A (Hs00171993_m1), and (vi) TNFSF12 (Hs00387540_g1). Calnexin (CANX) (Hs01558409_m1) was used as the housekeeping gene after preliminary validation for stable expression across OGD conditions and was compared with GADPH. PCR reactions were carried out using the TaqMan® Fast Advanced Master Mix on the Quant Studio 7 flex Fast Real-Time PCR System (Thermo Fisher Scientific). Gene expression levels were analyzed using the comparative Ct (ΔΔCt) method.
sTWEAK ELISA AnalysisCell culture media from the co-culture and triple-culture OGD experiments were collected and immediately centrifuged at 12,000 g for 10 min to remove any cellular debris. The supernatants were then stored at − 80 °C until further analysis. The concentration of sTWEAK was quantified using the Human TWEAK (TNFSF12) ELISA Kit (#EHTNFSF12, Thermo Fisher Scientific). The assay was carried out following the manufacturer’s instructions, with a detection sensitivity of 40 pg/mL. Each sample was analyzed in duplicate, and appropriate controls were included.
Measurement of Transendothelial Electrical Resistance (TEER)After performing the OGD experiments, TEER was measured to assess the integrity of the endothelial cell monolayer. TEER was measured using the Electrical Resistance System (Millicell-ERS-2; Millipore Bedford, MA), following the manufacturer’s instructions, which allows for the precise calculation of electrical resistance across the cell layer. Empty Transwell inserts were used as internal controls to account for any background resistance from the membrane itself. This measurement provides valuable insights into the disruption or maintenance of the BBB properties following OGD and can indicate alterations in endothelial permeability.
Permeability Assay and Apparent Permeability Coefficient (Papp)The Papp was calculated to evaluate the effects of OGD on endothelial cells in both co-culture and triple-culture systems. This assay quantifies the transport of a compound, such as fluorescein, across the endothelial monolayer, providing valuable insights into changes in permeability under OGD conditions. Cell culture medium containing 376 Da fluorescein (10 µM) was added to the upper chamber. Every 20 min of incubation at 37 °C for up to 1 h, samples were collected from the lower chamber, and fluorescence was measured in triplicate using a microplate reader (Tecan) at 485/535 nm. A known fluorescein concentration was used to construct a concentration curve and to extrapolate the fluorescence concentrations. After fluorescence detection, the Papp was determined using the Eq. (1) as follows:
$$_ = \frac_ \times _}_ \times t}$$
(1)
where, Vr = volume of the receiver chamber; Cr = final concentration of fluorescein in the receiver chamber; A = surface area of the cell monolayer in the Transwell insert; C0 = initial concentration of fluorescein in the donor chamber; t = total duration of the experiment.
This method allows assessing compound transport across the cellular barrier, providing a quantifiable measure of how OGD influences endothelial permeability. A higher value indicates greater permeability, while a lower value suggests a more restrictive barrier. By monitoring changes in Papp, this assay helps to understand the impact of OGD on the integrity of the BBB in our in vitro models.
Statistical AnalysisAll data were collected and organized in a custom database created in Microsoft Excel 2016 (Microsoft Corporation) and subsequently analyzed using GraphPad Prism 9 (GraphPad Software). Data are presented as the mean ± standard error of the mean (SEM). Experimental groups were defined based on the duration of OGD, with or without reoxygenation. All experiments were performed in triplicate (n = 3 independent biological replicates) with technical duplicates where applicable, though some conditions had n = 2 due to technical constraints. The Shapiro–Wilk test was performed to assess the normality of the data distribution. For normally distributed data, comparisons between groups were made using t-tests with Welch’s correction applied when standard deviations were unequal. For non-parametric data, the Mann–Whitney test was used to determine statistical differences. Statistical significance was considered when p < 0.05 (*p < 0.05; **p < 0.01; ***p < 0.001). All graphical representations were generated using GraphPad Prism 9, ensuring clear and accurate presentation of the data.
Comments (0)