
Remember me
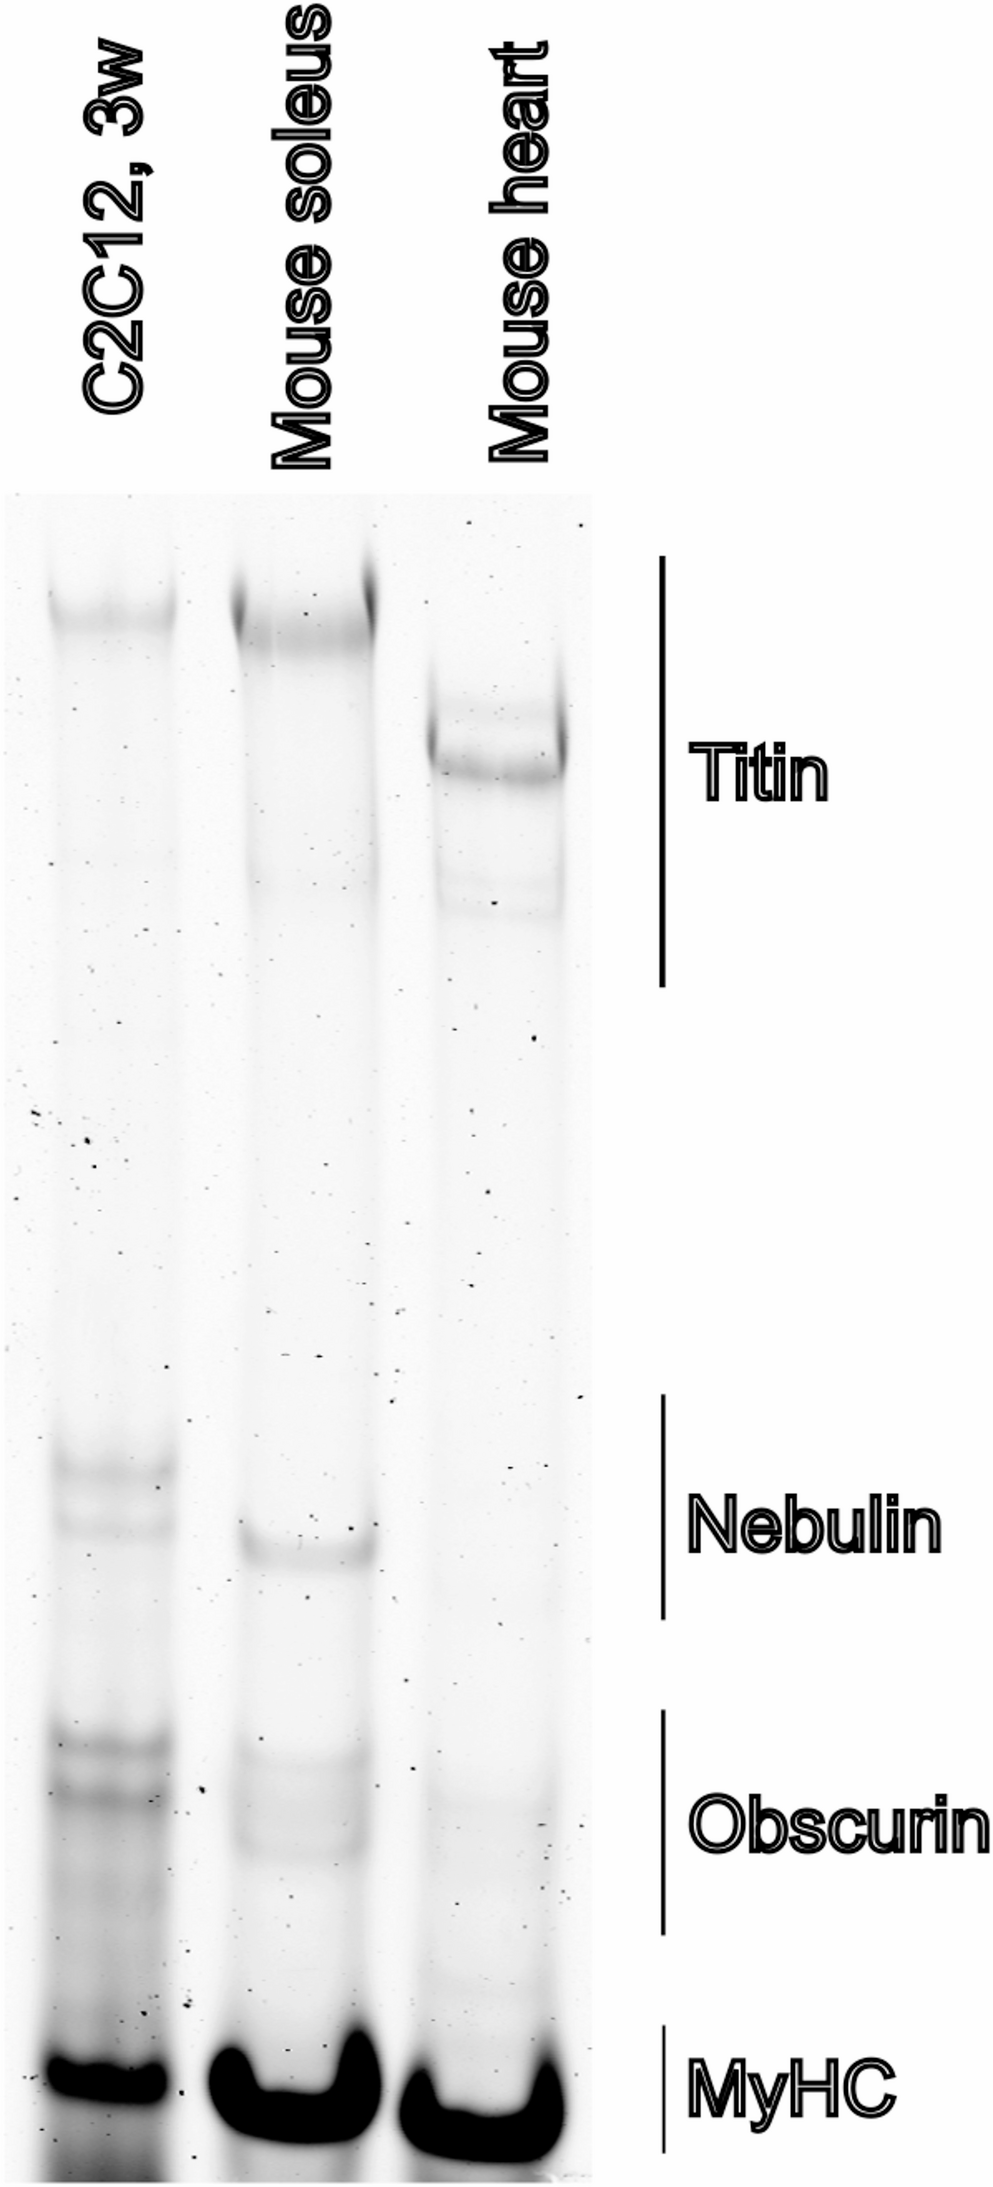

The standard differentiation medium (DM) widely used for C2C12 differentiation is DMEM supplemented with 2% heat-inactivated horse serum (HS). However, the HS batches are known to differ in the ability to support differentiation, and our experience is that identifying satisfactorily performing batches is challenging. We have observed that DM further supplemented with 10% OPTI-MEM (DMO) consistently shows reliable induction of myogenic differentiation, and we have adopted DMO as the standard C2C12 differentiation medium in our laboratory. We noticed that after 3 weeks of differentiation on gelatin hydrogels C2C12 myotubes expressed full length Titin (Fig. 1). However, to better understand the factors influencing differentiation efficiency, we sought to investigate whether additional components—such as sodium pyruvate or insulin—or variables such as the frequency of media changes, or other commercial media could further enhance or modulate the differentiation outcome.
Fig. 1
Titin protein expression in C2C12 myotubes. Titin protein was detected in C2C12 differentiated on hydrogel for 3 weeks (C2C12, 3w) using vertical agarose gel electrophoresis (VAGE). Titin full length was detected in C2C12 cells, and mouse muscle soleus and mouse heart were run as controls
Comparison of differentiation medium and promocell mediumWe first compared DMO with a commercially available skeletal muscle differentiation medium (SkMC-DM) from PromoCell. This initial comparison aimed to determine how DMO formulation performs relative to a standardized commercial option. We had previously observed that C2C12 initially differentiate efficiently in PromoCell SkMC-DM, but deteriorate if kept in this medium longer. Indeed, the manufacturer’s protocol for human primary myoblasts advises changing the medium to Skeletal Muscle Cell Growth Medium (SkMC-GM) after a few days. To determine a protocol that works for C2C12 cells on hydrogel, we tested differentiation in DMO, PromoCell SkMC-DM alone, and conditions where cells were initially differentiated in PromoCell SkMC-DM and then switched either to PromoCell SkMC-GM (SkMC-DM->G) or DMO (SkMC-DM->D) after 5, 7, or 9 days, with daily media changes. Cell morphology was documented at 1, 2 (see Supplementary Fig. 1), and 3 weeks (Fig. 2a) following the initiation of differentiation. Phase-contrast imaging confirmed that after initial myotube formation, cells did not thrive in PromoCell SkMC-DM. However, switching to SkMC-GM (SkMC-DM->G) or DMO (SkMC-DM->D) after 5 or 7 days of differentiation appeared to mitigate this effect. Expression of myosin heavy chain (MyHC), a marker of myogenic differentiation, was assessed at the 3-week time point to evaluate the extent of terminal differentiation. In terms of myosin content, the clearly most effective condition to promote myotube formation was a switch to SkMC-GM after 5 days of differentiation (Fig. 2b-c). Interestingly, while spontaneous twitching was observed after 3 weeks with both SkMC-GM and DMO, the two media resulted in different myotube morphology: SkMC-DM followed by DMO (SkMC-DM->D) produced thinner aligned myotubes—similarly to DMO alone—whereas switching to SkMC-GM (SkMC-DM->G) gave produced thicker and less organized myotubes.
Fig. 2
Optimization of the most effective conditions for PromoCell differentiation medium. Comparison of differentiation medium (DMO) and PromoCell differentiation medium (SkMC-DM), and determination of optimal time to switch to DMO or growth medium for C2C12 cells. Cells were differentiated for 3 weeks on hydrogels. (a) Light microscopy showing cell morphology for the various culture strategies after 21 days. Daily changes of DMO or SkMC-DM for the whole time or changed from SkMC-DM to DMO after five, seven or nine days (SkMC-DM ->5D, SkMC-DM ->7D, SkMC-DM ->9D) or to PromoCell growth medium after five, seven or nine days (SkMC-DM ->5G, SkMC-DM ->7G, SkMC-DM ->9G). (b) Representative western blot for myosin heavy chain (MyHC). In (c) the relative level of myosin to total protein for the same culture conditions (three asterisks indicate p < 0.001). DMO was used as control (= 1). Graph shows mean ± SD of six wells from two replicate experiments (for the stain see Supplementary Figure S5)
Effect of media composition to myogenic differentiationWe then investigated the contribution of individual media components by modifying the differentiation medium formulation. These experiments aimed to identify whether specific supplements could enhance differentiation or compensate for the removal of key components. Insulin is known to promote myotube formation (Conejo et al. 2001; Florini et al. 1996), and we assume that the good performance of DMO compared to DM depends on insulin present in Opti-MEM. Hence, we tested the effect of supplementing standard DM or DMO with Insulin-Transferrin-Selenium (DM + I, DMO + I). Some online sources advise against including pyruvate in differentiation medium (Jiang et al. 2023), and hence we use base DMEM without pyruvate, but we reasoned that an additional carbon source could be beneficial for the high metabolic demands of the myotubes. To test this, DM and DMO were supplemented with 1 mM sodium pyruvate (DM + P, DMO + P). Additionally, DMO was supplemented with both insulin-transferrin-selenium (I) and pyruvate (DMO + PI). Differentiation outcomes were assessed through morphological analyses (Fig. 3a and b) and quantification of myosin heavy chain (MyHC), calsequestrin 1/2 (CASQ1/2), Troponin T1 (TNNT1) and T3 (TNNT3) expression at 1, 2, and 3 weeks after starting the differentiation (Fig. 3c-g).
Fig. 3
Effects of different media composition. (a) Phenotypic effects of supplementing standard differentiation medium (DMO). Light microscopy shows myotube formation in C2C12 cells cultured in DMO, DMO + I (insulin, transferrin and selenium), DMO + P (pyruvate), or DMO + PI after 1, 2, and 3 weeks. Scale bar 100 μm. (b) Morphological effects of Opti-MEM omission in differentiation medium (DM). Light microscopy shows myotube development in C2C12 cells cultured in DM, DM + I or DM + P after 1, 2, and 3 weeks. Scale bar 100 μm. (c) Total protein stain for MyHC after 1, 2, and 3 weeks of differentiation in different media composition. C2C12 were cultured in DMO and DM supplemented with Insulin-Transferrin-Selenium (DM + I, DMO + I), and with pyruvate (DMO + P, DM + P), and DMO supplemented with both Insulin-Transferrin-Selenium and pyruvate (DMO + PI). Representative western blot for (d) myosin heavy chain (MyHC), (e) calsequestrin 1/2 (CASQ1/2), Troponin T1 (TNNT1), and Troponin T3 (TNNT3). Quantification of f) MyHC g) CASQ1/2, h) TNNT1, i) TNNT3 on total protein stain (for the stain see Supplementary Figure S5). Graph shows mean ± SD of nine wells from two replicate experiments for myosin heavy chain and calsequestrin1/2, and six wells from two replicate experiments for Troponin T1 and T3. One asterisk indicates p < 0.5, three asterisks indicate p < 0.001, four asterisks indicate p < 0.0001
Phase-contrast imaging for DMO and its modified conditions revealed no notable differences in myotube formation (Fig. 3a). The total cellular biomass progressively increased with the duration of differentiation, reflecting the accumulation of mature, multinucleated myotubes over time (Fig. 3c). Total MyHC expression progressively increased over time, with detectable levels rising from week 1 through week 3 (Fig. 3d and f). Both insulin-transferrin-selenium and pyruvate supplementation, together or in combination, enhanced MyHC expression compared to DMO alone, with insulin-transferrin-selenium producing a more pronounced effect.
In contrast, omission of Opti-MEM (DM) impaired myotube development (Fig. 3b) and MyHC production (Fig. 3d and f), indicating that the utilized horse serum lot does not support differentiation effectively. This was notably rescued by the addition of insulin-transferrin-selenium (DM + I), whereas supplementation with pyruvate (DM + P) did not result in any visible improvement in myotube morphology and myosin production.
Due to the low expression of total myosin, we excluded DM and DM + P from western blot analyses of CASQ1/2, TNNT1, and TNNT3 at week 1, 2, and 3 of differentiation (Fig. 3e). At week 3, DMO significantly increased calsequestrin levels, and also insulin-transferrin-selenium and pyruvate, both individually and combined, further elevated its expression (Fig. 3g). The same effects can be observed in the TNNT1 and TNNT3 protein expression (Fig. 3e and h-i). Notably, both DMO + I and DMO + PI significantly increased TNNT3 expression after 2 and 3 weeks of differentiation (Fig. 3i). Supplementation with insulin-transferrin-selenium seemed also to prevent the embryonic myosin downregulation at week 2 (p < 0.05) and 3 of differentiation compared to the DMO control condition, as observed by western blot analysis (Supplementary Figure S2).
Effect of media change frequency on C2C12 differentiationC2C12 culture protocols typically advise to change differentiation media daily, although variations exist. As less frequent media changes would reduce both the workload and cost of experiments, we evaluated the impact of media change frequency on C2C12 differentiation in the hydrogel system. Cells differentiated in DMO and DMO + PI were subjected to different schedules, with media changes performed daily, every other day, or every three days. Phase-contrast imaging revealed that daily media changes provided the most favourable condition for myotube formation and maturation (Fig. 4a). This observation was supported by western blot analysis of MyHC expression, which decreased significantly with reduced media change frequency—particularly in the DMO condition when media was changed every three days (p < 0.01). Interestingly, the inclusion of insulin and pyruvate (DMO + PI) helped preserve myosin levels under less frequent media change schedules (Fig. 4b-c).
Fig. 4
Impact on media change schedule on C2C12 differentiation. (a) Cells were cultured in DMO or DMO + PI for three weeks with media changes daily (1d), every second day (2d) or every third day (3d). In (b) representative western blot of myosin heavy chain (MyHC) and in (c) quantification of total myosin versus total protein (two asterisks indicate p < 0.01). DMO 1 d was used as control (= 1). Graph shows mean ± SD of six wells from two replicate experiments (for the stain see Supplementary Figure S5)
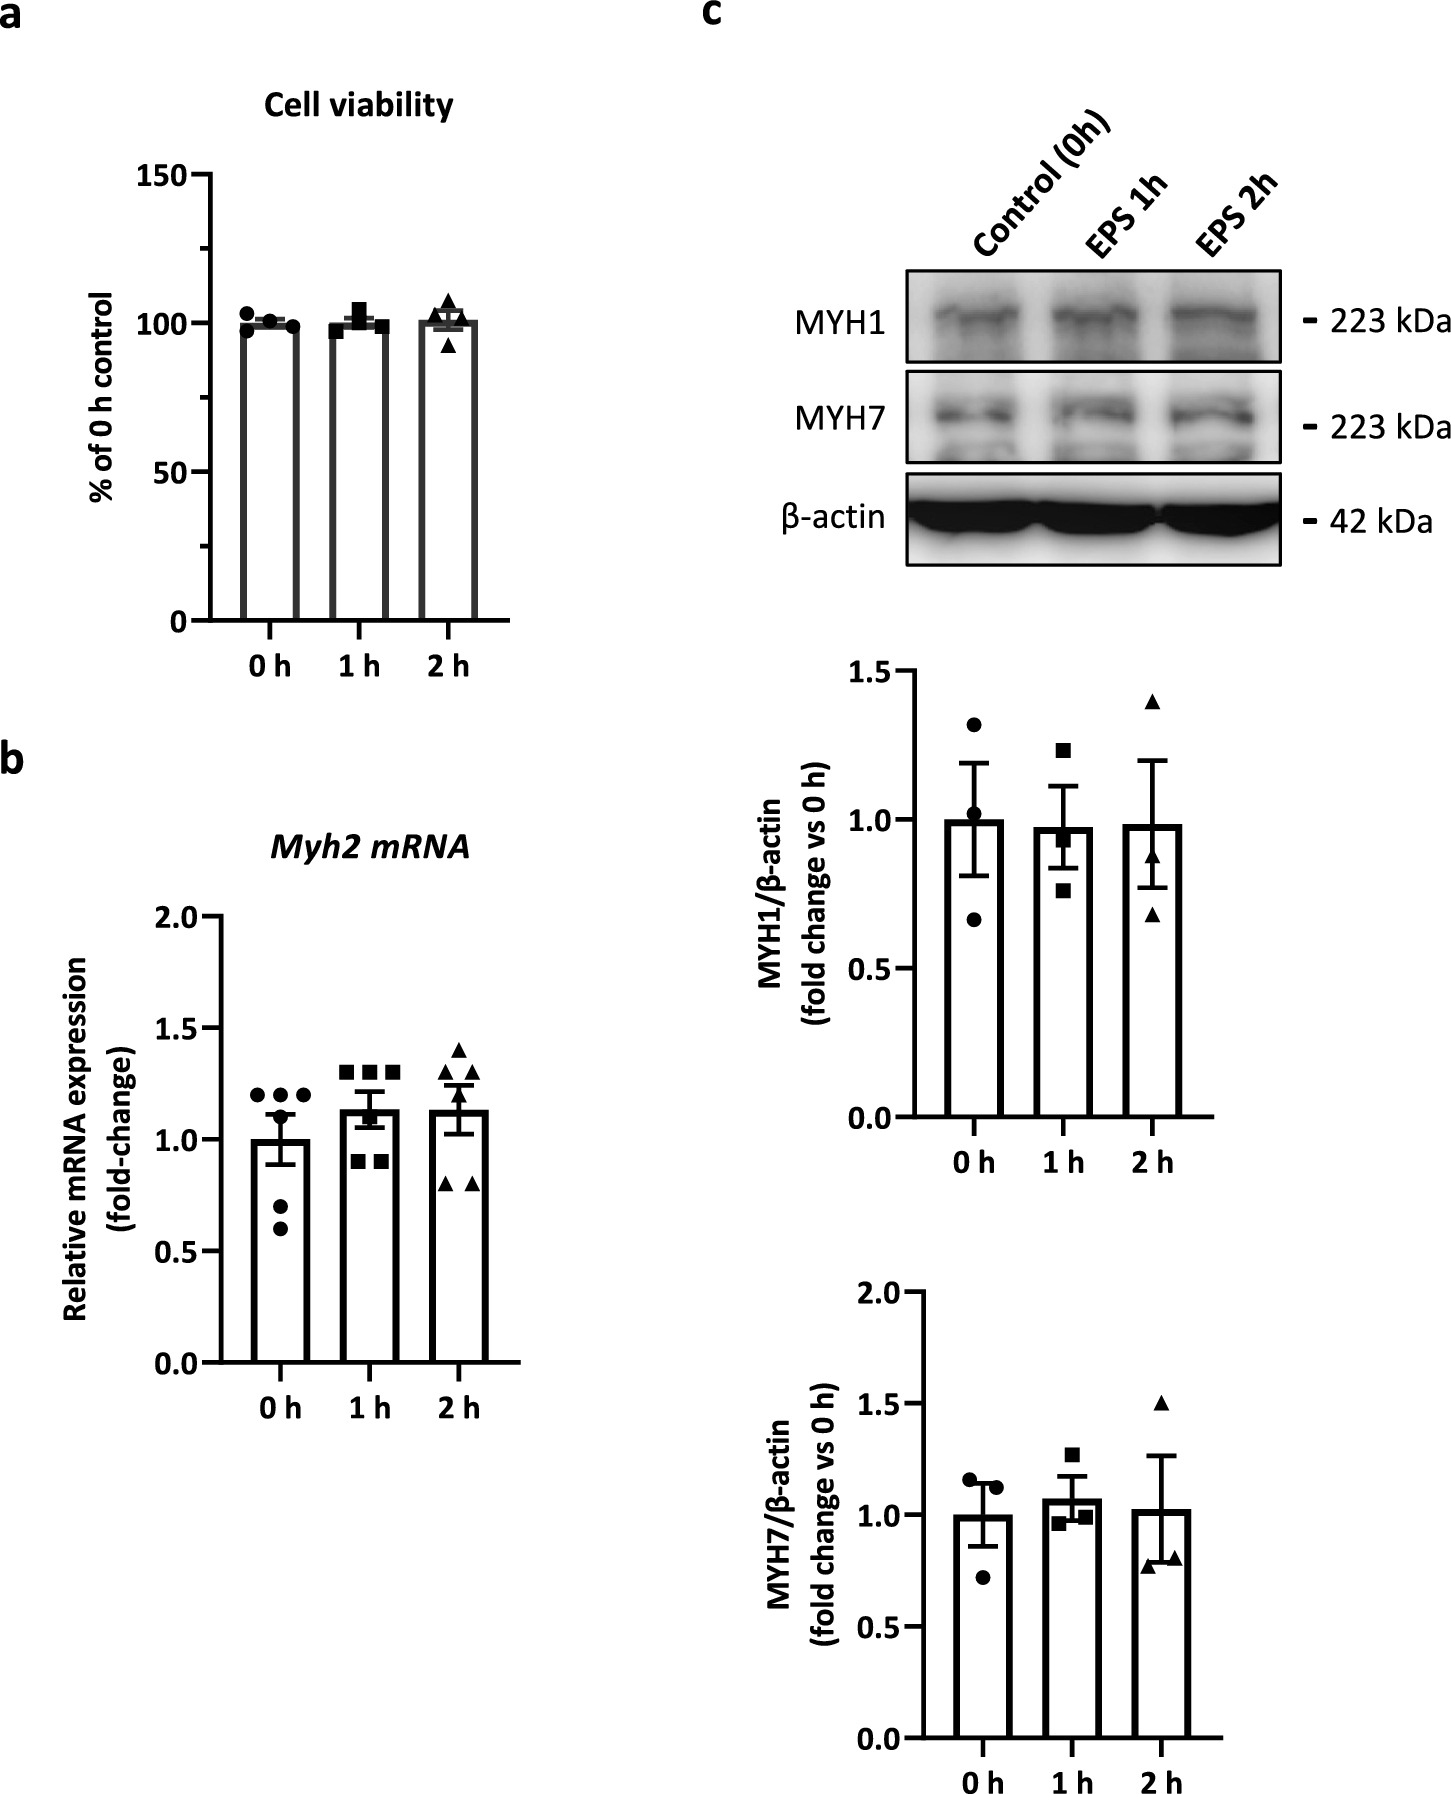
Effects of electrical pulse stimulation (EPS) on C2C12 differentiationWe evaluated also the effects of electric pulse stimulation (EPS) on C2C12 differentiation under different media conditions. After three weeks of differentiation in DMO, DMO + I, DMO + P, DMO + PI, cells were subjected to EPS for two consecutive days using either a twitch or a tetanic stimulation protocol. Protein expression of total MyHC, fast MyHC, slow MyHC, CASQ1/2, TNNT1 an TNNT3 was assessed by western blot (Fig. 5a). Protein quantification revealed that, across all media conditions and stimulation types, no significant differences in these protein levels were observed between stimulated and non-stimulated groups (Fig. 5b-g). EPS could nevertheless have benefits not reflected in myosin content. Electrically stimulated myotubes showed clear contractile activity upon stimulation, indicating the presence of functional sarcomeres and, indeed, immunofluorescence analyses for sarcomeric α-actinin at day 14 of differentiation, in absence (Fig. 5h) or presence (Fig. 5i) of EPS, showed that the electric stimulation enhances the formation and organization of mature myotubes, evidenced by more defined sarcomeric structures.
Fig. 5
The effects of electric pulse stimulation (EPS) on C2C12 differentiation. C2C12 cells were cultured in DMO, DMO + P, DMO + I, DMO + PI for 3 weeks followed by 2 days of pulse stimulation. (a) Representative western blots for myosin heavy chain, fast-myosin F59, slow-myosin BA-D5, calsequestrin 1/2, troponin T1 and troponin T3. Protein quantifications on the total stain for (b) myosin heavy chain, (c) fast-myosin F59, (d) slow-myosin BA-D5, (e) calsequestrin 1/2, (f) troponin T1, (g) troponin T3. Graph shows mean ± SD of six wells from two replicate experiments. Immunofluorescence for the Z-disc marker α-actinin-2 without (h) and with (i) stimulation after 14 days of differentiation
Transcriptomic analysisTo investigate transcriptional changes associated with C2C12 myogenic differentiation, RNA sequencing (RNA-seq) was performed on cells collected at four key time points: day 0 (undifferentiated myoblasts), and after 3, 7, and 16 days of differentiation (Supplementary Table S2). A two-dimensional Principal Component Analysis (PCA) revealed distinct clustering of samples based on differentiation stage (Fig. 6a). Specifically, samples at day 0 and day 16 showed the greatest separation along Principal Component 1 (PC1), representing the most significant source of transcriptional variance. In contrast, samples at days 3 and 7 were distinguished primarily along Principal Component 2 (PC2), suggesting a transitional gene expression profile during early and mid-differentiation stages.
Fig. 6
RNAseq of C2C12 cells at 3, 7 and 16 days of differentiation. a) Principal component analysis (PCA) shows clustering by length of differentiation and a gradual switch from day 0 to day 16 of differentiation, which is supported by clustering in b). c) The number of genes found to be statistically significantly changed in the various comparisons. d) Volcano plots representing differentially expressed genes at day 3 and e) at day 16 associated with the identified GO terms. f) Treemap charts illustrate significant GO-BP terms associated with differential splicing events at day 3 and g) day 16 of differentiation. Each rectangular shape represents individual terms, and their sizes vary according to the number of genes present in them. All the rectangles have a unique color signifying the distinct BP terms
The sample-to-sample correlation heatmap based on global gene expression profiles illustrates the reproducibility and stage-specific clustering of biological replicates throughout C2C12 differentiation (Fig. 6b). Day 0 samples (M1–M6) clustered tightly, reflecting their shared proliferative myoblast profile. Intermediate samples (day 3 and 7; M7–M22) showed moderate correlation, indicative of a transitional gene expression state. In contrast, day 16 samples (M31–M34) formed a separate cluster with reduced similarity to early stages, consistent with terminal differentiation into myotubes.
For differential expression analysis, pairwise comparisons were conducted using day 0 as the reference. Comparisons were made with day 3, day 7, and day 16. These analyses identified: 4,482 differentially expressed genes (DEGs) between day 0 and day 3 (group 1), including 2,306 upregulated and 2,176 downregulated genes; 6,083 DEGs between day 0 and day 7 (group 2), with 3,135 upregulated and 2,948 downregulated genes, 7,084 DEGs between day 0 and day 16 (group 3), comprising 3,737 upregulated and 3,347 downregulated genes (Fig. 6c).
To characterize the functional significance of the observed transcriptional changes, Gene Ontology (GO) enrichment analysis was performed on the upregulated and downregulated gene sets from groups 1 and 3, representing early and late stages of differentiation, respectively.
In group 1 (day 0 vs. day 3), upregulated genes were enriched in BPs associated with skeletal muscle differentiation and maturation, including muscle contraction, sarcomere organization, striated muscle contraction, skeletal muscle contraction, and skeletal muscle fiber development. Correspondingly, enriched CCs included the Z disc, M band, sarcolemma, sarcomere, and troponin complex. MFs reflected this structural specialization, highlighting structural constituents of muscle, actin binding, titin binding, and extracellular matrix interaction. Conversely, downregulated genes in group 1 were enriched in pathways associated with proliferative and biosynthetic activity, such as translation, DNA replication, cell cycle progression, and ribosome biogenesis (Table 1).
Table 1 GO enrichment of the down regulated (upper) and up-regulated (lower) genes after 3 days of differentiation. The top 5 biological processes (BP), cellular components (CC), and molecular functions (MF) are represented. In each functional category, terms are ranked according to their adjusted p-valuesIn group 3 (day 0 vs. day 16), the enrichment of GO terms among upregulated genes was consistent with further maturation of the myotube phenotype, reinforcing the trends observed at earlier stages. Downregulated genes showed significant enrichment in biological processes such as mitotic cell cycle, mRNA splicing, DNA replication, and rRNA processing. Enriched cellular components included the nucleoplasm, nucleolus, cytosol, spliceosome, and centrosome, while molecular functions included RNA binding and ribosomal activity, indicative of reduced proliferative capacity and transcriptional reprogramming during terminal differentiation (Table 2). Volcano plots highlight key differentially expressed genes (DEGs) associated with the enriched GO terms at days 3 and 16 of differentiation (Fig. 6d–e).
Table 2 GO enrichment of the down regulated (upper) and up-regulated (lower) genes after 16 days of differentiation. The top 5 biological processes (BP), cellular components (CC), and molecular functions (MF) are represented. In each functional category, terms are ranked according to their adjusted p-valuesTo further validate the transcriptional changes observed during myogenic differentiation, the expression of key marker genes was analysed individually. Box plots of Titin (Ttn), Myosin heavy chain 1 (Myh1), Myosin heavy chain 2 (Myh2), and Myogenin (Myog) confirmed their progressive upregulation over time (Supplementary Figure S3), with the highest expression levels observed at later stages of differentiation (day 7 and 16). These genes encode structural components or regulators of terminal myogenesis, and their temporal expression patterns are consistent with the formation and maturation of functional myotubes.
Differential splicing analysisAnalysis of alternative splicing revealed extensive transcriptome remodelling during differentiation. Between day 0 and day 3, 6,718 genes exhibited 23,052 alternative splicing events. Comparisons of day 0 vs. day 16 identified 6,156 genes with 20,524 events, respectively. To interpret the functional impact of these events, GO enrichment analysis was performed, and after redundancy reduction, 4,823 non-redundant terms were found for group 1 and 4,536 for group 3. The treemap visualization highlights the broad functional categories represented at day 3 (Fig. 6f) and day 16 (Fig. 6g). At day 3, enriched terms were dominated by processes related to cell cycle regulation, DNA metabolic processes, catabolic pathways, intracellular signal transduction, and cellular response to stress. At day 16, the enriched BP categories shifted toward functions associated with protein metabolic processes, cellular localization, organelle organization, and multicellular organism development.
The CC-GO (Supplementary Figure S4a-b) and the MF-GO (Supplementary Figure S4c-d) terms suggest that alternative splicing impacts nuclear remodelling together with regulatory and enzymatic functions.
Comments (0)