
Remember me
To reveal the transcriptome and epigenome signatures of RS, we employed time series analysis of mouse skin fibroblasts with RNA-seq, RRBS and ATAC-seq at 4 different passage numbers (P1, P3, P5 and P7) (Fig. 1A). We examined senescence markers in P7 cells, including EdU staining, nuclear morphology and SA-β-Gal activity, and confirmed that cells entered into replicative senescence at P7 (Fig. S1A–C). Global gene expression profiles generated using principal component analysis (PCA) of the RNA-seq data demonstrated significant transcriptome changes with passaging (Fig. 1B). To further explore differentially expressed genes during senescence, 3,266 significantly changed genes compared with P1 were selected and clustered into 6 modules using unsupervised methods (Figs. 1C and S1D).
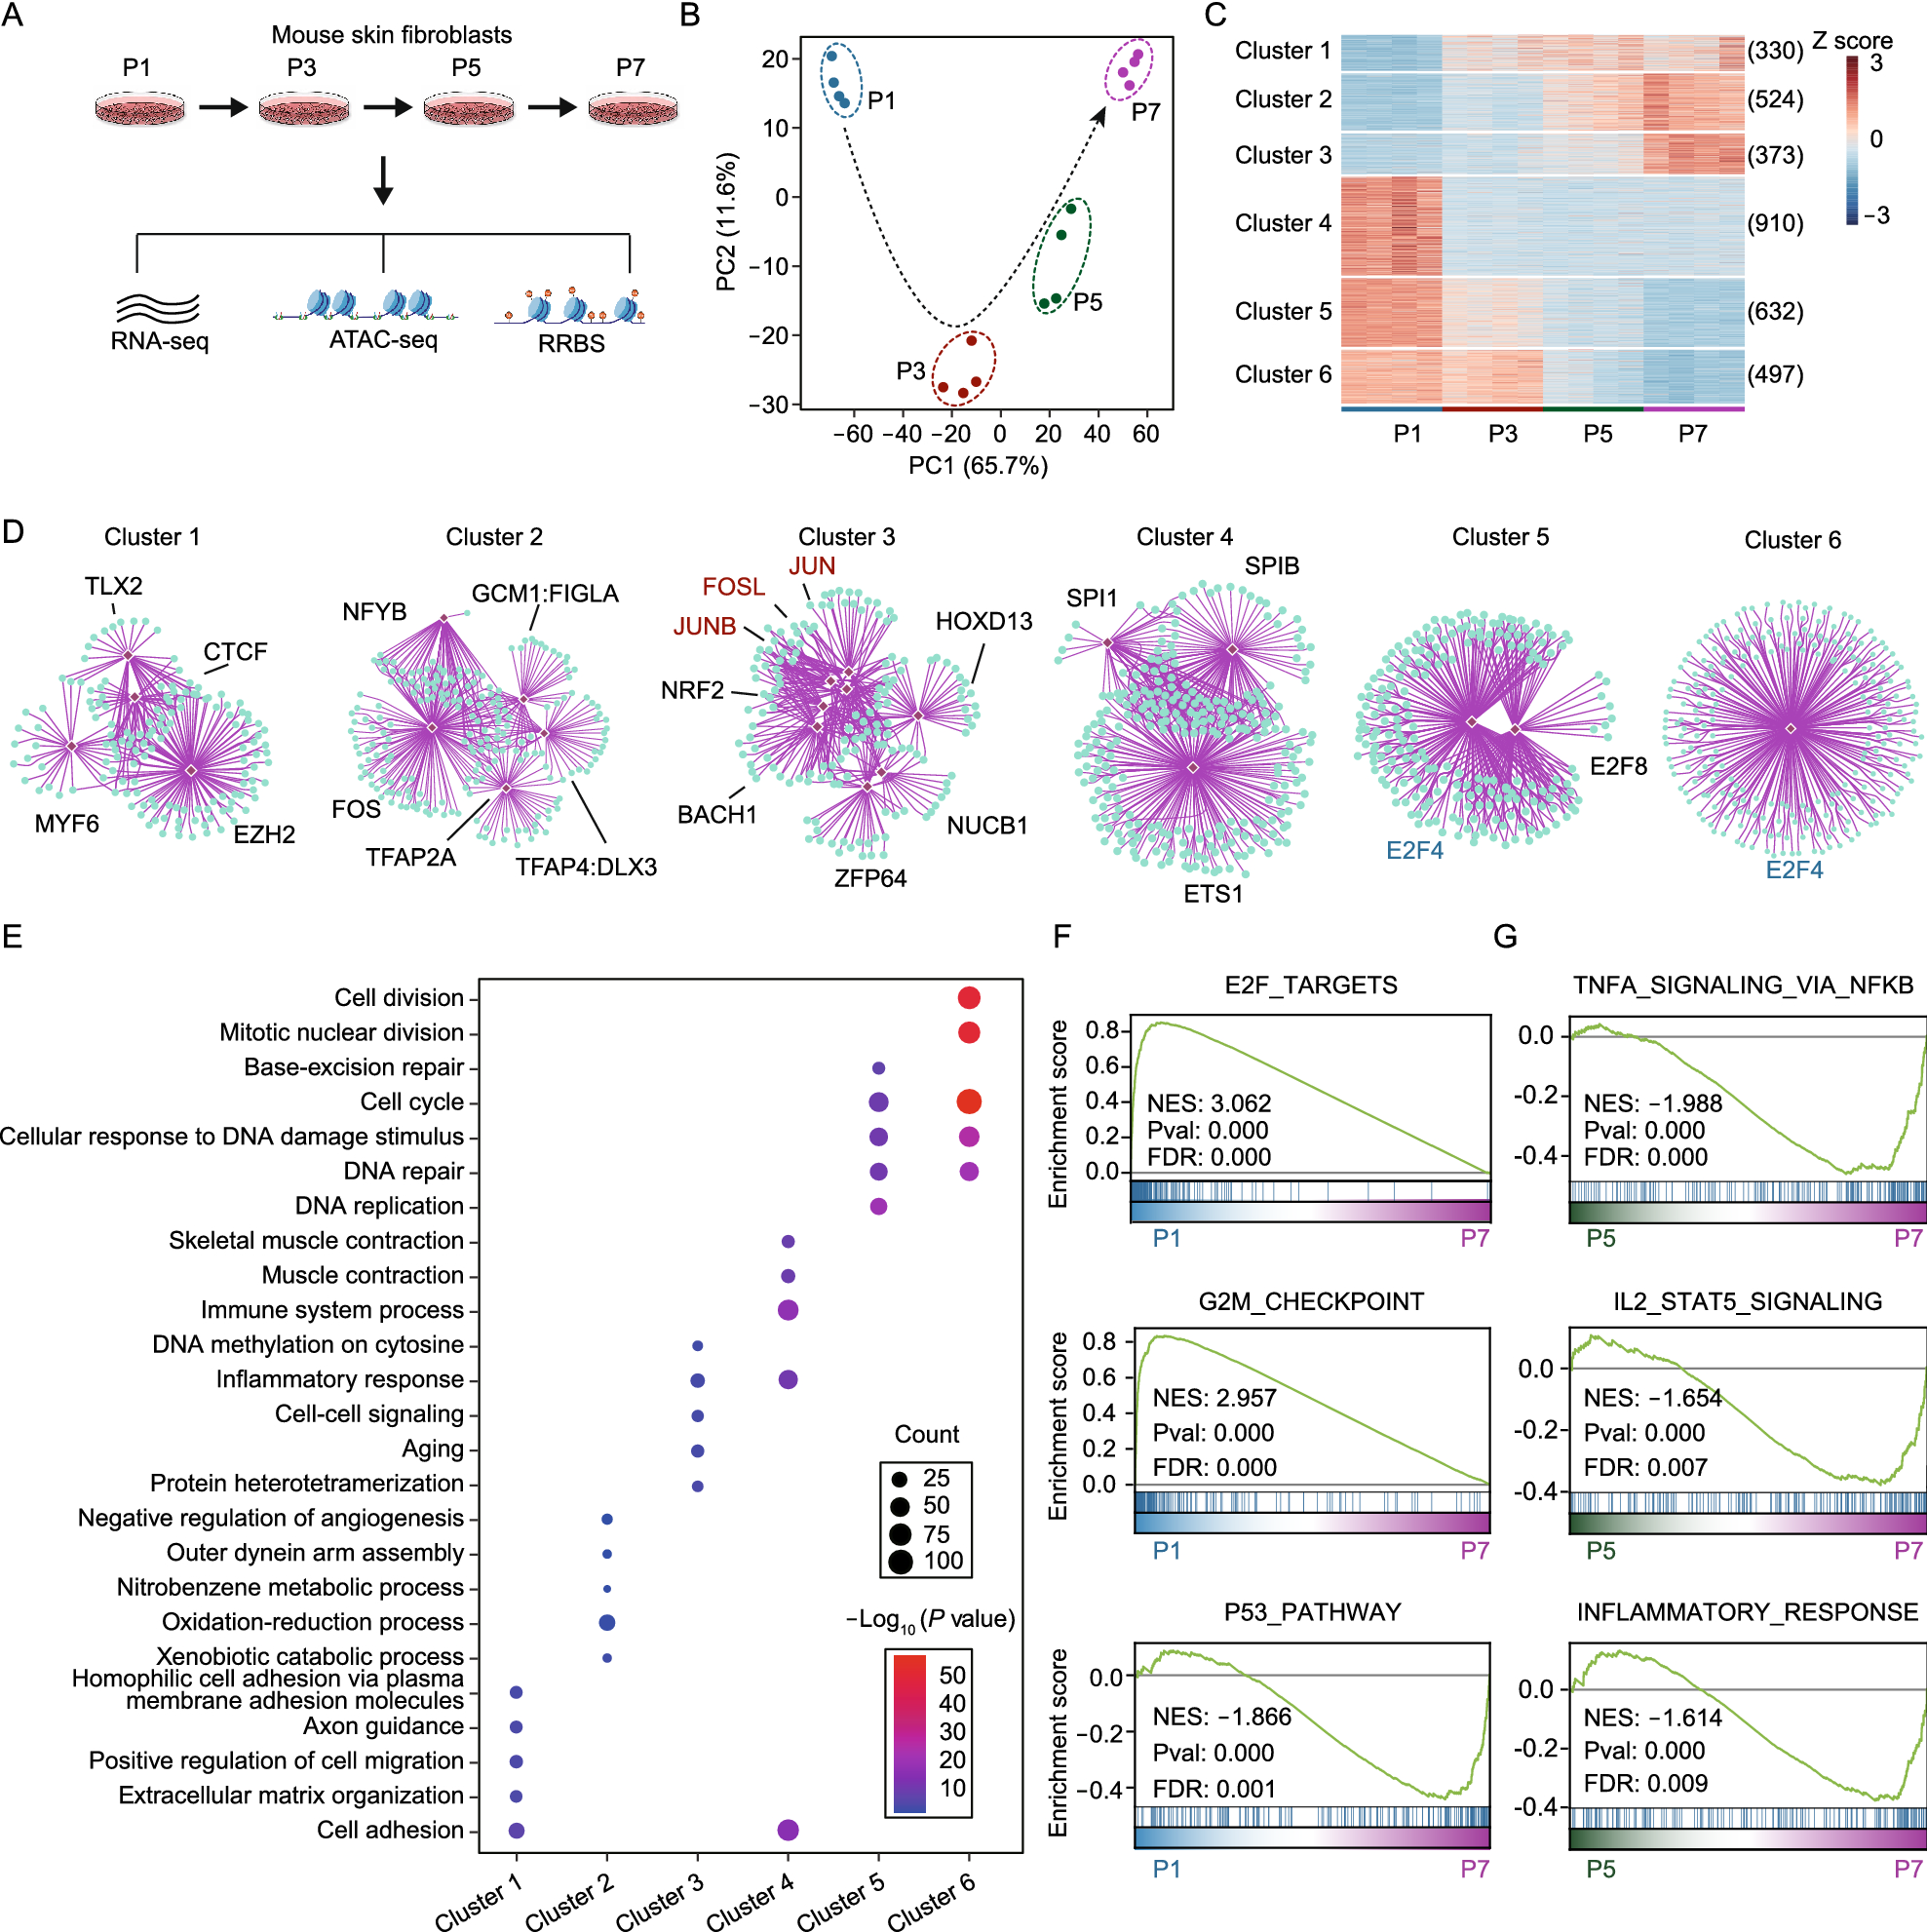
Figure 1
Transcriptional signatures and regulators of replicative senescence. (A) Schematic outlining the design of multi-omics analysis of cellular replicative senescence. Skin fibroblasts from 2-month-old mice were used, and samples were collected at P1, P3, P5 and P7 for RNA-seq, ATAC-seq and RRBS. (B) PCA of the transcriptome of skin fibroblast during RS. P1 (blue), P3 (dark red), P5 (dark green) and P7 (purple), (n = 4). (C) Heatmap showing 6 major modules of differentially expressed genes during RS. Genes that differentially expressed in any group when compared with P1 are shown (adjusted P-value < 0.05 and fold change > 2). The number of genes within each cluster is given in parentheses, (n = 4). (D) Transcription factor enrichment analysis based on the genes from each cluster. Only the top significantly enriched TFs are shown. AP-1 family TFs and E2F4 are highlighted. The analysis was performed with RcisTarget. (E) Selected biological process GO terms enriched in each gene cluster, with the top 5 most significantly enriched terms shown. The size of each point represents the gene count in the GO term, and the color of each point represents the significance of the enrichment. (F) GSEA showing cell cycle-related terms based on the transcriptome of P1 versus P7, (n = 4). (G) GSEA showing inflammatory response-related terms based on the transcriptome of P5 versus P7, (n = 4)
Next, we identified potential regulatory TFs based on genes from different clusters with RcisTarget (See METHODS). Interestingly, we found that genes from cluster 3, which showed elevated expression at late senescence, were enriched with AP-1 family TFs, including JUNB, JUN and FOSL (Fig. 1D). AP-1 family TFs have been reported to play a role in the inflammatory response (Uluçkan et al., 2015; Ji et al., 2019). In contrast, genes from cluster 5 and cluster 6, whose expression gradually decreased with passaging, were enriched with E2F4 (Fig. 1D), a TF related to cell cycle regulation (Garneau et al., 2009; Hsu et al., 2019). Subsequently, we employed Gene Ontology (GO) analysis based on genes from different clusters to examine changes in biological functions during RS. In line with the TF enrichment analysis, we found that genes from cluster 3 were significantly enriched with inflammatory response and aging process-related terms. In contrast, genes from cluster 5 and cluster 6 were enriched with cell cycle-related terms (Fig. 1E).
To confirm the transcriptome signatures of RS, we employed gene set enrichment analysis (GSEA). Consistent with the GO analysis, we found that cell cycle-related pathways like G2M checkpoint and E2F targets, were significantly down-regulated with passaging. In contrast, aging-associated pathways, like P53, were up-regulated in senescent cells (Fig. 1F). Remarkably, we also found inflammation related pathways, like TNF-α signaling, IL-2 and inflammatory response, were significantly up-regulated at late senescence (Fig. 1G). In line with transcriptional analysis, SASP in culture supernatant was found to increase dramatically when cells entered into senescence (Fig. S1E), as previously reported (Coppé et al., 2008).
Collectively, these results demonstrated that RS was accompanied by significant transcriptome changes. The main characteristics of RS were an enhanced inflammatory response at late senescence and a gradual decline in replicative capacity.
Time-resolved DNA methylome profiling to reveal RS-associated epigenetic signatures in mouse skin fibroblastsThe epigenome plays an important role in transcriptome regulation and cell fate determination. Although some senescence-associated epigenetic signatures have been documented and used as markers of senescence, a systematic analysis of chromatin accessibility and DNA methylation changes during RS has not been performed. To study changes in DNA methylome during RS, we employed time-series RRBS analysis. PCA analysis based on RRBS showed significant changes in DNA methylation with RS (Fig. 2A). Although no obvious change in distribution of DNA methylation across the entire genome was observed, DNA methylation at TFs binding sites (TFBSs) gradually increased with passaging (Figs. S2A and 2B), suggesting decreased chromatin accessibility at TFBSs and reduced TF binding activity with RS.
Figure 2
RS-associated DNA methylome signatures in mouse skin fibroblasts. (A) Unsupervised PCA of RRBS in skin fibroblasts during RS. P1 (blue), P3 (dark red), P5 (dark green) and P7 (purple), (n = 3). (B) Violin plot summarizing the distribution of DNA methylation levels of the transcription factor binding sites (TFBS) of each group. TFBS were identified by ATAC-seq. The DNA methylation level of each TFBS was estimated by averaging the methylation level of all cytosines within that TFBS. (C) Heatmap showing 6 major modules of the dynamic average methylation levels of DMRs. The number of DMRs within each modules is given in parentheses. The color indicates the average of the DNA methylation levels of all included DMRs in each module, (n = 3). (D) Box plot summarizing the distribution and dynamics of the DNA methylation levels of DMRs in module 2, module 6, module 1 and module 5, (n = 3). (E) Biological process GO term enrichment analysis based on genes related to the DMR modules, with the top 5 significantly enriched terms shown. The DMR-related genes were identified when the DMRs were located within ±5 kb around the transcription start site (TSS). (F) Ranking of motifs enriched in senescence-associated DMRs from cluster 1, cluster 5, cluster 2 and cluster 6. The colors of the points represent different TF families. The data were analyzed by one-way ANOVA (B). The error bars show the SD (D)
Next, we identified differentially methylated regions (DMRs) with passaging using DSS (Feng et al., 2014) and divided them into 6 clusters with unsupervised methods (Fig. 2C). Among these DMRs, the hypomethylated (cluster 2 and 6) and hypermethylated (cluster 1 and 5) DMRs with monotonically changed DNA methylation were identified as RS-associated DMRs (Fig. 2D). To identify which biological processes were influenced by RS-associated DMRs, we performed GO analysis based on genes related to RS-associated DMRs. For RS-associated up DMRs (cluster 1 and 5), the most enriched GO terms included transcription regulation and development-related biological processes. In contrast, for RS-associated down DMRs (cluster 2 and 6), the most enriched GO terms included metabolic process and immune system process (Fig. 2E), consistent with transcriptional analysis.
In addition, we also identified RS-associated differentially methylated sites (DMSs), which monotonically changed with passaging in three independent series of samples (See METHODS). In total, 77 DMSs were identified, including 38 up DMSs and 39 down DMSs (Fig. S2B). Next, we performed genomic annotation of RS-associated DMSs using HOMER. Most of RS-associated up DMSs were located at genetic related regions, like introns, exons and promoters. However, down DMSs were mainly located at intergenic regions (Fig. S2C). These results suggested that promoters and gene bodies become increasingly methylated with senescence. In line with the analysis of RS-associated down regulated genes, GO analysis based on genes related to up DMSs indicated that development-related biological processes were deactivated with RS (Fig. S2D).
Through integrative analysis of DNA methylation and chromatin accessibility, we found a significant negative correlation between DNA methylation and chromosome accessibility (Fig. S2E and S2F). Changes in DNA methylation may affect chromatin accessibility, which could influence TF binding in further. To explore the TFs affected by methylome changes with RS, we performed motif analysis based on RS-associated DMRs using HOMER (See METHODS). For RS-associated up DMRs, the most enriched motifs were from bHLH, Runt and ETS families, including ETV4, ELK4 and ERG. For RS-associated down DMRs, the most enriched motifs were from bZIP and Homeobox families, including NFY, PIT1 and AP-1, suggesting that activation of these TFs occurred during RS (Fig. 2F).
Taken together, the results of our analysis demonstrated significant methylome changes and continuously increased DNA methylation of TFBSs with passaging. Consistent with the transcriptome analysis, RS-associated DMRs and DMSs were found to be related to metabolic processes, immune processes and development, which highlighted the consistency of the transcriptome changes and methylome changes during RS.
Chromatin accessibility dynamics regulate RS-associated transcriptional signaturesTo reveal the chromatin accessibility dynamics of RS, we performed time-resolved ATAC-seq during passaging. PCA analysis and sample correlation analysis based on the ATAC-seq data showed significant changes in chromatin accessibility with passaging (Figs. 3A and S3A). Elevated expression of transposable elements was observed in senescence (Colombo et al., 2018; De Cecco et al., 2019; Potocki et al., 2019), suggesting increased instability of the genome. However, in our analysis, no obvious change in chromatin accessibility was observed across the entire genome with passaging. Nevertheless, for peaks with higher coverage (mean value > 800), decreased chromatin accessibility was observed with RS (Fig. 3B), which was consistent with other recent studies (Wang et al., 2018; Hernando-Herraez et al., 2019).
Figure 3
Chromatin accessibility dynamics of replicative senescence in mouse skin fibroblasts. (A) PCA of chromatin accessibility detected with ATAC-seq in skin fibroblasts during RS. P1 (blue), P3 (dark red), P5 (dark green) and P7 (purple), (n = 4 for P1 and n = 3 for P3, P5 and P7). (B) MA plot of senescent cells (P7) and proliferating cells (P1) showing the log2 ratios of peak accessibility versus the mean normalized read count for all atlas peaks. For peaks with a mean signal greater than 800, the numbers of peaks with open (red) and closed (blue) chromatin accessibility were calculated. (C) Heatmap showing 10 major modules of dynamic accessibility of peaks during RS. The number of peaks within each module is given in parentheses (n = 4 for P1 and n = 3 for P3, P5 and P7). (D) Cumulative distribution showing the chromatin accessibility differences between peaks related to RS-associated up-regulated genes and down-regulated genes (P7 vs P1). Peaks associated with up-regulated genes had greater accessibility when compared with all genes (P = 2.76 × 10⁻²⁶). Peaks associated with down-regulated genes had lower accessibility when compared with all genes (P = 2.37 × 10−73). (E) Biological process GO term enrichment analysis based on genes related to peaks in selected modules, with only the top 5 significantly enriched terms shown. The color of each point represents the significance of the enrichment. (F and G) Browser showing chromatin accessibility changes during RS. Browser representation of normalized ATAC-seq coverage around TSS of cell cycle regulators, including Cdkn2a, Cdkn1a and Mcm6 (F) and inflammatory response-related genes, including Ccl12, C1qa and H2-Eb1 (G). The grey bars highlighted aging-associated peaks in promoter regions. Data were analyzed by t-test (D)
To further explore chromatin accessibility dynamics with passaging, we identified differentially changed peaks during RS and divided them into 10 modules using unsupervised methods (See METHODS). Importantly, open peaks from module 3 and module 4, and closed peaks from module 9 and module 10 showed monotonic changes with passaging, and were identified as RS-associated peaks (Fig. 3C), which were evenly distributed across the chromosomes (Fig. S3B). Peaks annotation demonstrated that RS-associated closed peaks were more likely to be located in promoter regions (10.51% and 2.05% for module 9 and module 10, respectively) in comparison with RS-associated open peaks (0.75% and 0.64% for module 3 and module 4, respectively) (Fig. S3C). Considering that RS was found to be associated with increased DNA methylation in TFBSs, these results might indicate decreased transcriptional activity with passaging.
The epigenetic state of promoter regions influences the expression of corresponding downstream genes (Qu et al., 2017; Wong et al., 2017). Through integrative analysis of ATAC-seq and RNA-seq, we found that the promoter accessibility of RS-associated up-regulated genes was significantly greater than that of RS-associated down-regulated genes (Fig. 3D). Next, we examined the biological processes influenced by RS-associated peaks through GO analysis of corresponding genes (See METHODS). In agreement with transcriptional analysis, peaks from module 3 were enriched with development, apoptotic signaling and immune system process. Peaks from module 4 were enriched with cellular senescence and protein kinase activity, whereas peaks from module 9 and 10 were enriched with cell cycle and cellular interaction-related processes (Fig. 3E). These results demonstrated that the transcriptional signatures of cellular senescence were associated with corresponding epigenetic changes. Moreover, up-regulation of the inflammatory response and down-regulation of proliferative capacity were found to be the main signatures of RS in both transcriptome and epigenome.
To confirm epigenetic changes underlying RS-associated transcriptional signatures, we visualized the promoter accessibility dynamics of selected genes with Integrative Genomics Viewer (IGV). For example, Cdkn2a (p16) and Cdkn1a (p21) are negative regulators of cell cycle, which are widely used as senescence markers. The IGV showed that the promoter accessibility of these two genes gradually increased with passaging. However, for cell cycle positive regulators, such as Mcm6, the promoter accessibility gradually decreased with passaging (Fig. 3F). In line with this, decreased promoter accessibility of most cell cycle-related genes was observed with RS (Fig. S3D and S3E). In contrast, for inflammatory response related genes, such as Ccl12, C1qa and H2-Eb1, the promoters showed increased chromatin accessibility with passaging (Fig. 3G).
Altogether, these results demonstrated that RS was accompanied by significant epigenetic changes, which could in further influence transcriptome. In addition, up-regulation of inflammatory response and down-regulation of proliferative capacity were two main signatures of RS in both transcriptome and epigenome.
Identification of replicative senescence-associated regulatory TFsTFs were involved in regulation of various biological processes (Spitz and Furlong, 2012). Thus, we speculated that the cellular senescence program could be regulated by specific TFs like other cellular processes. To identify RS-associated TFs, we firstly performed motif enrichment analysis based on RS-associated peaks using HOMER. Notably, RS-associated open peaks (module 3 and module 4) were enriched with TEA family TFs, like TEAD1 and TEAD3, which were also revealed in human senescent cells recently (Chan et al., 2021). In addition, peaks from module 3 were also found to be enriched with motifs from AP-1 family TFs (Fig. 4A), which was observed to activate in oncogene-induced senescence recently (Martínez-Zamudio et al., 2020). In RS-associated closed peaks (module 9 and module 10), motifs from EBF, LHX family TFs were significantly enriched (Fig. S4A).
Figure 4
Identification of replicative senescence-associated regulatory TFs. (A and B) Ranking of motifs enriched in senescence-associated open peaks. The colors of the points represent different TF families. (A) All open peaks from module 3 and module 4. (B) Open peaks located at enhancer regions from module 3 and module 4. (C) Transcription factor footprinting in chromatin-accessible regions based on ATAC-seq. The mean normalized ATAC-seq coverage averaging the forward and reverse strand within 100 bp upstream and downstream of the TF motif is shown. The red line represents P7, and the blue line represents P1. (D) Heatmap showing peaks appearing in closed regions during RS. Selected enriched motifs from these peaks and the corresponding levels of enrichment significance are shown. (E) Heatmap showing peaks disappearing from open regions during replicative senescence. Selected enriched motifs from these peaks and the corresponding levels of enrichment significance are shown. (F) Classification of transcription factors based on chromatin dependence (CD) and the chromatin opening index (COI). Pioneer factors (blue box, COI > 4 and CD > 0.45), settler factors (red box, COI < 4 and CD > 0.45) and migrator factors (green box, CD < 0.45) were defined, and selected top pioneer factors are shown. (G) Heatmap showing the expression dynamics of potential regulatory TFs of RS. (H) Regulatory networks showing the connections between RS-associated TFs. TFs with pink backgrounds have increased activity during senescence, and TFs with blue backgrounds have decreased activity during senescence. The thickness of the lines between TFs indicates the connectivity score
Enhancers are specific genome regions, which influence the TF binding and expression of relatively distant genes (Spitz and Furlong, 2012). Based on H3K4me1 and H3K27ac ChIP-seq data from public database GSE117210 (Guan et al., 2020), we identified enhancer regions in senescent mouse fibroblasts (See METHODS). To further explore TFs enriched in enhancers during RS, we performed motif enrichment analysis based on ATAC-seq peaks overlapped with enhancer regions. For peaks from module 3, the most enriched TF located at enhancers was P53, a negative regulator of cell cycle in various senescence models. In addition, for peaks from module 4, the top enriched TFs located at enhancers were from TEA family, including TEAD3, TEAD1 (Fig. 4B). In contrast, for RS-associated closed peaks (cluster 9 and cluster 10), the top enriched motifs located at enhancers included EBF, ETV2 and LHX3 (Fig. S4B).
The activity changes of TFs could be reflected through relative coverage around binding sites using RGT-HINT (Li et al., 2019). Through analysis, we found that AP-1 family TFs, including cJUN and JUND, and TEA family TFs, including TEAD1 and TEAD3, showed increased activity with passaging. In contrast, E2F4 showed decreased activity with senescence (Figs. 4C, S4C and S4D).
Among TFs, pioneer factors could bind to compact chromatin regions, open these regions and recruit other factors to bind around (Iwafuchi-Doi and Zaret, 2014), which may play crucial roles in regulating the senescence program. According to the characteristics of pioneer factors, we hypothesized that newly appeared peaks during RS might be due to pioneer factors binding. Based on this hypothesis, we identified newly appeared peaks during passaging and performed motif enrichment analysis. The results demonstrated that TEA family TFs were significantly enriched in newly appeared peaks from P1 to P3. In addition, the most significantly enriched TFs in newly appeared peaks at P5 and P7 were AP-1 family TFs (Fig. 4D). We also identified peaks that disappeared during RS and performed motif enrichment analysis. Consistent with the motif analysis described above, these peaks were mainly enriched with TFs from LHX, RUNX and E2F families (Fig. 4E). As reported, pioneer factors could also be identified through calculating chromatin dependence (CD) and chromatin opening index (COI) using PIQ based on ATAC-seq (Sherwood et al., 2014). In our analysis, TFs with CD greater than 0.45 and COI greater than 4 were identified as pioneer factors. Consistent with the analysis described above, AP-1, TEAD1, TEAD3, ATF3, E2F4 and E2F6 were included in identified pioneer factors of RS (Fig. 4F).
Next, we examined changes in expression levels of RS-associated TFs during senescence. Consistent with the observed changes in TF activity, AP-1 family TFs, including Atf3, Fos, Junb and Jund showed increased expression when cells entered into late senescence. TFs from TEA family, such as Tead1, showed increased expression even from the early stage of passaging. In contrast, the expression of E2F family TFs, including E2f4, decreased gradually with passaging (Fig. 4G). In addition, regulatory networks analysis of identified RS-associated TFs showed a complicated regulatory relationship between these TFs. Interestingly, P53, a widely used senescence marker, was found to be under the common regulation of AP-1 and E2F family TFs (Fig. 4H).
Taken together, several potential regulatory TFs of RS were identified by integrative analysis of transcriptome and epigenome. Among them, TFs from TEA and AP-1 family showed increased activity and expression with passaging, like TEAD1 and ATF3. In contrast, TFs from E2F family showed decreased activity and expression, like E2F4.
E2F4 affects RS-associated phenotypes as a regulatory TFE2F4 was identified as a potential regulatory TF of RS in our previous analysis (Fig. 4C and 4F), which was also enriched in RS-associated down-regulated genes (Fig. 1D). In addition, conserved change in expression of E2F4 with passaging was observed in human cells after analysis of public RNA-seq data from GSE109700 (De Cecco et al., 2019) (Fig. S5A), suggesting that the regulatory role of E2F4 in senescence may be species conserved.
To further explore the regulatory roles of E2F4 in RS, we performed an integrative analysis of RNA-seq and ATAC-seq data with DiffTF (Berest et al., 2019). E2F4 was identified as a positive regulator of downstream genes (P < 0.001) (Fig. S5B). Notably, E2F4 CUT&Tag analysis indicated that E2F4 regulated cell cycle process during senescence (Fig. S5C), highlighting regulatory roles of E2F4 in RS.
To explore the effects of E2F4 in RS, we overexpressed E2f4 using a lentivirus system in pre-senescence mouse skin fibroblasts (P4), in which E2f4 was expressed after doxycycline treatment (Fig. 5A). In this system, significantly increased E2f4 expression was observed when compared with control (Fig. 5B and 5C). Moreover, the expression level of E2f4 was correlated with the amount of lentivirus added (Fig. S5D). Interestingly, relatively higher amounts of lentivirus (MOI = 8 and MOI = 12) decreased cellular density and EdU percentage when compared with control (Fig. S5E and S5F). In comparison, cellular density and proliferative capacity were optimized with a lower MOI of 4, and this condition was used for further examination.
Figure 5
E2F4 affects replicative senescence-associated phenotypes as a regulatory TF. (A) Structures of plasmids used for EGFP-labeled E2F4 expression under doxycycline induction and corresponding control. (B) RT-qPCR showing the change in the E2f4 expression level after overexpression with lentivirus, (n = 3). (C) Immunoblot showing the change in E2F4 protein level after overexpression. (D) Change in SA-β-Gal activity after E2f4 overexpression. SA-β-Gal positive percentage was estimated based on 3 different views, and the points indicated the average value, (n = 3). Scale bar = 200 μm. (E) Scatter plot showing the nuclear size distribution after E2f4 overexpression based on nuclear staining. Nuclear size was calculated using ImageJ, (n = 3). (F) EdU staining showing the change in proliferating capacity after E2f4 overexpression. Red dots indicate EdU positive cells (white arrows), and the EdU-positive percentage was calculated with ImageJ. The positive percentage was estimated based on 5 different views, and the points indicated the average value, (n = 3). Scale bar = 200 μm. (G) GSEA showing changes in cell cycle-related terms after E2f4 overexpression based on RNA-seq. (H) Heatmap showing changes in the expression levels of cell cycle-related genes, including positive regulators (up) and negative regulators (down). P3 samples were used as proliferating cell control, (n = 2). (I) RT-qPCR detecting the change in E2f4 expression level after shRNA-mediated knockdown, (n = 3). (J) Immunoblot showing the change in E2F4 protein level after knockdown. (K) EdU staining showing the change in proliferating capacity after E2f4 knockdown. Green dots represent EdU-positive cells (white arrows), (n = 3). Scale bar = 200 μm. (L) Scatter plot showing the nuclear size distribution after E2f4 knockdown based on nuclear staining. Nuclear size was calculated using ImageJ, (n = 3). (M) Bar plot showing the changes of RS-associated pathways after E2f4 knockdown through GSEA analysis. Blue bar indicates down-regulated pathways, and red bar indicates up-regulated pathways after E2f4 knockdown, (n = 3). Data were analyzed by one-way ANOVA (I, K and L) and t-test (B, D, E and F). Error bars denote for the SD. ****P < 0.0001; ***P < 0.001; **P < 0.01; *P < 0.05
Compared with control, we found cells with E2f4 overexpression had significantly decreased SA-β-Gal activity, smaller nuclear size and increased proliferative capacity (Fig. 5D–5F). Consistent with the EdU staining results, the transcriptional analysis showed that the expression of cell cycle-related genes was significantly increased by E2f4 overexpression (Figs. 5G, 5H and S5G). In contrast, negative regulators of cell cycle, including Cdkn2a and Cdkn2b, showed decreased expression when compared with control (Fig. 5H), which highlighted the regulatory role of E2F4 in proliferation. RRBS analysis was performed to examine changes in DNA methylation after E2f4 overexpression. Notably, some RS-associated DMSs were reversed after overexpression of E2f4 (Fig. S5H).
In parallel, we also knocked down E2f4 in proliferating mouse skin fibroblasts (P3) with shRNA (Fig. 5I and 5J). Consistent with the results of E2f4 overexpression, knockdown of E2f4 significantly decreased EdU positive percentage and increased nuclear size (Fig. 5K and 5L). Transcriptome analysis after knockdown of E2f4 showed decreased expression of genes related to cell cycle regulation, and increased expression of genes related to inflammatory response and P53 pathway (Figs. 5M, S5I and S5J).
Taken together, these results indicated that overexpression of E2f4 attenuated some senescence signatures, especially RS-associated reduction of proliferative capacity. Interestingly, we also found that overexpression of E2f4 reversed some RS-associated methylation changes. These results highlighted the regulatory effects of E2F4 on RS phenotypes.
Knockdown of Tead1 and Atf3 partially attenuated senescence-associated signaturesTEAD1 was identified as a potential regulatory factor of RS in our previous analysis (Fig. 4A, 4D and 4F). To assess the role of TEAD1 in RS, we knocked down Tead1 in mouse skin fibroblasts with shRNA (Figs. 6A and 6B). Interestingly, significantly decreased nuclear size and SA-β-Gal activity were observed after knockdown of Tead1 (Fig. 6C and 6D). Transcriptome analysis after Tead1 knockdown showed that some RS-associated changes in metabolism were altered, including decreased oxidative phosphorylation and citrate cycle (Fig. 6E).
Figure 6
Knockdown of Tead1 and Atf3 partially attenuated senescence-associated signatures. (A) RT-qPCR detecting Tead1 expression after knockdown with shRNAs, (n = 3). (B) Immunoblot showing the change in TEAD1 protein level after knockdown. (C) Scatter plot showing nuclear size distribution after Tead1 knockdown based on nuclear staining. Nuclear size was calculated using ImageJ, (n = 3). (D) Change in SA-β-Gal activity after Tead1 knockdown. SA-β-Gal positive percentage was estimated based on 3 different views, and the point indicates the average value, (n = 3). Scale bar = 200 μm. (E) GSEA showing changes in RS-associated pathways related to cellular metabolism after Tead1 knockdown. The color represents normalized enrichment score compared with control, (n = 3). (F) RT-qPCR detecting the change in Atf3 expression after shRNA-mediated knockdown of Atf3, (n = 3). (G) Immunoblot showing the change in ATF3 protein level after knockdown. (H) Bar plot showing normalized expression of Cdkn2a after knockdown of Atf3, (n = 3). (I) Heatmap showing changes of selected cell cycle-related genes after knockdown of Atf3, (n = 3). (J) GSEA showing changes in selected RS-associated pathways after Atf3 knockdown. The color represents normalized enrichment score compared with control, (n = 3). (K) Model showing the changes in RS-associated signatures (up) and regulatory TFs (down). Data were analyzed by one-way ANOVA (A, C, D, F and H). Error bars denote for the SD. ****P < 0.0001; ***P < 0.001; **P < 0.01
Moreover, our analysis also identified ATF3, one member from AP-1 superfamily TFs, as a potential regulator of RS. Notably, we found more genes were regulated by ATF3 at senescent cells than proliferating cells using CUT&Tag analysis (Fig. S6A). Importantly, some typical senescence-related pathways were enriched in ATF3-regulated genes, such as the apoptosis process and cellular response to DNA damage stimulus (Fig. S6B).
To examine the role of ATF3 in RS, we knocked down Atf3 in pre-senescent mouse skin fibroblasts (Fig. 6F and 6G). Consistent with the results from a previous study (Zhang et al., 2021), we found that knockdown of Atf3 decreased Cdkn2a (p16) expression significantly (Fig. 6H). In line with this, some other negative regulators of cell cycle, including Cdkn2c and Cdkn2d, decreased expression after knockdown of Atf3. And increased expression of some cell cycle-related genes, including Cdc6 and Cdk8, was observed when compared with control (Fig. 6I). In addition, GSEA analysis showed that some activated pathways in RS, including P53 pathway, were decreased after Atf3 knockdown, and some cell cycle-related pathways, including G2M checkpoint and E2F targets, were found to increase after Atf3 knockdown (Fig. 6J).
Collectively, our results demonstrated that knockdown of Tead1 and Atf3 attenuated some senescence-associated signatures, highlighting the potential regulatory roles of TEAD1 and AP-1 in RS.
Comments (0)