
Remember me
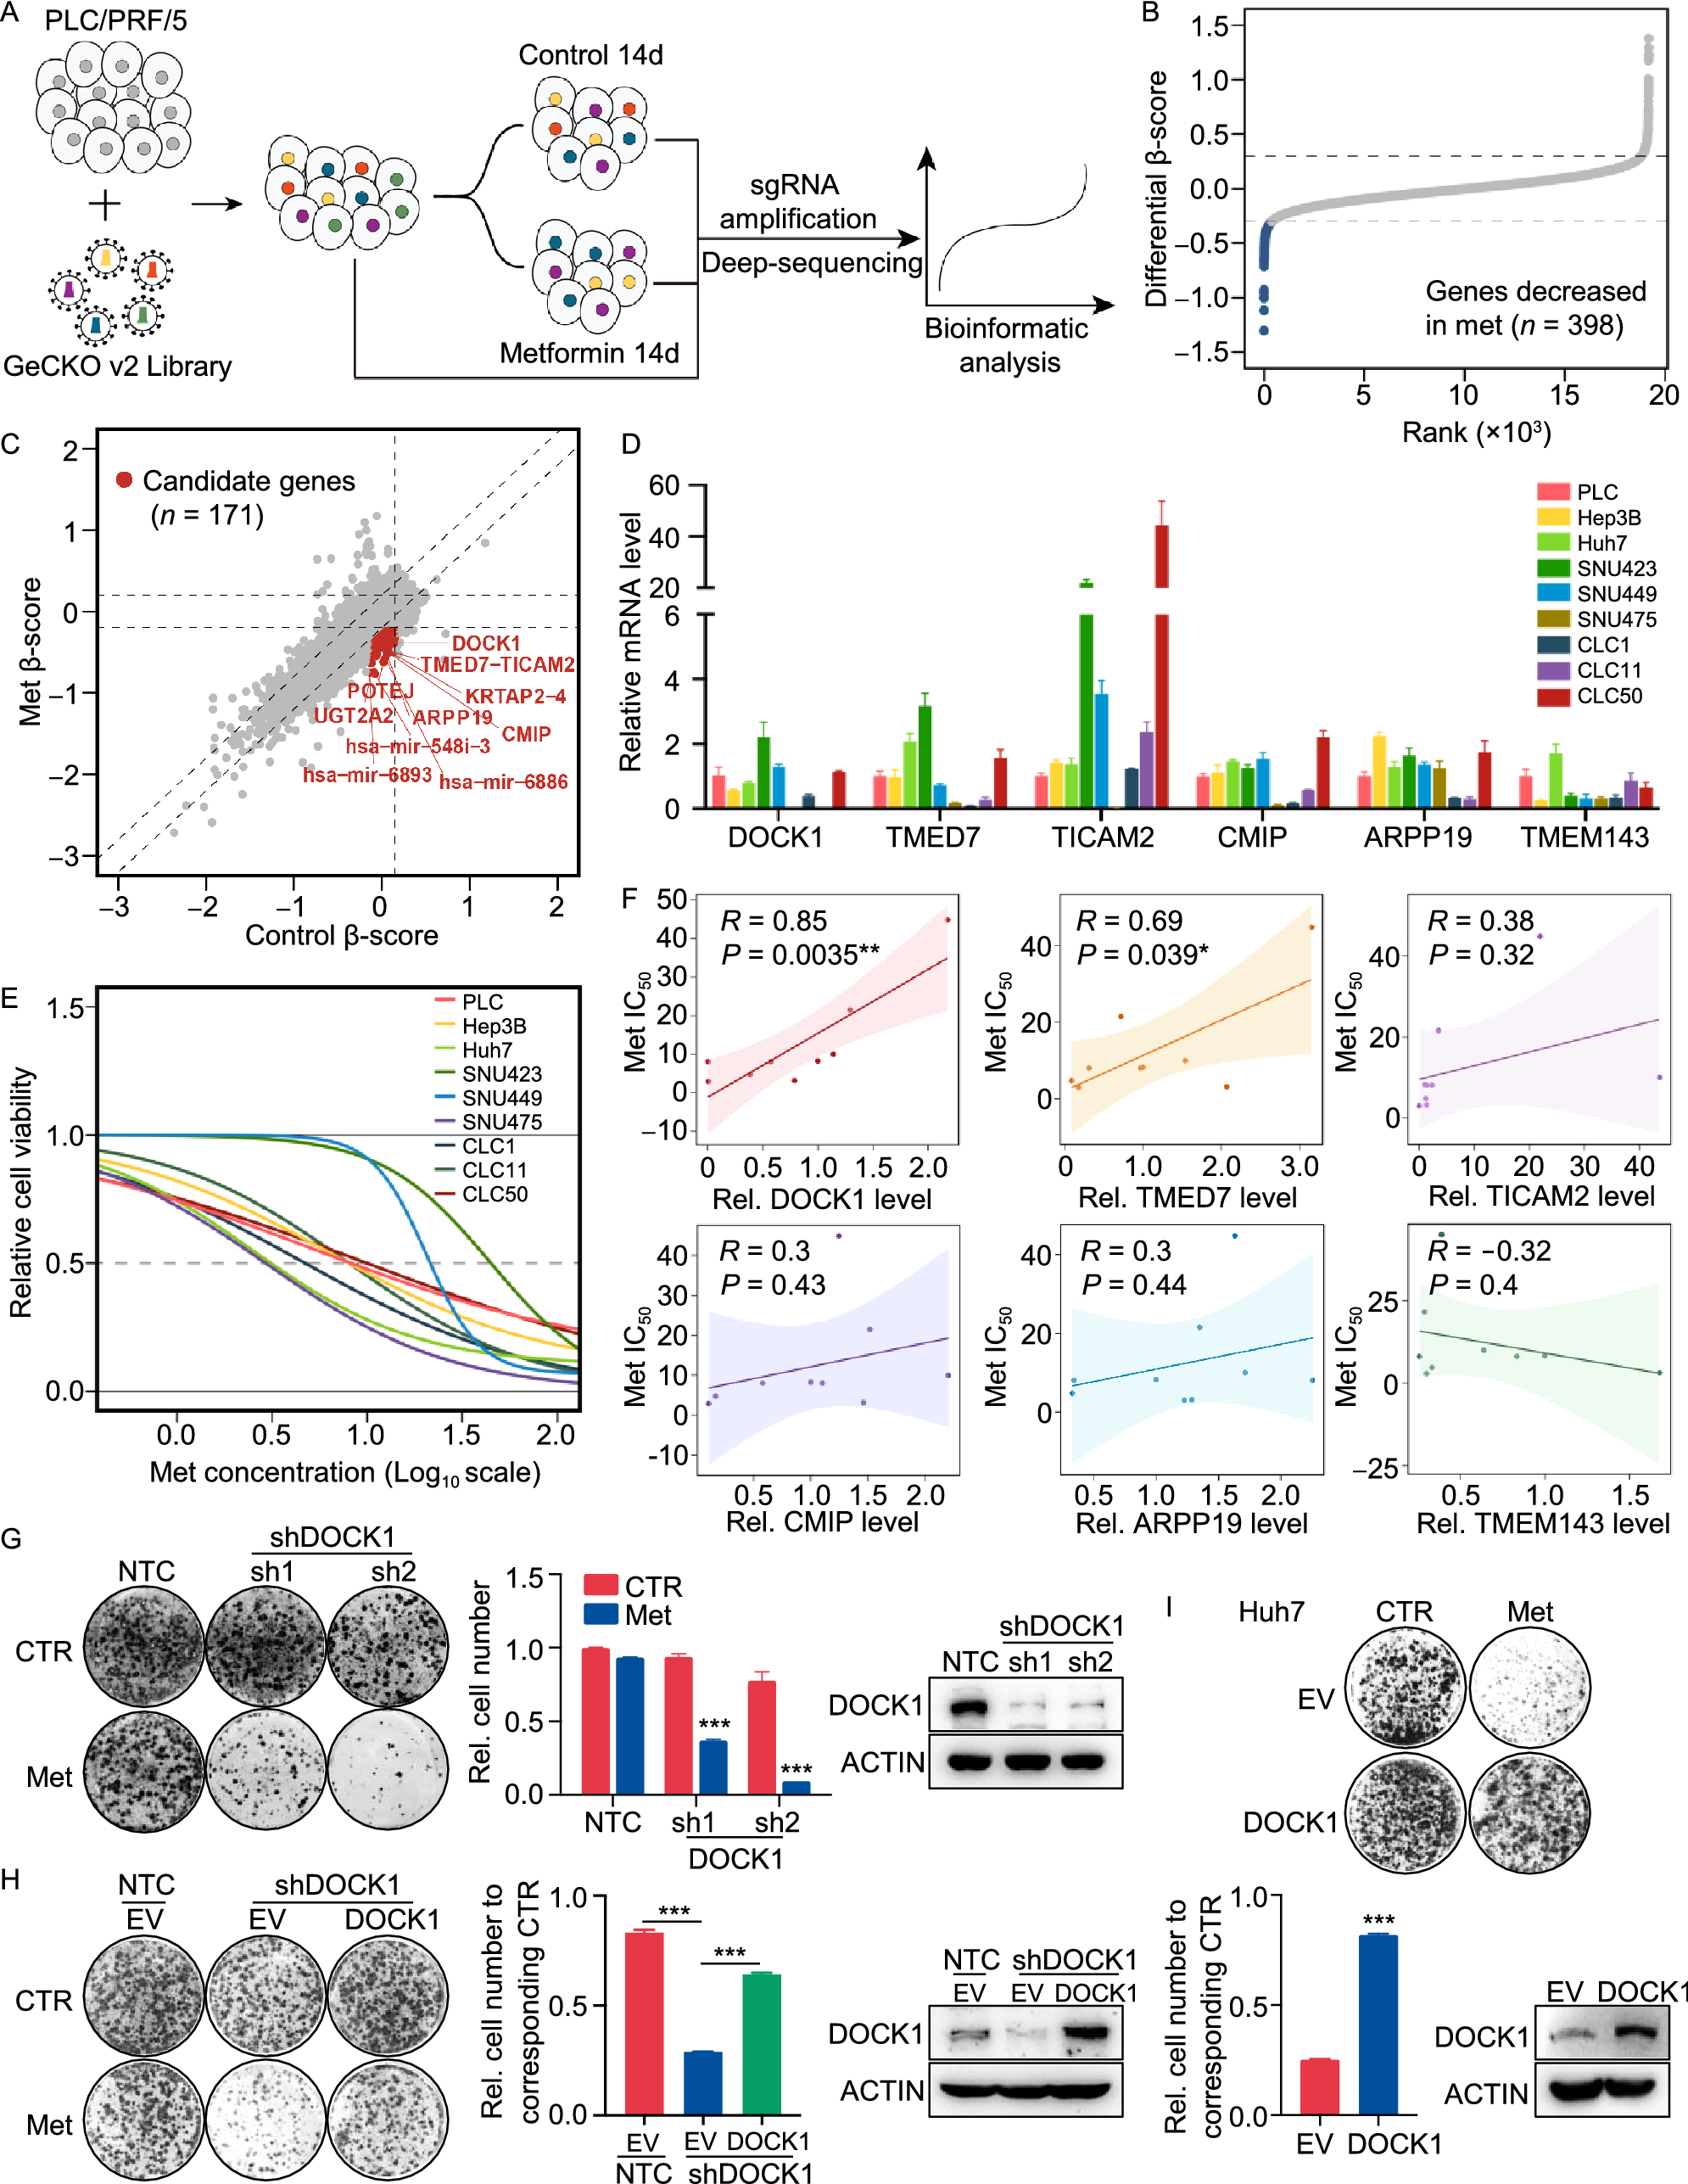
To systematically identify subtypes of liver cancer that are sensitive to metformin treatment, we employed a CRISPR-Cas9-based negative selection approach to screen for genes whose loss potentiates the anti-tumor effects of metformin. PLC/PRF/5 cells (PLC) transfected with lentivirus containing a pooled genome-scale CRISPR knockout library (GeCKO v2) were cultured in the presence or absence of metformin. Following a two-week incubation, genomic DNA was isolated and high throughput sequencing was used to determine the abundance of guide RNA prior to further analysis by MAGeCKFlute (Fig. 1A). The results indicated that most genes, as well as non-targeting control sgRNAs, showed similar scores between the control and metformin treatment groups (Fig. S1A). However, 398 genes were significantly decreased in the metformin-treated group (differential beta-score < −0.3) (Fig. 1B). To identify which of these genes potentially sensitized the PLC cells to metformin but exhibited no obvious growth impairment in the untreated cells, we narrowed the candidates using the additional criteria of a beta-score variation in the control group of no more than 0.15 (−0.15 < Control beta-score < 0.15). Following this criterion, 171 of the 398 genes were identified as candidates (Fig. 1C), and we subsequently focused on the top 15 most depleted genes (Fig. S1B), ultimately selecting six of these for further analysis.
Figure 1
CRISPR-Cas9 library screening identifies DOCK1 as a determinant for metformin sensitivity. (A) Schematic of the synthetic lethal screen. (B) Distribution of differential beta-score (metformin treatment versus control) for genes. Blue dots indicate genes decreased in metformin-treated group (n = 398). (C) Scatter plot of beta-score in control and metformin-treated group. Red dots represent genes decreased only in metformin-treated group (n = 171). Top 10 genes are selected based on the differential beta-score and labelled. (D) qPCR analysis of the mRNA expression of six candidate genes in nine liver cancer cell lines. (E) IC50 curves of metformin in nine liver cancer cell lines. (F) Correlation between gene expression and metformin IC50. Each data point represents a liver cancer cell line. The solid line was fit from linear regression. The shading represents the confidence interval. (G) and (H) Colony formation assay were performed in the indicated PLC cell lines with or without 1 mmol/L metformin treatment (Left). Cell number were quantified (Middle). DOCK1 levels were determined by Western blot (Right). (I) Colony formation assay in the indicated Huh7 cell lines with or without 2 mmol/L metformin treatment (Top). Cell number were quantified and DOCK1 levels were determined by Western blot (Bottom). For (D), (G), (H), (I), data are presented as mean ± SD
Next, to verify the screening results, we quantified the mRNA expression of these six candidates, and also determined the half-maximal inhibitory concentrations (IC50) values of metformin in nine kinds of liver cancer cells (Fig. 1D and 1E). Correlation analysis revealed that DOCK1 expression had the highest Pearson correlation coefficient with IC50 values and AUC scores of metformin (Figs. 1F and S1C), which suggested that DOCK1 levels may contribute to determining the sensitivity of liver cancer cells to metformin. Colony formation experiments confirmed the differences in response to metformin by the nine kinds of liver cancer cells (Fig. S1D). Given the high differential beta-score and its strong correlation with metformin response, we focused on DOCK1 for further investigation.
Analysis of the guide RNA revealed that all of six sgRNAs targeting DOCK1 had lower abundance in metformin-treated cells (Fig. S1E). Consistent with these results, DOCK1 knockdown resulted in substantial sensitization of PLC cells in both long-term colony formation assays and in IC50 detection to analyze short-term cell viability (Figs. 1G and S1F). Similar results were observed in SNU449 cells (Fig. S1G). Notably, ectopically expressed DOCK1 attenuated shDOCK1-induced metformin sensitivity in PLC cells (Fig. 1H). Further, overexpression of DOCK1 eliminated the anti-tumor effects of metformin in Huh7 cells (Fig. 1I). Taken together, these results indicated that DOCK1 expression levels determine the sensitivity of liver cancer cells to metformin.
Inhibition of DOCK1 sensitizes liver cancer cells to metformin in vivo and in vitroTo further characterize the role of DOCK1 in determining metformin sensitivity in pre-clinical models, we established four patient-derived HCC organoids (i.e., 1T, 2T, 3T, and 4T) for further in vitro analyses. Histological analysis confirmed that these HCC organoids retained the histological features of the original tumors (Fig. S2A). Further immunohistochemical staining revealed consistent expression of DOCK1 in all four organoids and their corresponding tumor tissues (Fig. 2A). Both immunohistochemical staining and Western blot showed that organoids 1T and 2T exhibited significantly higher DOCK1 expression than that of 3T and 4T (Fig. 2A and 2B).
Figure 2
Inhibition of DOCK1 sensitizes liver cancer cells to metformin in vivo and in vitro. (A) Representative images of DOCK1 in HCC tissues and organoids by immunohistochemical staining. Scale bar, 50 µm. (B) Western blot analysis of DOCK1 expression in four HCC organoids. (C) Representative micrographs of organoids treated with indicated dose of metformin for 6 days. Scale bar, 100 µm. (D) IC50 curves of metformin in four HCC organoids. (E) Western blot analysis of DOCK1 expression in Organoid 1T and 2T stably expressing NTC or shDOCK1. (F) IC50 curves of metformin in Organoid 1T and 2T stably expressing NTC or shDOCK1. (G) Organoid 1T and 2T stably expressing NTC or shDOCK1 were treated with or without metformin (2 mmol/L for Organoid 1T and 2.5 mmol/L for Organoid 2T) for 6 days. Representative micrographs (Top) and relative cell viability (Bottom) were analyzed. Scale bar, 100 µm. (H) Plasmids expressing YAP5SA-NTC or YAP5SA-shDOCK1 together with plasmids expressing PB transposase were delivered into mice by hydrodynamic injection following with or without 100 mg/kg metformin treatment (n = 6 in each group). Tumor images, Liver-to-body ratio, number of tumors, and number of tumors (diameter > 3 mm) were measured at the end of the experiment. (I) Western blot analysis of DOCK1 and YAP1 expression in tumor tissues of each group described in Fig. 2H. (J and K) PLC xenografts were treated with or without 100 mg/kg metformin (n = 5 for each group). Tumor sizes (J) and DOCK1 expression (K) were measured. For (D), (F), and (G), data are presented as mean ± SD. For (H) and (J), data are presented as mean ± SEM
To investigate the response to metformin by HCC organoids, we treated the four organoids with increasing doses of metformin. Interestingly, organoids 3T and 4T showed a greater decrease in organoid number and size under metformin treatment than 1T and 2T (Fig. 2C), indicating higher sensitivity, which was confirmed by lower IC50 values for 3T and 4T (Fig. 2D). To study whether DOCK1 expression indeed determines metformin sensitivity in patient-derived organoids, we knocked down DOCK1 by shRNAs in organoids 1T and 2T. Consistent with our observation in PLC cells, DOCK1 knockdown induced metformin sensitivity in these patient-derived HCC organoids (Fig. 2E–G). Moreover, immunofluorescence staining of Ki67 revealed that metformin strongly inhibited the proliferation of HCC organoid 2T under DOCK1 knockdown (Fig. S2B). Taken together, these results documented that the DOCK1 expression levels contribute to determining the metformin sensitivity of patient-derived HCC organoids.
To investigate whether these in vitro findings could be recapitulated in vivo, we employed a YAP5SA-induced HCC model (Guo et al. 2017). To establish this model, plasmids expressing YAP5SA and shDOCK1 (or non-targeting control, NTC) in a single transposon were injected into mice by hydrodynamic injection. Following one month of growth, a low dose of metformin (100 mg/kg) was orally administered to these mice daily for three months. In the NTC group, no effects on tumor growth were observed following the low dose of metformin, whereas the incidence of liver cancer significantly decreased and tumor growth was suppressed by this metformin dose in the shDOCK1 group (Fig. 2H). Consistent with these results, Ki67 immunohistochemical staining revealed that metformin treatment markedly inhibited the proliferation of HCC tumors expressing shDOCK1 (Fig. S2C). Western blot analysis confirmed the overexpression of YAP1 and knockdown of DOCK1 in tumor tissues (Fig. 2I). In addition, mouse xenograft experiments using PLC cells with DOCK1 knockdown showed that suppression of DOCK1 resulted in potentiation of the anti-tumor effects of metformin (Figs. 2J, 2K, and S2D). Collectively, these results indicated that DOCK1 levels regulate the strength of metformin’s anti-tumor effects on liver cancer, while suppression of DOCK1 sensitizes liver cancer to metformin in both patient-derived HCC organoids in vitro and mouse models in vivo.
RAC1 activation contributes to DOCK1-mediated cancer cell insensitivity to metforminTo explore how DOCK1 deficiency enhances the anti-tumor effects of metformin, we performed RNA-seq analysis in PLC cells expressing NTC or shDOCK1 (PLC-NTC, PLC-shDOCK1 cells) in the presence or absence of metformin. We found that the expression of 935 genes was altered by metformin in NTC cells, some of which were further affected by DOCK1 suppression (Fig. 3A). To comprehensively interpret the role of DOCK1 in metformin-mediated cancer inhibition, we analyzed three sets of genes, including the metformin-upregulated genes in NTC cells, and genes that were down-regulated by shDOCK1 in the presence or absence of metformin relative to metformin-treated NTC cells. Interestingly, we observed substantial overlap in function among these three sets of genes (Fig. 3B). Further Gene Ontology (GO) and pathway enrichment analysis revealed 18 GO terms or pathways that were shared in common by all three groups (Fig. 3C). Notably, among the 18 GO terms, four terms were related to small GTPase activity (Fig. 3D), which suggested that the pathway for small GTPase activity may be involved in DOCK1 suppression induced sensitization of cancer cells to metformin.
Figure 3
RAC1 activation via DOCK1 phosphorylation contributes to metformin insensitivity in cancer cells. (A) Heatmap of RNA-seq analysis, colors indicate the z-scored normalized counts. (B) The Circos plot shows the overlap of genes in three groups. Purple lines link the same gene that are shared by multiple groups, blue lines link the different genes where they fall into the same ontology term. NTC + Met Up: NTC + Met/NTC > 1.5; shDOCK1 Down: shDOCK1/NTC + Met < 0.5; shDOCK1 + Met Down: shDOCK1 + Met/NTC + Met < 0.5. (C) Venn diagram shows the overlap of GO terms enriched in each group. (D) Heatmap of 18 GO terms overlapped in Fig. 3C. (E) Western blot analysis of DOCK1, RAC1 expression and RAC1-GTP level in PLC cells treated with 0 mmol/L, 1 mmol/L, 2 mmol/L, and 5 mmol/L metformin for 48 h. (F) PLC-NTC and PLC-shDOCK1 cells were further cultured with or without 2 mmol/L metformin for 48 h, followed by Western blot analysis of DOCK1, RAC1 expression and RAC1-GTP level. (G) Western blot analysis of DOCK1, RAC1 expression and RAC1-GTP level in the indicated PLC cell lines. (H) Colony formation assay in the indicated PLC cell lines with or without 1 mmol/L metformin treatment (Left). Cell number were quantified (Right). (I) PLC cells stably expressing Flag-DOCK1 were treated with or without 2 mmol/L metformin for 48 h, followed by immunoprecipitation using anti-Flag or IgG antibody. Pan-phospho-tyrosine were analyzed by Western blot. (J) PLC cells stably expressing Flag-EV, Flag-DOCK1, Flag-DOCK1Y722/1811F were treated with or without 2 mmol/L metformin for 48 h, followed by immunoprecipitation using anti-Flag antibody. Pan-phospho-tyrosine were analyzed by Western blot. (K) PLC cells stably expressing shRNA targeting the 3′UTR of DOCK1 were further infected with viruses expressing Flag-DOCK1 or Flag-DOCK1Y722/1811F . Cells were treated with or without 2 mmol/L metformin for 48 h. DOCK1, RAC1 expression and RAC1-GTP level were analyzed by Western blot. (L) Colony formation assay in the indicated PLC cell lines with or without 1 mmol/L metformin treatment (Left). Cell number were quantified (Right). Data are presented as mean ± SD
Considering that DOCK1 is a canonical guanine nucleotide exchange factor (GEF) for RAC family small GTPases which can promote the activation of RAC (Kiyokawa et al. 1998; Brugnera et al. 2002), we focused on the RAC family small GTPase signal transduction pathway. Similar to other GTPases, RAC is active when bound to GTP and inactive when bound to GDP. Indeed, our data showed that knockdown of DOCK1 markedly reduced the level of RAC1-GTP, i.e., the active form of RAC1 (Fig. S3A). Since RAC1 has been shown to play a major role in cytoskeleton assembly, tumorigenesis and tumor proliferation, we thus hypothesized that DOCK1 deficiency sensitizes cancer cells to metformin via inhibition of RAC1 activation.
Western blots suggested that metformin treatment led to the activation of RAC1 in PLC cells, indicated by increased levels of RAC1-GTP in the presence of metformin (Fig. 3E). Moreover, metformin-mediated RAC1 activation was eliminated in DOCK1 knockdown cells, which suggested that DOCK1 was necessary for RAC1 activation by metformin (Fig. 3F). Previous studies have demonstrated that the DOCK homology region-2 (DHR2) domain of DOCK1 directly interacts with nucleotide-free RAC to induce GTP loading of RAC, thereby promoting its activation. Thus, deletion of the DHR2 domain induces loss of function in DOCK1 (Côté and Vuori 2002). To further clarify whether shDOCK1 sensitized cancer cells to metformin via its canonical GEF function, we ectopically expressed DOCK1 carrying a DHR2 domain deletion (DOCK1△DHR2) in PLC cells with endogenous DOCK1 knockdown. Our data showed that DOCK1△DHR2 had no effect on metformin sensitivity by cancer cells (Fig. S3B), which demonstrated that the GEF function is required by DOCK1 to mediate metformin sensitivity.
To further test whether RAC1 activation was essential for shDOCK1-mediated metformin sensitization, we overexpressed either wild-type RAC1 or a RAC1G12V mutant, a constitutively active form of RAC1 (Xu et al. 1994), in PLC-shDOCK1 cells (Fig. 3G). Colony formation assays revealed that RAC1G12V expression partially attenuated the enhanced metformin sensitivity in PLC-shDOCK1 cells, whereas wild-type RAC1 showed only negligible effects in PLC-shDOCK1 cells (Figs. 3H, and S3C), which indicated that RAC1 activation contributes to shDOCK1-mediated metformin sensitization for cancer cells.
Subsequent quantitative real-time PCR (qPCR) and Western blot analyses showed that metformin exhibited no effects on either the RNA or protein expression of DOCK1 (Figs. 3E and S3D). However, our results showed that metformin treatment resulted in enhanced phosphorylation of DOCK1 at tyrosine residues (Fig. 3I), which has been reported to increase its GEF activity (Feng et al. 2011, 2012). In order to identify which specific DOCK1 tyrosine residue(s) were phosphorylated during exposure to metformin, we constructed a DOCK1Y722F/Y1811F plasmid harboring Y722F and Y1811F double mutants. Western blot showed that metformin-induced phosphorylation of tyrosine was markedly reduced in the DOCK1Y722F/Y1811F variant compared to that in wild-type DOCK1 (Fig. 3J), which suggested that DOCK1 Y722 and Y1811 residues are indeed the phosphorylation sites regulated by metformin. Similar results were obtained using these constructs in 293T cells (Fig. S3E).
Moreover, we ectopically expressed wild-type DOCK1 or DOCK1Y722F/Y1811F in PLC-shDOCK1 cells. Western blot showed that metformin treatment promoted the activation of RAC1 in cells expressing wild-type DOCK1, but not in cells expressing the DOCK1Y722F/Y1811F mutant, thus demonstrating that RAC1 activation by metformin requires phosphorylation of DOCK1 at the Y722 and Y1811 residues (Fig. 3K). It is noteworthy that co-expression of the DOCK1Y722F/Y1811F mutant also failed to attenuate shDOCK1-induced sensitization of cancer cells to metformin treatment (Figs. 3L and S3F). Taken together, these results demonstrated that metformin functions in the phosphorylation of DOCK1, resulting in the activation of RAC1, and consequently, deficiency of DOCK1 sensitizes cancer cells to metformin.
Synergistic effects of TBOPP and metformin both in vivo and in vitro1-(2-(30-(trifluoromethyl)-[1,10-biphenyl]-4-yl)-2-oxoethyl)-5-pyrrolidinylsulfonyl-2(1H)-pyridone (TBOPP) has recently been identified as a selective inhibitor of DOCK1 (Tajiri et al. 2017). To explore the therapeutic potential of targeting the DOCK1-RAC1 axis, we tested the effects of TBOPP on metformin toxicity in cancer cells. Our results indicated that TBOPP significantly inhibited RAC1 activation at doses of 0.75 µmol/L or 1 µmol/L, but showed no effect on PLC cell viability (Fig. S4A and S4B). However, when PLC cells were given a combined treatment of 1 mmol/L metformin with 0.75 µmol/L or 1 µmol/L TBOPP, we observed a strong synergistic effect in reducing cell viability (Fig. 4A). Similar results were observed in SNU449 and Hep3B cells (Fig. S4C). Western blot detection of RAC1-GTP revealed that metformin-induced RAC1 activation was attenuated by TBOPP in PLC cells (Fig. 4B). Subsequently, we detected IC50 values of 8.95 µmol/L and 31.08 µmol/L in response to TBOPP treatment in organoids 1T and 2T, respectively (Fig. S4D). We therefore used 1.5 µmol/L and 7.5 µmol/L TBOPP in combination with metformin for treatment of organoids 1T and 2T, respectively. The results showed that metformin or TBOPP alone only slightly inhibited growth and proliferation of patient-derived HCC organoids, while their combined treatment significantly decreased cell viability in both HCC organoids (Fig. 4C), suggesting that a potent, synergistic lethality accompanied the combination of metformin and TBOPP.
Figure 4
Synergistic effects of TBOPP and metformin both in vivo and in vitro. (A) Synergistic response to the combination of TBOPP and metformin in PLC cells (Left). Cell number were quantified (Right). (B) Western blot analysis of DOCK1, RAC1 expression and RAC1-GTP level in PLC cells with indicated treatment for 48 h. (C) Organoid 1T and 2T were treated with DMSO, metformin (2 mmol/L for Organoid 1T and 2.5 mmol/L for Organoid 2T), TBOPP (1.5 µmol/L for Organoid 1T and 7.5 µmol/L for Organoid 2T) or combined therapy for 6 days. Representative micrographs (Left), and relative cell viability (Right) were analyzed. Scale bar, 100 µm. (D) and (E) PLC xenografts were treated with 100 mg/kg metformin (p.o., daily), 8 mg/kg TBOPP (i.v., twice a week) or a combined therapy (n = 6 for each group). Tumor sizes and images were measured (D). The expression of DOCK1, RAC1 and the level of RAC1-GTP of each group were analyzed by Western blot (E). (F) Plasmids expressing NRASG12V, shP53 together with plasmids expressing SB transposase were delivered into mice by hydrodynamic injection (n = 5 in each group). Metformin and TBOPP was administered to mice as indicated (Left). Tumor images, liver-to-body ratio, number of tumors, and number of tumors (diameter > 3 mm) were measured at the end of the experiment. (G) Representative Ki67 staining (Left) and quantified data (Right) in tumor tissues described in Fig. 4F. Scale bar, 50 µm. (H) Western blot analysis of DOCK1, RAC1 expression and RAC1-GTP level in tumor tissues described in Fig. 4F. For (A) and (C), data are presented as mean ± SD. For (D), (F) and (G), data are presented as mean ± SEM
We next performed mouse xenograft experiments using PLC cells. Xenograft-bearing mice were treated with 8 mg/kg or 16 mg/kg TBOPP by intravenous injection twice a week, and the results showed that 8 mg/kg of TBOPP inhibited the activation of RAC1 but exhibited only modest suppression of tumor growth and mouse body weight (Fig. S4E–H). Thus, we selected an 8 mg/kg TBOPP dose in subsequent experiments to explore its combined effects with metformin. Notably, 8 mg/kg TBOPP with 100 mg/kg metformin significantly suppressed PLC xenograft tumor growth without affecting mouse body weight, and further confirming the anti-tumor synergism between TBOPP and metformin (Figs. 4D and S4I). Western blot analysis of tumor tissue lysates revealed that TBOPP treatment obviously suppressed the metformin-induced RAC1 activation (Fig. 4E), which confirmed that RAC1 activation contributes to the DOCK1 suppression associated sensitization of cancer cells to metformin in vivo.
To further corroborate the synergistic effect between TBOPP and metformin, we employed an NRASG12V/shP53-induced orthotopic HCC model (Carlson et al. 2005; Wiesner et al. 2009). Similar to our observations in the PLC xenograft models, metformin or TBOPP monotherapy provided only modest tumor inhibition, while the combination treatment resulted in strong tumor inhibition in the NRASG12V/shP53-induced mouse HCC model (Fig. 4F). We used Ki67 staining to further confirm the differences between treatments in tumor proliferation (Fig. 4G), and Western blot showed that TBOPP abolished metformin-mediated RAC1 activation in the NRASG12V/shP53-induced orthotopic HCC model (Fig. 4H). Collectively, our data demonstrated that treatment with TBOPP, a DOCK1 inhibitor, results in a strong synergistic effect with metformin in suppressing liver cancer in several models both in vitro and in vivo.
DOCK1 levels determine the anti-tumor activity of metformin in liver cancer patientsFinally, we sought to determine whether DOCK1 expression levels could serve as a potential biomarker for evaluating the therapeutic effectiveness of metformin in liver cancer patients by retrospective evaluation of 122 clinical HCC patients with diabetes. These patients were classified into a metformin-use group and other anti-diabetic drug-use group. Kaplan–Meier analysis showed that there was no difference in overall survival between metformin-use diabetic HCC patients and the other drug-use group (Fig. S5A). Subsequently, we performed immunohistochemical staining for visualization and quantification of DOCK1 expression and classified patients into DOCK1Low (n = 66) and DOCK1High (n = 56) categories based on mean DOCK1 intensity. Interestingly, metformin appeared to significantly improve the overall survival of the DOCK1Low patients (Fig. 5A), while in contrast, metformin treatment was associated with poor prognosis in DOCK1High patients (Fig. 5B). These results indicated that metformin has apparently inverse therapeutic effects in patients depending on whether DOCK1 levels are relatively low or high. Further analysis of the metformin-use diabetic HCC patients revealed that patients with low DOCK1 levels had better overall survival rates (Fig. 5C). Moreover, Ki67 staining in samples from metformin-treated diabetic HCC patients revealed that DOCK1Low patients exhibited a lower proportion of Ki67-positive cells compared to that in the DOCK1High group (Fig. 5D). Cumulatively, these data demonstrated that DOCK1 levels determine the anti-tumor effectiveness of metformin in HCC patients.
Figure 5
DOCK1 levels determine the anti-tumor activity of metformin in liver cancer patients. (A and B) Kaplan-Meier curves with univariate analyses for patients with metformin treatment versus other drugs treatment in DOCK1Low (A) or DOCK1High (B) diabetic HCC cohort. P values were calculated by Breslow (generalized Wilcoxon) test. (C) Kaplan-Meier curves with univariate analyses for DOCK1Low patients versus DOCK1High patients in metformin treated diabetic HCC cohort. P values were calculated by Breslow (generalized Wilcoxon) test. (D) Representative images (Left), and quantified data (Right) of Ki67 in metformin used diabetic HCC patients by immunohistochemical staining. Scale bar, 50 µm. (E) Representative images (Top), and quantified data (Bottom) of DOCK1 in HCC patients by immunohistochemical staining. (F) and (G) Western blot and qPCR analysis of DOCK1 expression in 28 pairs of clinically matched tumor-adjacent noncancerous liver tissues (N) and HCC tissues (T). Calnexin served as a loading control. Data are presented as mean ± SEM
To test this possibility, we next investigated DOCK1 expression levels in HCC patients. Quantitative analysis of DOCK1 immunohistochemistry staining in HCC specimens indicated that DOCK1 was upregulated in tumor tissues compared to that in adjacent normal tissue (Fig. 5E). Consistent with this finding, qPCR and Western blot analyses showed that both RNA and protein levels of DOCK1 were elevated in HCC tissues compared to those in matched adjacent non-cancerous liver tissues (Fig. 5F and 5G). We observed similar results in the GSE124535 RNA-seq dataset generated with 35 pairs of tumor and non-tumor HCC samples (Jiang et al., 2019) (Fig. S5B). Relative expression analysis of DOCK1 in liver cancer samples from The Cancer Genome Atlas (TCGA) showed the same results (Fig. S5C).
The high DOCK1 expression suggests the likelihood of poor metformin performance in HCC patients. It warrants mention that although DOCK1 expression is widely upregulated in HCC patients, tumor heterogeneity still results in differential accumulation of DOCK1 among HCC samples, with some patients exhibiting very low, even undetectable, levels of DOCK1 (Fig. 5F). This finding further suggests that a personalized precision medicine approach should be strongly considered for HCC patients based on their specific DOCK1 levels. Collectively, these data suggest that DOCK1 is upregulated in HCC, and its degree of upregulation can determine the anti-tumor effectiveness of metformin.
Comments (0)