
Remember me
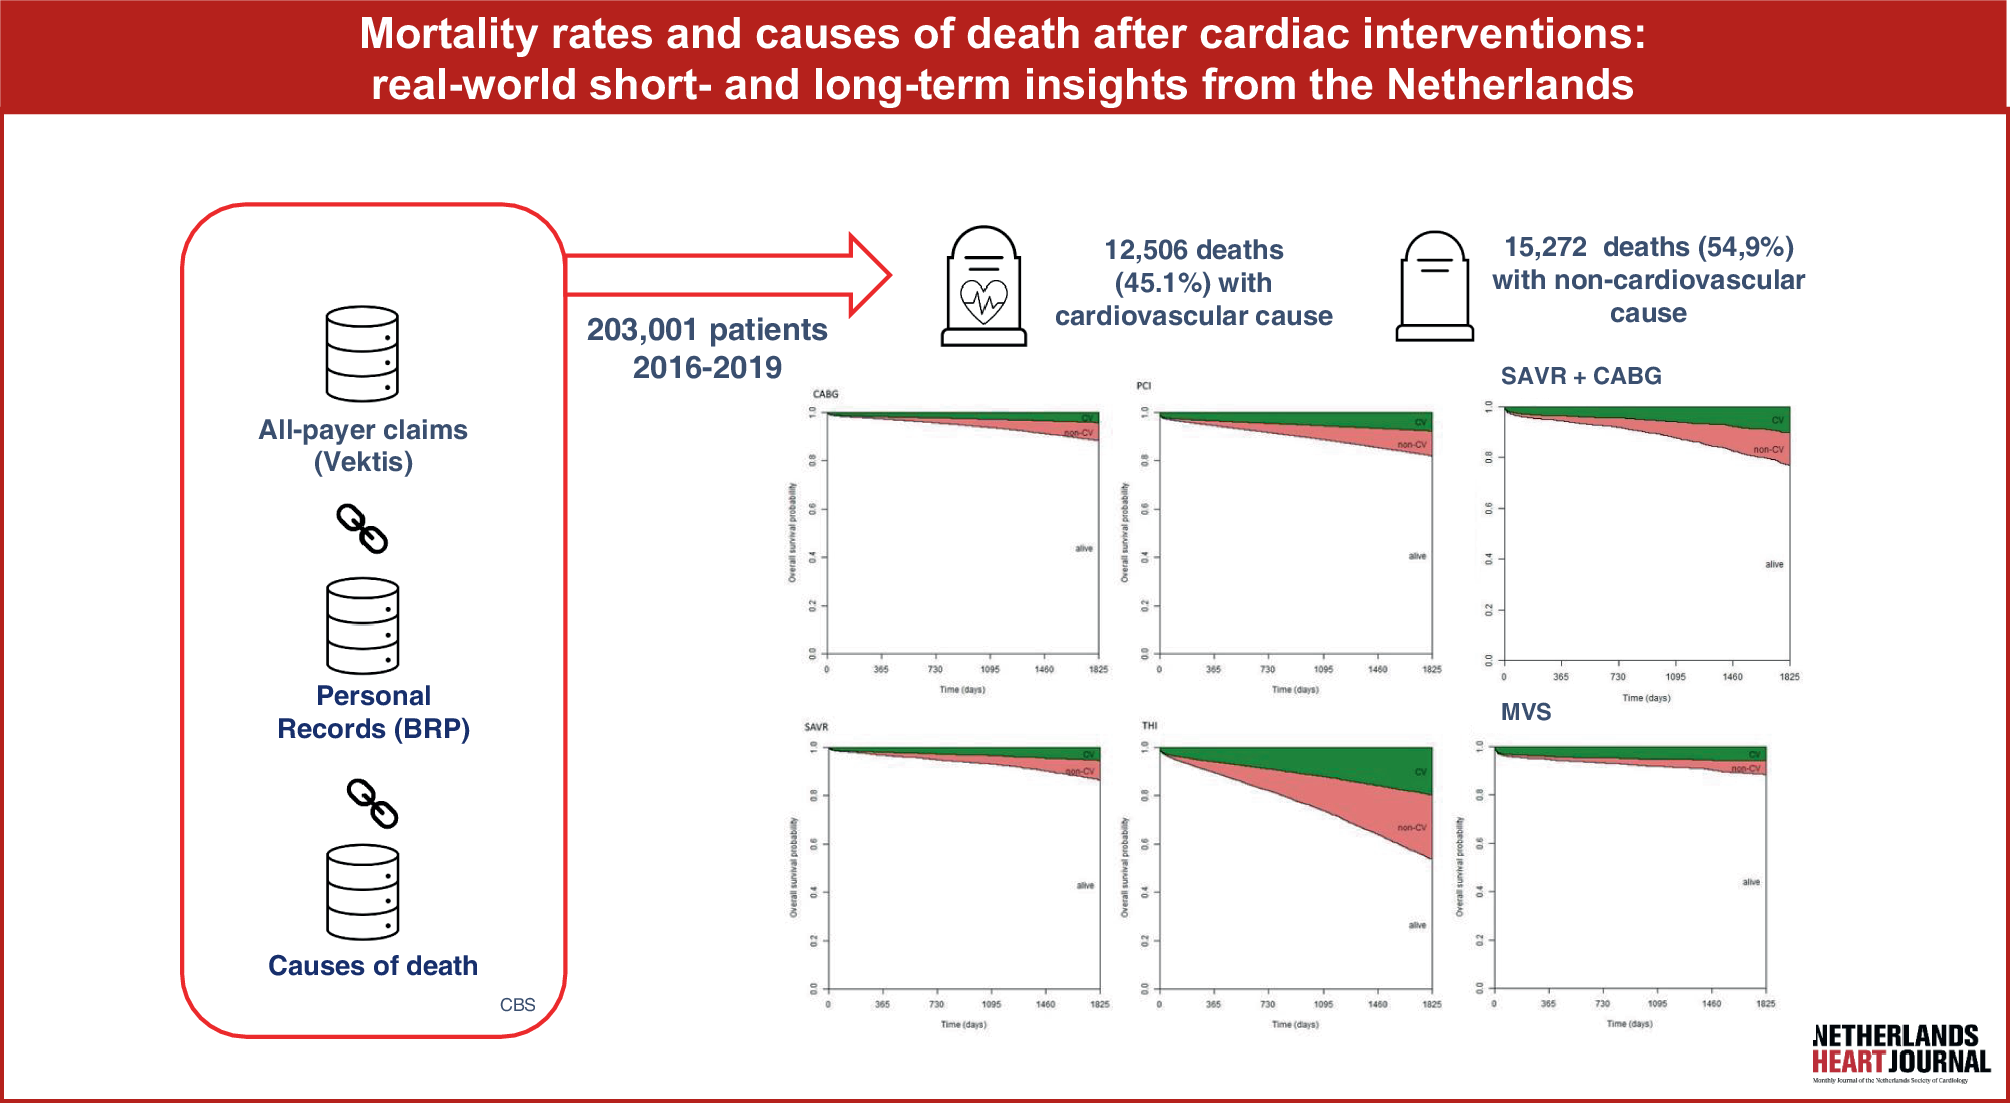
Between 2016 and 2019, 203,043 patients underwent a cardiac intervention. Complete data were available for 203,001 patients. Figure 2 shows the number of patients per intervention group. Follow-up was complete for all patients up to 2 years after intervention, and for 69,004 patients (34.0%) up to 5 years. During the study period, 13.7% (27,832) of patients died, including 12,560 (45.1%) cardiovascular deaths and 15,272 (54.9%) non-cardiovascular deaths. Cardiovascular causes of death were predominant at 30 days (85.6%, n = 3,859), 1 year (64.3%, n = 6,416), and 2 years (54.9%, n = 8,380) after intervention.
Fig. 1 Fig. 2
Flowchart of included patients per intervention group. (CABG coronary artery bypass graft, PCI percutaneous coronary intervention, SAVR surgical aortic valve replacement, THI transcatheter heart valve intervention, MVS mitral valve surgery, PVI pulmonary vein isolation, mini-MAZE minimally invasive maze surgery)
Coronary revascularizationAt 30-day follow-up, all-cause mortality after coronary revascularization (CABG and PCI) was 2.4% (n = 3,998), of which 85.8% (n = 3,429) were due to cardiovascular causes. After 1‑year, all-cause mortality increased to 5.1% (n = 8,447), with 64.9% (n = 5,482) cardiovascular and 35.1% (n = 2,965) non-cardiovascular mortality. After 2 years, all-cause mortality was 7.9% (n = 12,740), with 55.5% (n = 7,066) cardiovascular and 44.5% (n = 5,674) non-cardiovascular deaths.
At 30 days after CABG, cardiovascular causes were the predominant cause of death compared to non-cardiovascular causes (87.0% (n = 322), P-value < 0.01) (Tab. 1); chronic ischaemic heart disease was a prominent cause of death (52.3%, n = 194) (Tab S2, Electronic Supplementary Material). In the period 30 days until 2 years after CABG, there were 906 deaths, of which 58.1% (n = 527) were due to non-cardiovascular causes. Non-cardiovascular deaths continued to increase up to 5 years (Fig. 3). Overall, non-cardiovascular causes accounted for 58.9% (n = 1,530) and malignancies for 19.0% (n = 493) of all causes of death after CABG (Tab S2, Electronic Supplementary Material).
Table 1 Cardiovascular (CV) and non-cardiovascular (Non-CV) causes of death during follow-up after coronary revascularization and valve interventionFig. 3
Survival curves up to 5 years after cardiac intervention, divided by proportion of cardiovascular (CV) and non-CV causes of death. (CV Cardiovascular, CABG coronary artery bypass graft, PCI percutaneous coronary intervention, SAVR surgical aortic valve replacement, THI transcatheter heart valve intervention, MVS mitral valve surgery, PVI pulmonary vein isolation, mini-MAZE minimally invasive maze surgery)
At 30 days after PCI, the cause of death was predominantly cardiovascular (85.6% (n = 3,107), P-value < 0.001) (Tab. 1), and myocardial infarction was the most prominent cause of death (55.6%, n = 2,018) (Tab S3, Electronic Supplementary Material). After 30 days to 2 years after PCI, there were 7,836 deaths; 58.4% (n = 4,578) due to cardiovascular causes and 18.2% (n = 1,355) due to malignancies (Tab S3, Electronic Supplementary Material). Non-cardiovascular mortality predominated up to 5 years after PCI, comprising 54.2% (n = 11,012) of all deaths (Fig. 3).
Valve interventionAt 30-day follow-up, all-cause mortality in valve interventions (SAVR, THI, and MVS) was 2.4% (n = 419), of which 87.1% (n = 365) were due to cardiovascular causes. After 1 year, all-cause mortality increased to 7.3% (n = 1,256), with 61.3% (n = 770) cardiovascular and 38.7% (n = 486) non-cardiovascular mortality. After 2 years, all-cause mortality increased to 12.2% (n = 2,058), with 53.0% (n = 1,091) cardiovascular and 47.0% (n = 967) non-cardiovascular deaths.
Cardiovascular causes of death were the predominant cause of death after SAVR compared to non-cardiovascular causes at 30 days (84.5% (n = 60), P-value < 0.001) (Tab. 1). Thereafter, the proportion of non-cardiovascular increased, of the 221 deaths between 30 days until 2 years after the intervention 53.8% (n = 119) were due to non-cardiovascular causes (Tab. 1). The survival up to 5 years is shown in Fig. 3; 55.0% (n = 325) of all deaths were non-cardiovascular. More detailed information on causes of death after SAVR is provided in Tab S4 (Electronic Supplementary Material).
After THI, cardiovascular causes were the predominant cause of death compared to non-cardiovascular causes at 30 days (87.9% (n = 226), P-value < 0.001) (Tab. 1). Of the 1,307 deaths between 30 days and 2 years after THI (difference between 1,564 deaths after 2 years and 257 deaths after 30 days), only 42.8% (n = 560) were due to cardiovascular causes, of which 10.1% (n = 132) were due to heart failure (Tab S5, Electronic Supplementary Material). Of all deaths up to 5 years after THI, the proportion of non-cardiovascular causes was 55.4% (n = 1,619), Fig. 3 shows this trend.
After MVS, cardiovascular causes were the predominant cause of death compared to non-cardiovascular causes at 30 days (86.8% (n = 79), P-value < 0.001) (Tab. 1), of which endocarditis was one of the most prominent causes (22.0%, n = 20) (Tab S6, Electronic Supplementary Material). Cardiovascular causes remained the most prominent compared to non-cardiovascular causes at 1 year (77.6% (n = 125), P-value < 0.001) and 2 years (70.8% (n = 143), P-value < 0.001) (Tab. 1). Figure 3 shows the converging trend up to 5 years post-intervention. In total, 42.1% (n = 122) of all deaths were due to non-cardiovascular causes.
Combined aortic valve intervention and coronary revascularizationOf the total deaths within 30 days after SAVR + CABG treatment, 79.3% (n = 65) died due to cardiovascular causes (Tab. 2), chronic ischemic heart disease was the most prominent cause of death (32.9%, n = 27) (Tab S7, Electronic Supplementary Material). Cardiovascular causes were predominant after SAVR + CABG compared to non-cardiovascular causes after 1 year (64.3% (n = 119), P-value: 0.005) but not after 2 years (54.5% (n = 146), P-value: 0.299) (Tab. 2). Non-cardiovascular causes accounted for 56.5% (n = 105) of the 186 deaths between 30 days and 2 years post-intervention. Figure 3 shows this trend for SAVR + CABG up to 5 years. Overall, 55.3% (n = 319) of all deaths were non-cardiovascular.
Table 2 Cardiovascular (CV) and non-cardiovascular (Non-CV) causes of death during follow-up after cardiac interventionAtrial fibrillation treatmentMortality rates among patients treated with PVI or mini-MAZE were low (2-year all-cause mortality 1.2% (n = 188) and 1.5% (n = 19), respectively). One year after PVI, cardiovascular and non-cardiovascular causes of death were equal (50.6% (n = 45) vs. 49.4% (n = 44), p-value: 1.00) (Tab. 2). Of the 99 deaths in the following year, 33.4% were due to malignancies, resulting in non-cardiovascular causes being predominant 2 years after PVI (59.0%, (n = 111), p-value: 0.01). More detailed information on PVI and mini-MAZE can be found in Tab S8–S9 (Electronic Supplementary Material). For both PVI and mini-MAZE up to 5 years, non-cardiovascular causes are more common (66.0% (n = 311) and 65.5% (n = 34), respectively; Fig. 3).
Comments (0)