
Remember me
Baseline clinical and echocardiographic characteristics are summarized in Table S1. Among 102 patients (mean age 68 ± 14, 41.2% female), common comorbidities included hypertension (63.7%), atrial fibrillation (37.3%), and ischemic heart disease (46.1%). Most patients (60.0%) were NYHA class III or IV. Mean LVEF was 42.6%, and median LASR was 9.0%. Baseline medication use in the study population is presented in Table S2.
Over a median 35-month follow-up (IQR: 16–51), 39.2% of patients died, and 28.4% were hospitalized for HF. A proportion of patients were submitted to mitral valve interventions, including percutaneous repair (26.5%) and surgery (12.7%), with a median time to intervention of 4 months (IQR: 2–10). Differences in outcomes between VFMR and AFMR are presented in Table S3; of note, rates of TEER were significantly higher in VFMR compared with AFMR (p = 0.035). At 60 months, patients who underwent mitral valve intervention (surgery or percutaneous repair) showed numerically longer survival compared with those managed without intervention (mean survival 49.3 vs. 40.6 months), although this difference did not reach statistical significance (p = 0.214).
AFMR patients were more often female and had higher rates of atrial fibrillation and CKD. VFMR patients had more severe MR by EROA (despite showing no differences in regurgitant volume) and lower LVEF. Despite differences in mitral regurgitation severity, LASR remained non-significantly different between the groups, as determined by an analysis of covariance (ANCOVA) adjusting for effective regurgitant orifice area (EROA) (p = 0.116).
Outcomes and prognostic implications of LASRAlthough the groups exhibited differences, Kaplan-Meier analysis showed no significant difference in unadjusted mortality between VFMR and AFMR over 60 months (log-rank χ2 = 0.018, = 0.894).
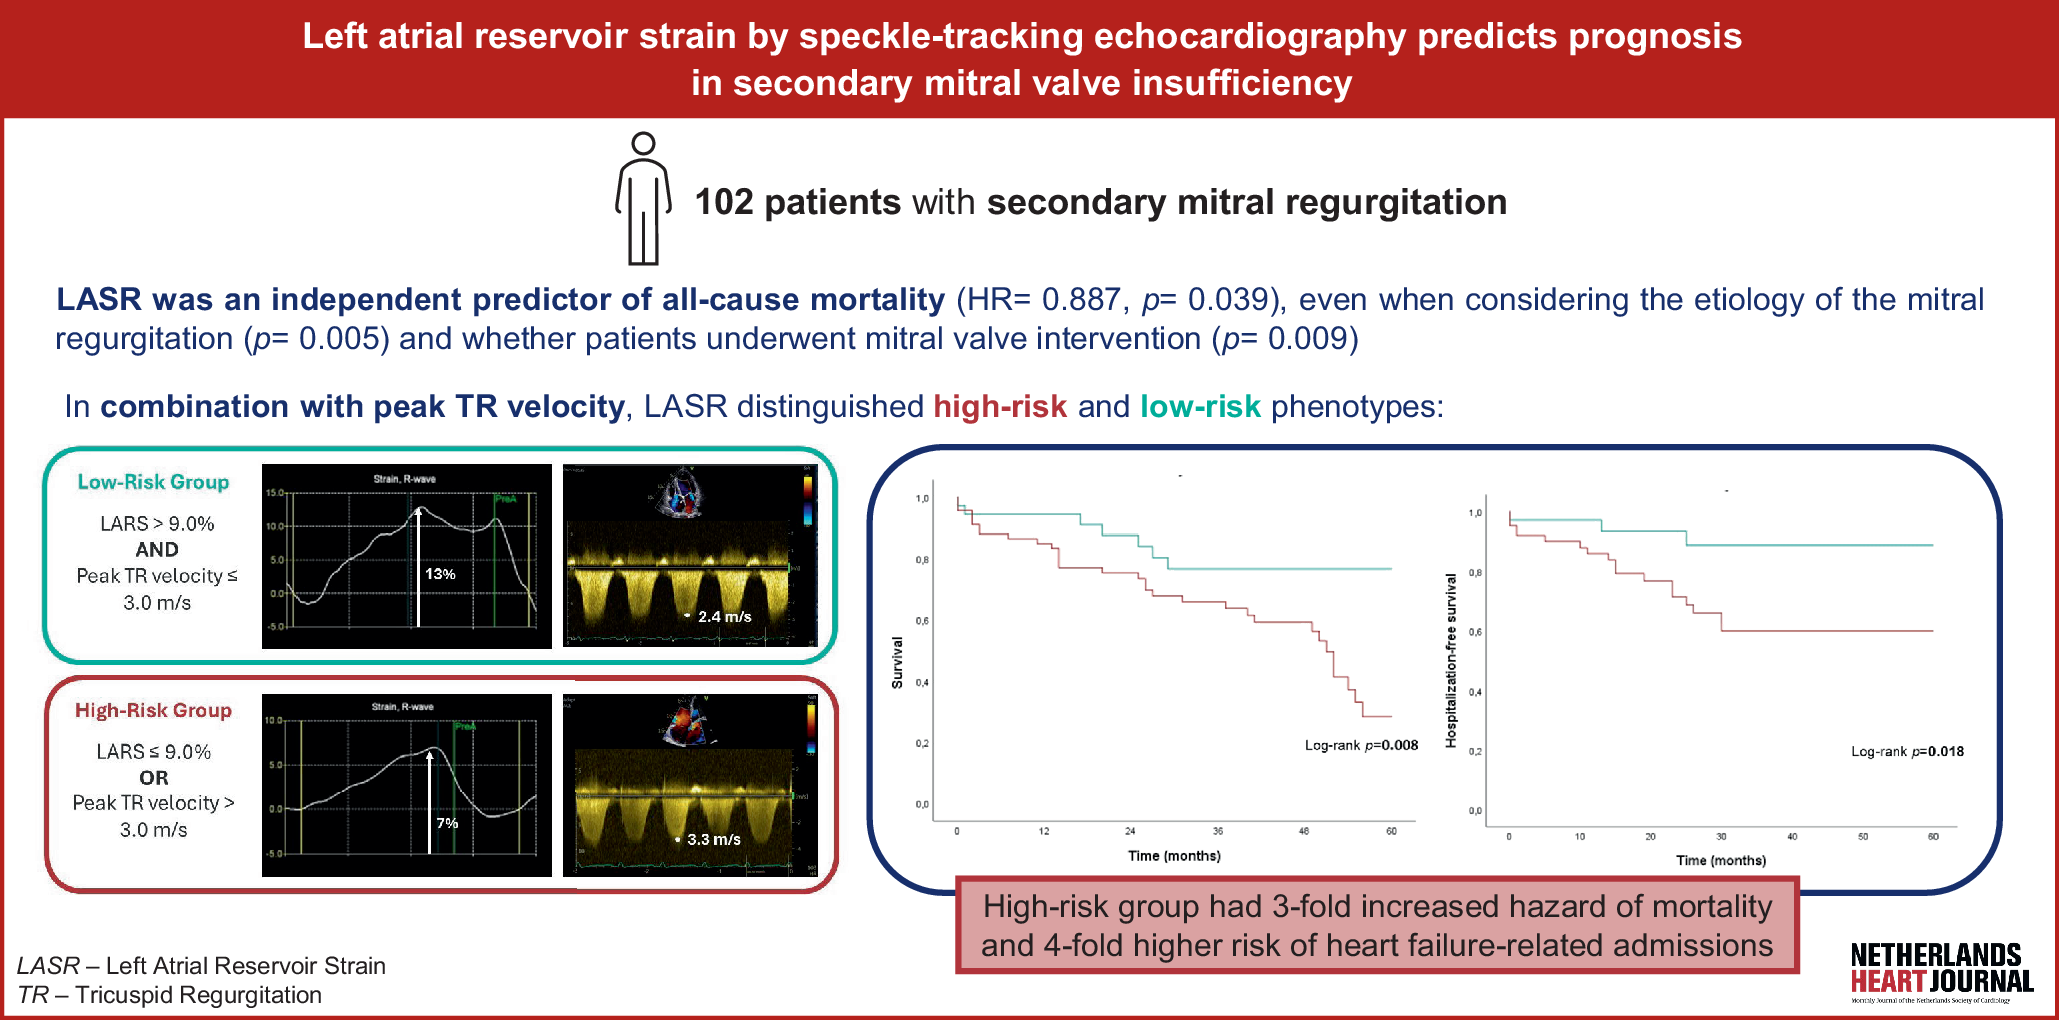
In univariate analysis, lower LASR was significantly associated with increased mortality risk (HR = 0.889, 95% CI: 0.814–0.972, p = 0.009). After adjusting for clinical and echocardiographic covariates, LASR remained statistically significant in the multivariate model (HR = 0.887, 95% CI: 0.791–0.994, p = 0.039). This association remained significant regardless of MR etiology (HR = 0.872, 95% CI: 0.793–0.960, p = 0.005) or whether patients underwent mitral valve intervention (HR = 0.884, 95% CI: 0.806–0.969, p = 0.009). Despite lower LASR values in patients with AF compared with those in sinus rhythm (mean LASR 8.9 ± 4.0 vs. 11.4 ± 5.3, p = 0.011), the association between LASR and mortality remained significant when analyses were stratified by rhythm (HR = 0.904, 95% CI: 0.828–0.987, p = 0.025).
Several other variables were also associated with mortality in univariate analysis, including age (HR = 1.028, p = 0.049), peripheral artery disease (HR = 2.542, p = 0.031), peak tricuspid regurgitation (TR) velocity (HR = 2.211, p = 0.017), and left atrial stiffness (HR = 1.265, p = 0.016). However, in the multivariate model, only LASR and peak TR velocity remained significant, with peak TR velocity showing a strong independent association with mortality (HR = 3.196, p = 0.009). Left atrial stiffness was excluded from the final model due to collinearity with LASR—prior analysis indicated that when both variables were included, stiffness lost its predictive value (HR = 1.077, p = 0.594).
Traditional echocardiographic parameters, such as effective regurgitant orifice area (EROA) (HR = 1.018, p = 0.051) and left ventricular end-diastolic volume index (LVTDVi) (HR = 1.007, p = 0.092), showed potential associations with mortality in univariate analysis, but failed to reach statistical significance.
The detailed results of the univariate and multivariate analyses are presented in Table S4.
To further assess the prognostic value of LASR, we conducted a Kaplan-Meier survival analysis stratified by LASR quartiles (Fig. 2): Q1 (≤ 7.00%), Q2 (7.01–9.00%), Q3 (9.01–12.50%), Q4 (> 12.50%). Survival probability differed significantly across quartiles (log-rank χ2 = 10.842, p = 0.013), with patients in Q1 (LASR ≤ 7.00%) exhibiting the poorest survival outcomes. Higher quartiles were associated with progressively better survival (HR = 0.654, 95% CI: 0.475–0.901, p = 0.009).
Fig. 2
Kaplan–Meier survival curves by LASR quartiles
Combined effect of LASR and peak TR velocity in prognosisGiven the independent associations of LASR and peak TR velocity with mortality, we assessed their combined predictive value by stratifying peak TR velocity into risk groups: group 1 (≤ 3.0 m/s) and group 2 (> 3.0 m/s).
Patients were then categorized into high-risk and low-risk groups based on LASR and peak TR quartiles: Low-risk: LASR in Q3 or Q4 (> 9.0%) and peak TR velocity in Group 1 (≤ 3.0 m/s). High-risk: LASR in Q1 or Q2 (≤ 9.0%) or peak TR velocity in Group 2 (> 3.0 m/s).
The incremental value of LASR on top of TR velocity was assessed by constructing combined risk groups. While TR velocity > 3.0 m/s alone identified 33 patients at higher risk, the composite model incorporating LASR reclassified an additional 34 patients into the high-risk group, resulting in 67 patients (65.7% of the cohort) being identified as high risk. Survival probability was significantly lower in the high-risk group (log-rank test: p = 0.008), having an almost 3‑fold increased hazard of mortality (HR = 2.853, 95% CI: 1.254–6.489, p = 0.012) (Fig. 3).
Fig. 3
Kaplan–Meier survival curves for high- and low-risk groups based on LASR and peak TR velocity
Beyond mortality risk, the high-risk group was also significantly associated with an increased likelihood of heart failure hospitalizations (Log-rank χ2 = 5.563, p = 0.018), with high-risk patients having a nearly fourfold higher risk of heart failure-related admissions (HR = 3.922, 95% CI: 1.152–13.355, p = 0.029).
Comments (0)