
Remember me
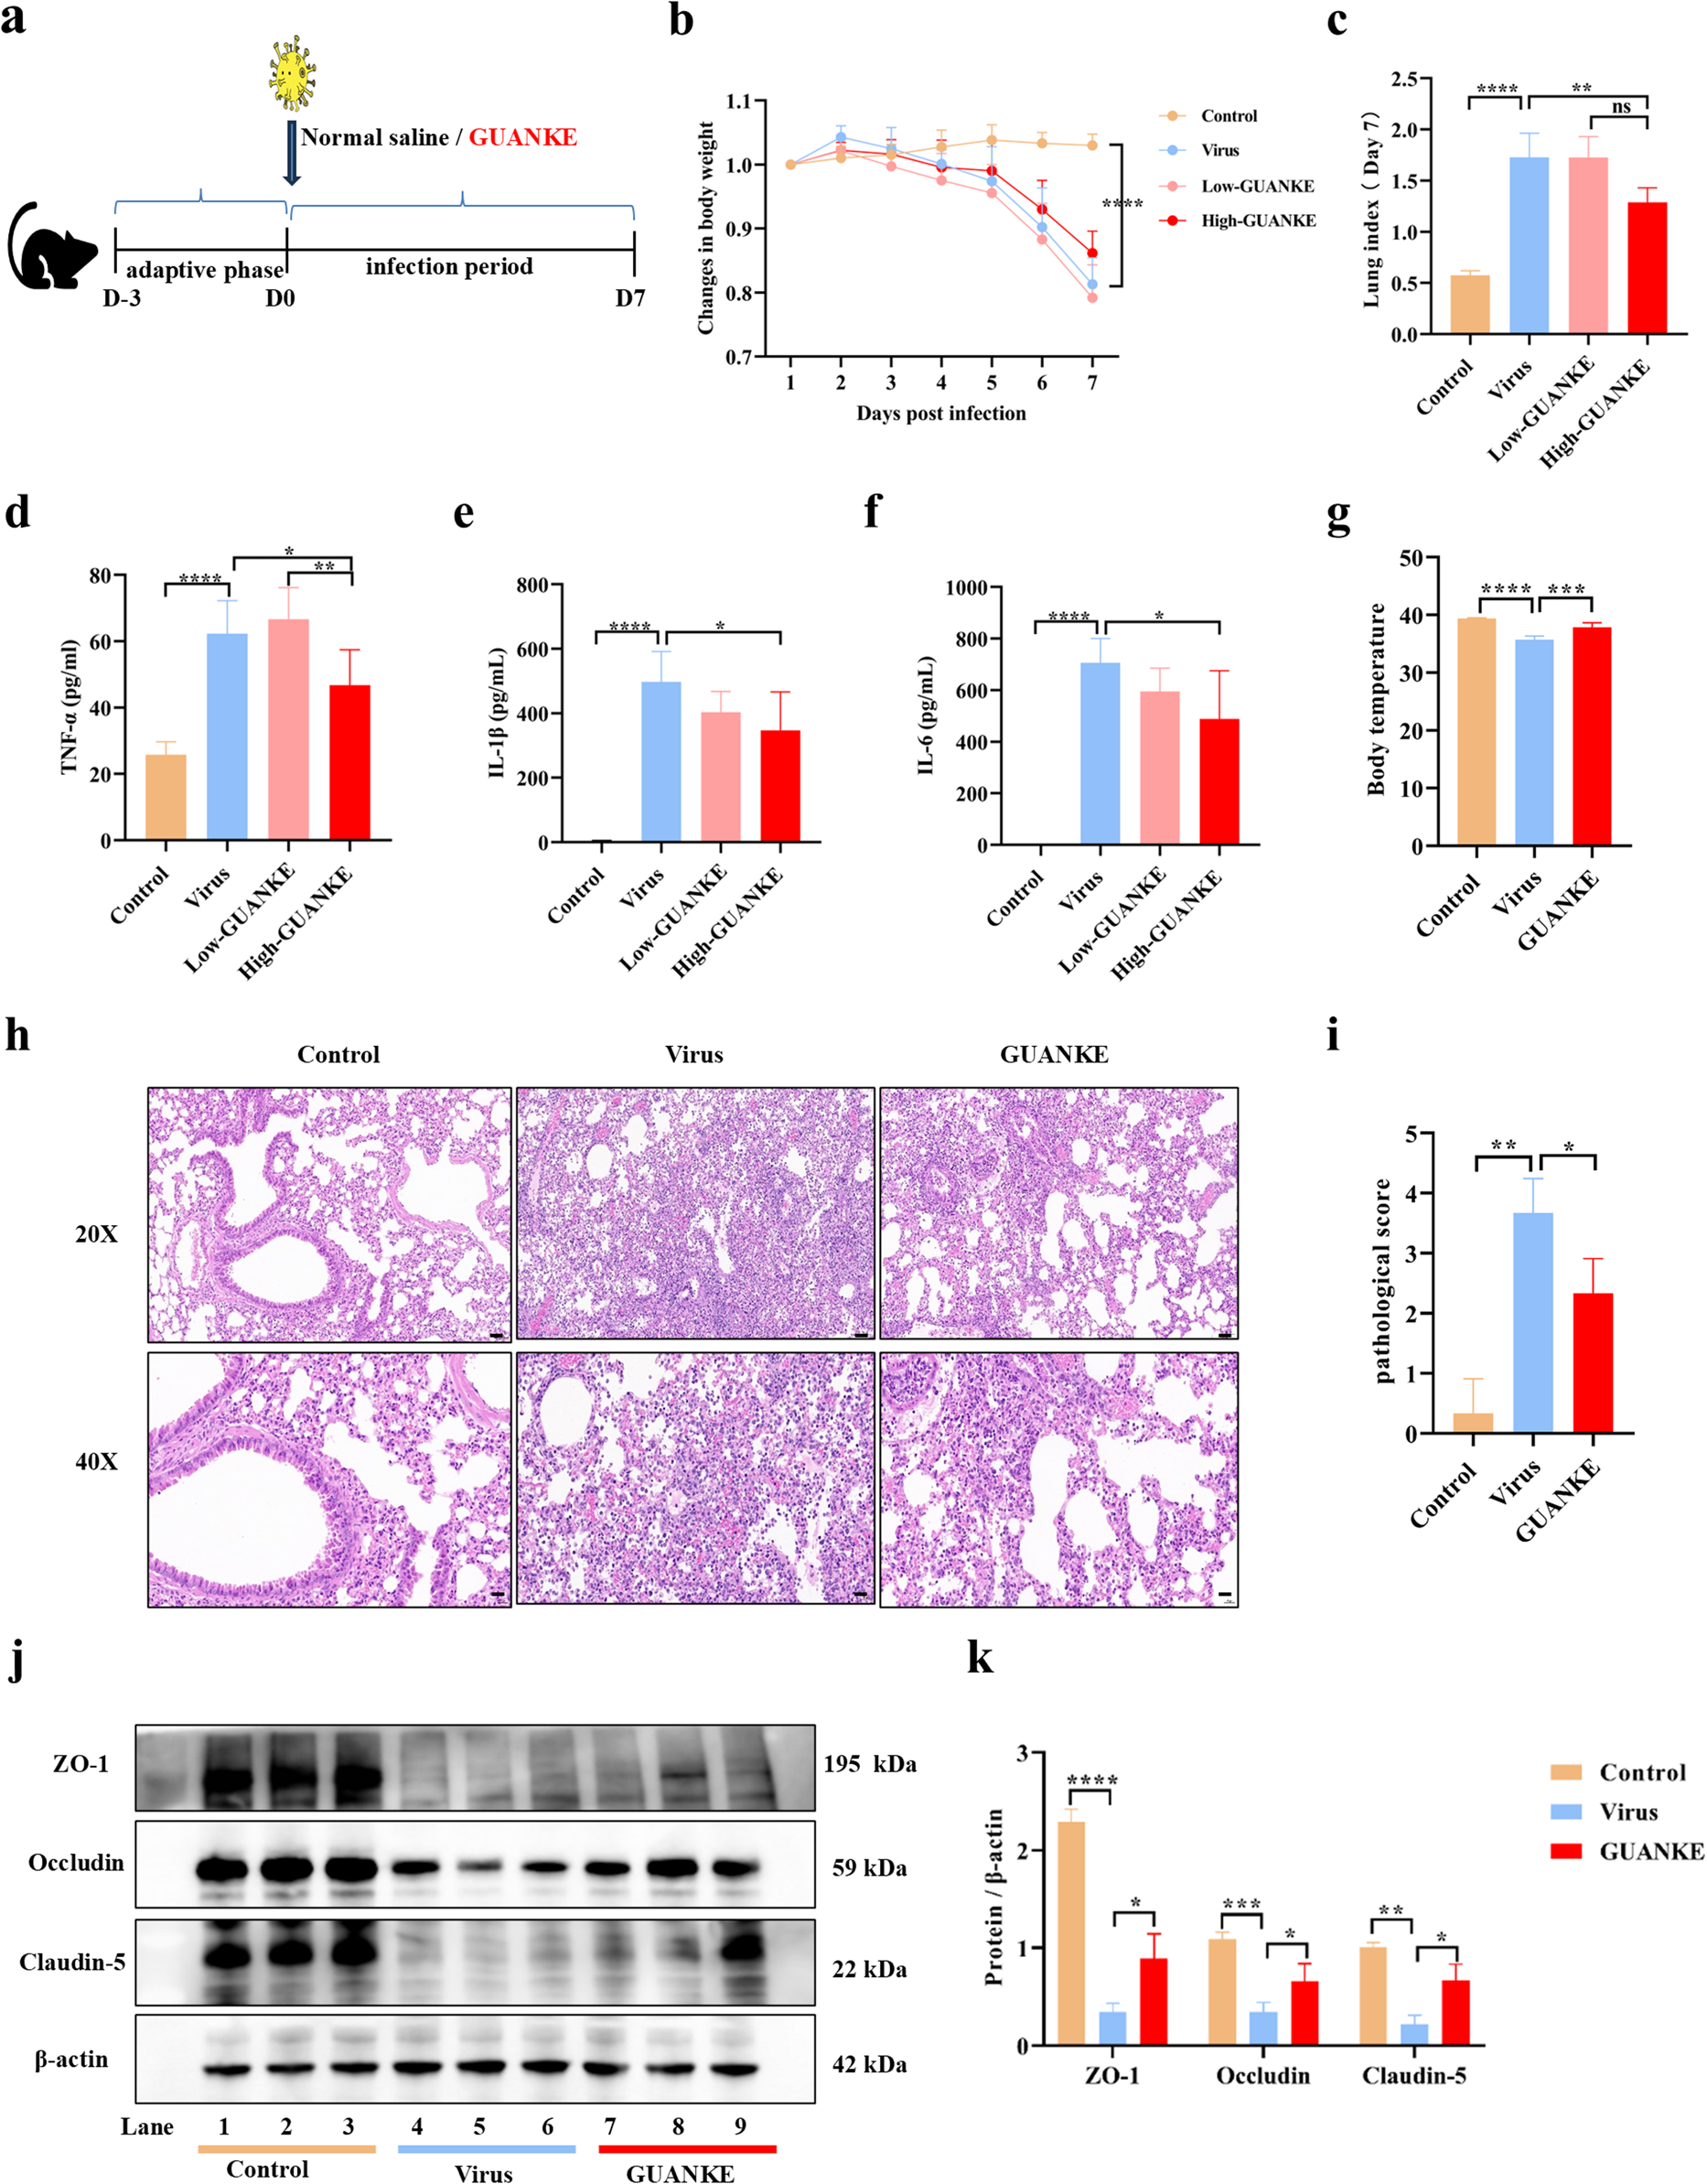
To determine whether GUANKE can reduce the inflammatory response in the lung tissues of IAV-infected mice, C57BL/6J mice were randomly divided into Control group (non-infection, n = 6), Virus group (mice infected with IAV take normal saline orally every day, n = 6) and two GUANKE groups (mice infected with IAV receiving oral GUANKE every day, mice in the high GUANKE group receiving oral bacterial dose of 5 × 10⁹ CFU/mice/day, in the low GUANKE group receiving oral bacterial dose of 5 × 10⁸ CFU/mice/day, n = 6) (Fig. 1a). PCR test of fecal DNA on day 7 post-infection revealed that the content of the Lactiplantibacillus plantarum-specific gene RecA in the feces of the GUANKE group was significantly higher than that in the Virus group, indicating that success in GUANKE administration (Fig S1a). Daily monitoring of the body weight showed that treatment of mice with GUANKE at the same time as the infection was not effective in preventing the weight loss caused by IAV infection (Fig. 1b). The levels of TNF-α (Fig. 1d), IL-1β (Fig. 1e) and IL-6 (Fig. 1f) in the lung tissues collected from mice in all groups on day 7 post-infection were detected by ELISA. Compared to the Virus group, only high doses of GUANKE (5 × 10⁹ CFU) effectively reduced the amount of TNF-α (25.0%, P = 0.03), IL-1β (19.4%, P = 0.03) and IL-6 (30.8%, P = 0.03) in the lung tissues of mice (Fig. 1), while low doses of GUANKE (5 × 10⁸ CFU) had no such effect. In line with this, pathological analysis data showed that a large number of inflammatory cells, including monocytes and macrophages, were recruited and infiltrated in the lung tissues after IAV infection, while this inflammatory cell infiltration was significantly reduced in the mice receiving an oral high dose of GUANKE, so that their lung tissue structure was more similar to that of normal mice (Fig. 1h and i, P = 0.047). The body temperature (Fig. 1g, P = 0.0005), lung index (Fig. 1c, P = 0.003), and tight junction proteins expression (Fig. 1j and k) of IAV-infected mice receiving oral high doses of GUANKE were also closer to those of Control group mice relative to the Virus group mice. In addition, the mice receiving higher dose of GUANKE (The maximum inoculum is 8 × 10¹⁰ CFU/mice/day) did not further reduce lung index, TNF-α, IL-1β and IL-6, or restore body temperature and colon length (data not shown). Thus, the dose of GUANKE at 5 × 10⁹ CFU/mice/day was used in the follow-up experiments.
Fig. 1
Oral administration of Lactiplantibacillus plantarum GUANKE (5 × 10⁹ CFU/mice/day) reduces the inflammatory response and attenuates the expression of tight junction proteins in the lung tissue of IAV-infected mice. Animal experiments were performed according to the workflow (a). Change in body weight over time in IAV-infected mice (b). The lung index of mice on day 7 post-infection (c). The amount of TNF-α (d), IL-1β (e) and IL-6 (f) in mouse lung tissue on day 7 post-infection. The body temperature of mice on day 7 post-infection (g). Typical pathological changes (h) and pathology score (i) in mouse lung tissue on day 7 post-infection. Expression of tight junction proteins in mouse lung tissue on day 7 post-infection (j-k). The data are presented as means ± SEM. Statistical analysis was performed using two-tailed Student’s t-test or One-way ANOVA (P ≤ 0.05, *, P ≤ 0.01, **,P ≤ 0.001, ***, P ≤ 0.0001, ****, ns = non-significant)
Oral administration of GUANKE enhances oxidative phosphorylation pathways in normal and IAV-infected miceTo determine the mechanism underlying the anti-inflammatory effect of GUANKE supplementation, we first performed transcriptomic sequencing on lung and colon tissues from GUANKE-gavaged mice (n = 5) and normal saline-gavaged mice (n = 5). Kyoto Encyclopedia of Genes and Genomes (KEGG, Fig. 2a), Gene Ontology (GO, Fig. 2b), and Gene Set Enrichment Analysis (GSEA, Fig. 2c) showed that GUANKE enhanced oxidative phosphorylation pathways in the lung of mice as manifested by significant up-regulation of the genes associated with oxidative phosphorylation pathways (complex I, Ⅲ, Ⅳ and Ⅴ) (Fig. 2d). Consistent with these changes, the GSEA analysis showed that compared with the normal saline group, the oxidative phosphorylation pathway in the colon of the GUANKE group was significantly enhanced, and the expression of related genes was significantly increased. (Fig S2 a). To clarify the effect of respiratory viral infection on the oxidative phosphorylation pathway, we first downloaded and analyzed transcriptome sequencing results from IAV-infected human lung (GSE206606) and SARS-CoV-2-infected individual lung tissues (GSE150316). The results showed that IAV and SARS-CoV-2 infection led to down-regulation of the expression of oxidative phosphorylation pathway-related genes in host lung tissue, among which Sdhc and Atp5a1 were down-regulated to the largest degree (Fig. 2e and f). We also conducted the qRT-PCR to detect the expression of partial genes related to the oxidative phosphorylation pathway (Ndufa 2, Ndufa 3, Ndufb 7 and Ndufs 8 of complex I, Uqcrh of complex Ⅲ, Cox6a1, Cox6b1 and Cox8a of complex Ⅳ, Atp5j2, Atp5e and Atp5a1 of complex Ⅴ) in the lungs and colons of IAV-infected mice. Compared with the Control group, the expression of genes related to the oxidative phosphorylation pathway (except Cox6a1) was significantly down-regulated in the lungs of the Virus group mice (Fig. 2g). Moreover, oral administration of GUANKE reversed the down-regulated expression caused by the influenza virus, among which Ndufs8, Cox8a, Atp5j2, and Atp5e were the most significant (Fig. 2g). The Western blot analyses of lung tissues from three groups of mice once again confirmed the above results (Fig. 2h-i). Interestingly, although only the expression of Cox8a and Atp5e was markedly perturbed in the colon tissue of mice infected with IAV, while other oxidative phosphorylation genes showed varying degrees of but not significant downregulation), compared to normal mice, the expression of oxidative phosphorylation-related genes detected in the colon tissue of mice infected with IAV after oral administration of GUANKE showed significant upregulation (Fig S2 b).
Fig. 2
Lactiplantibacillus plantarum GUANKE enhances oxidative phosphorylation pathways in the lung of normal and IAV-infected mice. KEGG pathway enrichment analysis (a), GO pathway enrichment analysis (b), and GSEA analysis (c) of RNA-seq of the lung of mice treated with GUANKE. Heatmaps represent the expression of genes associated with oxidative phosphorylation in the lungs of two groups of uninfected mice (d), IAV-infected human lung tissues (e, GSE206606), and SARS-CoV-2-infected human lung tissues (f, GSE150316), respectively. Expression of representative oxidative phosphorylation genes at the transcriptional (g) and translational levels (h and i) in mouse lung tissue on day 7 post-IAV infection. The data are presented as means ± SEM. Statistical analysis was performed using two-tailed Student’s t-test or One-way ANOVA (P ≤ 0.05, *, P ≤ 0.01, **, P ≤ 0.001, ***, P ≤ 0.0001, ****, ns = non-significant)
Oxidative phosphorylation inhibitor oligomycin A antagonizes the protective effect of GUANKE on IAV-infected miceTo further clarify whether oxidative phosphorylation is involved in the protective effect of GUANKE on IAV-infected mice, as shown in Fig. 3a, we treated two groups of IAV-infected mice with oligomycin A (OA). The OA-Virus group received intraperitoneal injection of oligomycin A and gavage of normal saline after infection with influenza virus (n = 6), while the OA-GUANKE group received intraperitoneal injection of oligomycin A and gavage of GUANKE after infection with influenza virus (n = 6). The results showed that compared with the Virus group mice, the mice in the OA-Virus group had a more rapid loss in both body weight (Fig. 3b) and temperature (Fig. 3c), and a higher lung index (Fig. 3d), though neither reached levels of significance. Meanwhile, an insignificantly higher secretion of IL-6 (Fig. 3h) was detected in the OA-Virus group. Interestingly, the oligomycin A administration significantly weakened the protective effect of GUANKE on IAV-infected mice. As suggested in Fig. 3, compared with the OA-Virus group, the body temperature (Fig. 3c), the lung index (Fig. 3d), the secretion of TNF-α (Fig. 3h), IL-1β (Fig. 3i), and IL-6 (Fig. 3j) in the lung tissue of the OA-GUANKE group mice did not significantly decrease, and the expression of tight junction proteins (Fig. 3f and j) in the lung tissue of the OA-GUANKE group mice did not significantly improve, and there was no significant reduction in lung histopathology (Fig. 3e).
Fig. 3
Oxidative phosphorylation inhibitor oligomycin A antagonizes the protective effect of GUANKE on IAV-infected mice. Animal experiments were conducted as shown in the workflow (a). The change in body weight was measured daily (b). The body temperature (c) was recorded and the lung index (d) was calculated on day 7 post-infection. Representative pathological changes in the lung tissue of each group of mice were presented (e). Changes in the expression of tight junction proteins (f and g), TNF-α (h), IL-1β (i), and IL-6 (j) in lung tissue on day 7 post-infection. The data are presented as means ± SEM. Statistical analysis was performed using One-way ANOVA (P ≤ 0⋅05, *, P ≤ 0⋅01, **, P ≤ 0⋅001, ***, P ≤ 0⋅0001, ****, ns = non-significant)
GUANKE treatment improves mitochondrial quality in the lung tissue of IAV-infected miceWe examined the condition of mitochondria in the lung tissue of mice to determine the mechanism for the protective effect of GUANKE against IAV-infection on day 7 post-infection. Compared with the Control group, the results of TEM showed that the ultrastructure of mitochondria in the lung tissue of the Virus group mice were significantly changed. The ratio of mitochondria length/width were smaller, and the mitochondrial cristae structure became blurred in the lung tissue of the Virus group mice (Fig. 4a and b). Moreover, the proportion of type 2 alveolar epithelial cells decreased significantly (data not shown). In contrast, the ultrastructure of mitochondria in the lung tissue of the GUANKE-treated mice were similar to those of the Control group (Fig. 4a). We also tested the expression levels of genes closely related to mitochondrial function (Tfam, Tom20, Pgc-1α). As shown in Fig. 4c, the expression of Tfam, Tom20, and Pgc-1α in the lung tissue of mice after viral infection was significantly down-regulated compared with Control mice, and GUANKE’s intervention could significantly reverse the changes in expression of Tfam (P = 0.01) and Tom20 (P = 0.03) caused by viral infection, but not Pgc-1α(P = 0.92). In line with this, Western blotting (Fig. 4d and e) and immunohistochemistry (Fig. 4f and g) results also suggest that treatment with GUANKE may prevent the downregulation of TFAM and TOM20 levels by IAV. Further, the Western blotting results (Fig. 4h and i) showed that GUANKE treatment could significantly down-regulate the expression of cGAS and STING induced by infection.
Fig. 4
GUANKE treatment improves mitochondrial quality in the lung tissue of IAV-infected mice. The representative TEM images (a) and mitochondrial length/width ratio in TEM images (b) in the lungs of mice. The blue arrows point to normal mitochondria, the yellow arrows point to swollen mitochondria, and the red arrows point to mitochondrial autophagosomes. The mRNA levels of the Tfam, Tom20, and Pgc-1α in the mouse lung on day 7 post-IAV-infection (c). The protein levels (d and e) and IHC staining (f and g) of the TFAM and TOM20 in the lungs on day 7 post-IAV-infection. CGAS and STING protein levels (h and i) in the lung of mice on day 7 post-IAV-infection. The data are presented as means ± SEM. Statistical analysis was performed using One-way ANOVA (P ≤ 0⋅05, *, P ≤ 0⋅01, **, P ≤ 0⋅001, ***, P ≤ 0⋅0001, ****, ns = non-significant)
GUANKE attenuates the lung tissue inflammation in IAV-infected mice by enhancing mitophagyOral administration of GUANKE could enhance the level of mitophagy in lung tissue of IAV-infected mice. The Western blot results (Fig. 5a-c) showed that compared with the Control group, the expression of Pink, Parkin, LC3Ⅱ/LC3Ⅰ, and P62 proteins associated with mitophagy was up-regulated and Mfn2 expression down-regulated in the lung tissues of mice after influenza virus infection; oral administration of GUANKE further enhanced the expression of Pink (P = 0.04), Parkin (P = 0.009), and LC3Ⅱ/LC3Ⅰ (P = 0.006), and decreased the expression of Mfn2 (P = 0.06) and P62 (P = 0.01). Further analysis of LC3 (P = 0.03) and Parkin (P = 0.001) expression in the lung tissue using IF also showed that the level of mitophagy in the lung tissue was significantly enhanced in the GUANKE-treated mice compared to those in the Virus group (Fig. 5d-f). To further investigate the role of mitophagy in GUANKE-induced inhibition of inflammatory cytokine secretion in IAV-infected mice, we suppressed mitophagy levels in IAV-infected mice by intraperitoneal injection of an autophagy inhibitor. Although the use of inhibitor 3-MA had no significant effect on the body weight of mice (Fig. 6a), it significantly weakened the protective effect of GUANKE on IAV-infected mice. As shown in Fig. 6, the use of 3-MA also prevented GUANKE from significantly reducing the increase in lung index (Fig. 6c), the decrease in mouse body temperature (Fig. 6b), and the downregulation of barrier proteins expression caused by IAV infection (Fig. 6e-f). In addition, after giving the 3-MA inhibitor to mice, GUANKE no longer effectively antagonized the secretion of IL-1β (Fig. 6h) and IL-6 (Fig. 6i) caused by IAV infection while still preferentially inhibited the secretion of TNF-α (Fig. 6g). Unlike GUANKE treatment alone, which significantly improved the infiltration of inflammatory cells in the lung tissue of IAV-infected mice, a large number of inflammatory cell infiltrations was still present in the lung tissue of the 3MA-GUANKE-treated mice (Fig. 6d).
Fig. 5
Oral administration of GUANKE enhances the level of mitophagy in lung tissue of IAV-infected mice. The protein expression levels of mitophagy-related molecules LC3Ⅱ/Ⅰ, P62, Pink, Parkin, and Mfn 2 (a–c). Representative micrographs of LC3Ⅱ and Parkin immunofluorescence staining in mouse lung tissue on day 7 post-infection (d–f). The data are presented as means ± SEM. Statistical analysis was performed using two-tailed Student’s t-test or One-way ANOVA (P ≤ 0⋅05, *, P ≤ 0⋅01, **, P ≤ 0⋅001, ***, P ≤ 0⋅0001, ****, ns = non-significant)
Fig. 6
Inhibitor 3-MA attenuates the protective effect of GUANKE in IAV-infected mice. Changes in body weight after infection with IAV (a). The body temperature (b) and Lung index (c) on day 7 post-infection. Images of typical pathological changes in the lung tissue on day 7 post-infection (d). Changes in the expression of tight junction proteins (e and f), TNF-α (g), IL-1β (h), and IL-6 (i) in the lung tissue on day 7 post-infection. The data are presented as means ± SEM. Statistical analysis was performed using two-tailed Student’s t-test or One-way ANOVA (P ≤ 0⋅05, *, P ≤ 0⋅01, **, P ≤ 0⋅001, ***, P ≤ 0⋅0001, ****, ns = non-significant)
GUANKE regulates gut microbiota dysbiosis and metabolic dysfunction in IAV-infected miceTo investigate the effects of GUANKE on the gut ecology of IAV-infected mice, 16S rRNA gene amplicons sequencing was examined in the samples collected on day 6 post-infection. The weighted principal coordinate analysis (PcoA) (Figure S3a) based on Bray Curtis showed that the Virus and Control groups were better separated; the GUANKE group was close to the Control group at the genus level. To study the specific changes in bacterial communities, we analyzed the changes in intestinal flora at the genus levels. As shown in Figure S3b, at the genus level, IAV infection caused a significant upregulation of the relative abundance of Faecalibaculum, while IAV infection caused a downregulation of the relative abundance of Lactobacillus and Bacillus in the gut of mice. Oral administration of GUANKE brought the abundance of Faecalibaculum, Lactobacillus, and Bacillus in the guts of infected mice closer to that of the Control group mice. Moreover, the KEGG pathway analysis of PICRUSt2 (Figure S3c) indicated significant differences in amino acid metabolism, nucleotide metabolism, and lipid metabolism between the three groups of mice. The results of HM700 high-throughput targeted detection showed that a total of 422 metabolites were detected in the cecal contents of mice in three groups, mainly including amino acids and peptides, fatty acids, and organic acids. The results of PCA analysis showed a significant difference in the composition of metabolites between the cecum contents of the virus group and the control group, while the composition of the cecal contents of the GUANKE group was closer to that of the control group mice (Fig. 7a). Differential screening of metabolites (Fold change ≥ 1.2, P value<0.05, VIP ≥ 1) showed that 21 metabolites were up-regulated and 15 metabolites down-regulated in the cecal contents of mice in the GUANKE group compared with the Virus group (Fig. 7b). KEGG enrichment analysis of differential metabolites showed that the metabolites were mainly enriched in the purine metabolism pathway, phenylalanine, tyrosine and tryptophan biosynthesis pathway, nucleotide metabolism pathway, nicotinate and nicotinamide metabolism pathway, and linoleic acid metabolism pathway (Fig. 7c). Analysis of the metabolites in the fermentation supernatant of GUANKE showed that a total of 393 metabolites were detected in the supernatants of GUANKE and MRS, and there were significant differences in metabolite composition between the two groups (Fig. 7d). Compared with the MRS group, a total of 52 metabolites were significantly up-regulated and 86 metabolites were significantly down-regulated in the supernatant of the GUANKE group (Fig. 7e, fold change ≥ 2, P value<0.05, VIP ≥ 1). KEGG analysis showed that these differential metabolites were significantly enriched in Microbial metabolism in diverse environments pathway, glyoxylate and dicarboxylate metabolism pathway, D-Amino acid metabolism pathway, citrate cycle pathway, and carbon metabolism pathway (Fig. 7f). The integration of the differential metabolites generated by the two groups of analyses showed that there were 19 identical metabolites in the two groups of differential metabolites (Fig. 7g). Among them, 10 metabolites (phenyllactic acid, arabinose, ribulose, quinic acid, linoleic acid, 3,6-diketocholanic acid ethyl ester, linoelaidic acid, s-allylcysteine, vaccenic acid and oleic acid) were up-regulated in both groups of analyses, and 4 metabolites (L-tryptophan, suberic acid, guanosine (G) and xanthosine) were down-regulated in both groups of analyses at the same time (Fig. 7h and i). Correlation analysis of 19 metabolites with inflammatory factors (TNF-α, IL-1β and IL-6) showed that linoleic acid, which was significantly up-regulated in the two groups (Fig. 7k and l), was significantly negatively correlated with the three inflammatory factors (Fig. 7j). Consistently, untargeted metabolomic analysis of serum from normal mice following GUANKE intervention revealed a significant increase in linoleic acid levels compared with the normal control group (Fig S4).
Fig. 7
GUANKE regulates metabolic dysfunction in IAV-infected mice. Principal coordinate analysis (PCoA) plot of metabolites from the cecal contents of three groups of mice (a). The volcano plot of differential metabolites in the cecal contents of mice in the Virus group versus GUANKE group (b). The metabolic pathway enrichment analysis of differential metabolites between the Virus group mice and the GUANKE group mice was performed based on the KEGG database (c). PCoA plot among the MRS group and GUANKE group (d). Volcanic plot of differential metabolites between MRS medium and GUANKE fermentation supernatant (e). The KEGG metabolic pathway enrichment analysis of differential metabolites between MRS medium and GUANKE fermentation supernatant (f). The Venn diagram represents the number of metabolites that were simultaneously altered in the fermented supernatant and mouse cecal contents (g). The heat map represents the relative content of metabolites that were altered simultaneously in the fermentation supernatant (h) and cecal contents (i). Spearman correlation analysis of co-altered metabolites with inflammatory cytokines secreted by IAV-infected mice (j). Linoleic acid content in GUNAKE fermentation supernatant (k) and mouse cecal contents (l). The data are presented as means ± SEM. Statistical analysis was performed using two-tailed Student’s t-test or One-way ANOVA (P ≤ 0⋅05, *, P ≤ 0⋅01, **, P ≤ 0⋅001, ***, P ≤ 0⋅0001, ****, ns = non-significant)
Exogenous supplementation of GUANKE’s metabolite Linoleic acid has a protective effect on IAV-infected miceTo determine whether linoleic acid plays a protective role in IAV-infected mice, we administered linoleic acid (40 mg/kg) by gavage to IAV-infected mice. The results showed that, like GUANKE, linoleic acid treatment was also not effective in preventing the weight loss caused by influenza infection (Fig. 8a), but it restored the drop in body temperature (Fig. 8b, P = 0.02) and significantly reduced the increase in lung index (Fig. 8c, P = 0.03) caused by influenza infection. Compared with the Virus group, linoleic acid significantly reduced the infiltration of inflammatory cells (Fig. 8d), the secretion of IL-6 (Figs. 8i, 16.6%, P = 0.01), and the protein expression of cGAS and STING in the lung tissue of IAV-infected mice (Fig. 8j-k). Unlike GUANKE, linoleic acid did not significantly inhibit the expression of inflammatory cytokines TNF-α (Fig. 8g) and IL-1β (Fig. 8h). In addition, the Western blot results showed that linoleic acid could only antagonize the down-regulation of ZO-1 (P = 0.001) and Occludin (P = 0.004) caused by influenza infection, but did not significantly improve the down-regulation of Claudin-5 (Fig. 8e-f).
Fig. 8
Exogenous supplementation of the metabolite linoleic acid exerts a protective effect on IAV-infected mice. Change in body weight over time after exogenous linoleic acid supplementation in IAV-infected mice (a). Body temperature (b) and lung index (c) were measured on day 7 post-infection. Images of representative pathological changes (d) in the lung tissue of three groups of mice on day 7 post-infection. Changes in the expression of tight junction proteins ZO-1, Occludin and Claudin-5 (e and f), TNF-α (g), IL-1β (h), IL-6 (i), cGAS and STING (j and k) in lung tissue after 7 days of linoleic acid treatment of IAV-infected mice. The data are presented as means ± SEM. Statistical analysis was performed using two-tailed Student’s t-test or One-way ANOVA (P ≤ 0⋅05, *, P ≤ 0⋅01, **, P ≤ 0⋅001, ***, P ≤ 0⋅0001, ****, ns = non-significant)
Linoleic acid inhibits the secretion of IL-6 and promotes the expression of tight junction proteins in IAV-infected mice by regulating mitochondrial oxidative phosphorylation and mitophagyTo further explore whether linoleic acid plays a protective role by influencing mitochondrial function in the same way as GUANKE, we first assessed the expression of oxidative phosphorylation-related genes and proteins in the lung tissue of linoleic acid-treated mice. We found that compared with the Virus group, the expression of oxidative phosphorylation-related genes (Fig. 9a) in the lung tissue of mice treated with linoleic acid was significantly up-regulated, and the expression of oxidative phosphorylation-related proteins (Fig. 9b-c) was significantly up-regulated except for MTCO2. Similar to GUANKE, Oligomycin A treatment had no significant effect on the body weight of IAV-infected and linoleic acid-treated mice (Fig. 9d), while linoleic acid was no longer effective in antagonizing the infection-induced decrease in body temperature (Fig. 9e), increase in lung index (Fig. 9f), and decrease in expression of barrier proteins (Fig. 9h-i). Linoleic acid was also no longer effective in reducing the secretion of inflammatory factors TNF-α (Fig. 9j), IL-1β (Fig. 9k), and IL-6 (Fig. 9l) as well as in reducing the infiltration of inflammatory cells in lung tissue (Fig. 9g). Further evaluation of the mitochondrial structure and function of the lung tissue of the linoleic acid-treated mice showed that the number of swollen mitochondria in the lung tissue of the linoleic acid group was significantly reduced (Fig. 10a), and the mitochondrial length/width ratio value (Fig. 10b) was closer to that of the Control group of mice. The qRT-PCR (Fig. 10c), WB (Fig. 10d-e), and IHC (Fig. 10f-g) results also showed that linoleic acid intervention could significantly increase the expression of TOM20 and TFAM as effectively as GUANKE. Next, we evaluated the effect of mitophagy on the treatment of IAV-infected mice with linoleic acid. The results of WB (Fig. 11a-b) and IF (Fig. 11c) showed that the expressions of Pink, Parkin, and LC3Ⅱ were significantly increased, and the expressions of Mfn2 and P62 were significantly decreased in the lung tissues of IAV-infected mice after receiving linoleic acid treatment. Administration of the inhibitor 3-MA to the linoleic acid-treated mice had no significant effect on the body weight (Fig. 12a), but made the ability of linoleic acid to restore body temperature (Fig. 12b), to reduce lung index (Fig. 12c), and to antagonize the down-regulated expression of tight junction proteins ZO-1 and Occludin no longer significant (Fig. 12e-f). The results of ELISA (Fig. 12g-i) and HE (Fig. 12d) also showed that compared with the Virus-3MA group, the secretion of IL-6 and the infiltration of inflammatory factors in the lung tissue of mice in the Linoleic acid-3MA group were not significantly reduced.
Fig. 9
Oligomycin A antagonizes the protective effect of linoleic acid on IAV-infected mice. Expression of oxidative phosphorylation-related genes at the transcriptional (a) and translational (b-c) levels. The change in mouse body weight was measured daily (d). The body temperature (e) was recorded and the lung index (f) was calculated on day 7 post-infection. Representative pathological changes in the lung tissue of each group of mice are presented (g). Changes in the expression of tight junction proteins (h and i), TNF-α (j), IL-1β (k), and IL-6 (l) in mouse lung tissue on day 7 post-infection. The data are presented as means ± SEM. Statistical analysis was performed using two-tailed Student’s t-test or One-way ANOVA (P ≤ 0⋅05, *, P ≤ 0⋅01, **, P ≤ 0⋅001, ***, P ≤ 0⋅0001, ****, ns = non-significant)
Fig. 10
Linoleic acid treatment improves mitochondrial quality in the lung tissue of IAV-infected mice. The representative TEM images (a) and mitochondrial length/width ratio in TEM images (b) in the lungs. The blue arrows point to normal mitochondria, the yellow arrows point to swollen mitochondria, and the red arrows point to mitochondrial autophagosomes. The mRNA levels of the Tfam, Tom20, and Pgc-1α in the mouse lung on day 7 post-IAV-infection (c). The protein levels (d and e) and IHC staining (f and g) of the TFAM and TOM20 in the mouse lung on day 7 post-IAV-infection. The data are presented as means ± SEM. Statistical analysis was performed using two-tailed Student’s t-test or One-way ANOVA (P ≤ 0⋅05, *, P ≤ 0⋅01, **, P ≤ 0⋅001, ***, P ≤ 0⋅0001, ****, ns = non-significant)
Fig. 11
Oral administration of linoleic acid enhances the level of mitophagy in lung tissue of IAV-infected mice. The protein expression levels of Pink, Parkin, Mfn2, LC3Ⅱ/Ⅰ, and P62 (a-b). Representative IF micrographs (c) of LC3Ⅱ and P62 immunofluorescence staining in the mouse lung tissue on day 7 post-infection. The data are presented as means ± SEM. Statistical analysis was performed using two-tailed Student’s t-test or One-way ANOVA (P ≤ 0.05, *, P ≤ 0.01, **, P ≤ 0.001, ***, P ≤ 0.0001, ****, ns = non-significant)
Fig. 12
The protective effect of linoleic acid in IAV-infected mice is attenuated by the inhibitor 3MA. Changes in body weight after infection with IAV (a). The body temperature (b) and lung index (c) on day 7 post-infection. Images of representative pathological changes in the mouse lung tissue on day 7 post-infection (d). Effect of the mitophagy inhibitor 3MA on the expression of tight junction proteins (e and f), TNF-α (g), IL-1β (h), and IL-6 (i) in the mouse lung tissue on day 7 post-infection. The data are presented as means ± SEM. Statistical analysis was performed using two-tailed Student’s t-test or One-way ANOVA (P ≤ 0.05, *, P ≤ 0.01, **, P ≤ 0.001, ***, P ≤ 0.0001, ****, ns = non-significant)
Comments (0)