Cell culture and chemicals
HEK293T and HeLa cells were obtained from ATCC and cultured in DMEM supplemented with 10% FBS and 1% penicillin/streptomycin at 37 °C in a 5% CO₂ incubator. Panc-1 cells were obtained from ATCC and cultured in RPMI-1640 supplemented with 10% FBS and 1% penicillin/streptomycin at 37 °C in a 5% CO₂ incubator. MG132 (Z-Leu-Leu-Leu-al, proteasome inhibitor) [48], chloroquine (CQ), cycloheximide (CHX), and hydroxyurea (HU) were purchased from Sigma-Aldrich (USA).
RNA interference and quantitative RT-PCR
Cells were transfected with the indicated siRNAs using RNAiMAX (Invitrogen, USA) or TransIT-X2 (Mirus Bio) according to the manufacturer’s instructions. siRNAs against human DDB1, CSN4, CSN5, CSN6, or negative control were purchased in smartpool format from Dharmacon (USA). For qRT-PCR, total RNA was extracted using HiGene Total RNA prep kit (Biosesang, Seoul, Korea) and reverse-transcribed with RT kit (One Step SYBR PrimeScript RT-PCR kit, TaKaRa-bio, Japan). qRT-PCR was performed with SYBR Green master mix on a QS3 (Applied Bioscience, USA) using primers specific for CSN4, DDB1, and beta-actin as an internal control. Relative expression was calculated by the ΔΔCt method and presented relative quantity (RQ) values. Primer sequences are listed in Supplementary Table 1.
Clonogenic assay
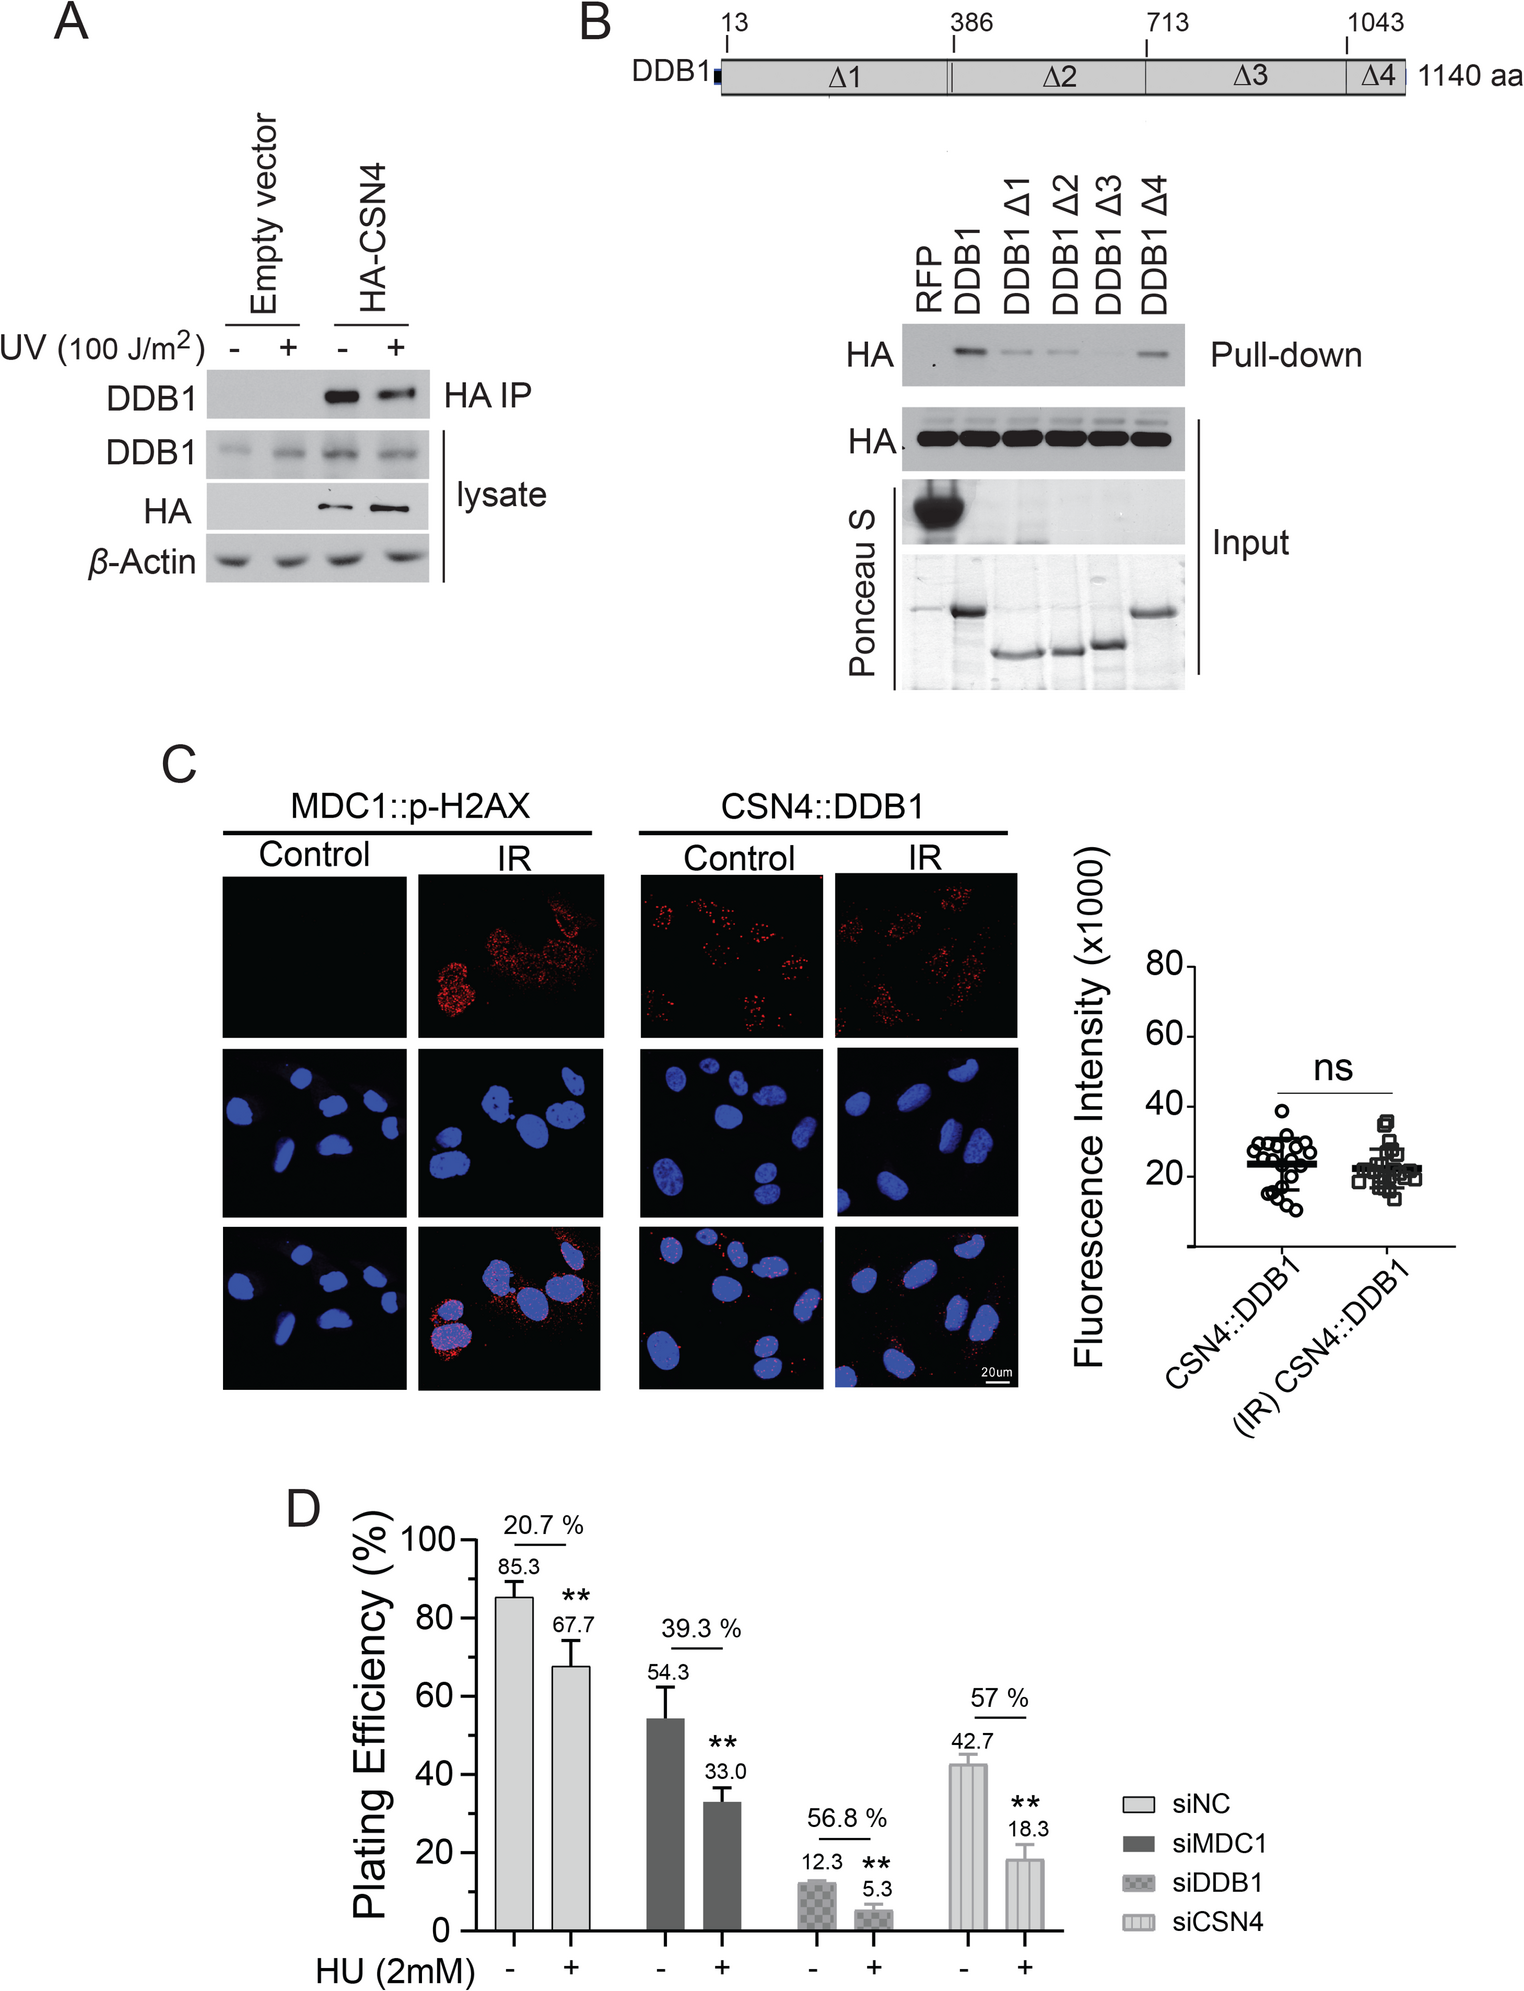
HeLa cells were seeded at 200–500 cells per well in 6-well plates and treated with 2 mM hydroxyurea for 2 h. After treatment, the medium was replaced with a fresh medium, and cells were incubated for 10 days. Colonies containing more than 50 cells were counted. Colony formation efficiency was calculated as the percentage of colonies formed relative to the number of initially plated cells. Each experiment was performed in triplicate and independently repeated twice. Data are presented as mean ± standard deviation.
Protein purification, pull-down assay, and Immunoprecipitation
N-terminally Strep-tagged DDB1 WT and mutant proteins were expressed in Sf9 insect cells using recombinant baculovirus and purified using Strep-Tactin affinity chromatography. Briefly, Sf9 cells were infected with the appropriate baculovirus constructs and harvested 48–72 h post-infection. Cell pellets were lysed in ice-cold lysis buffer (50 mM Tris-HCl pH 7.5, 150 mM NaCl, 1 mM EDTA, 1% NP-40, and protease inhibitor cocktail), and cleared lysates were incubated with Strep-Tactin Sepharose beads for 2 h at 4 °C. Beads were washed extensively with wash buffer (50 mM Tris-HCl pH 7.5, 150 mM NaCl) to remove non-specifically bound proteins.
For the pull-down assay, equal amounts of bead-bound Strep-tagged WT or mutant DDB1 proteins were incubated with lysates from HEK293T cells transiently transfected with HA-CSN4. Binding reactions were carried out for 2 h at 4 °C with gentle rotation. After incubation, beads were washed three times with wash buffer, and bound proteins were eluted by boiling in SDS sample buffer. Eluted samples were subjected to SDS-PAGE and immunoblotting with anti-HA and anti-DDB1 antibodies to assess the interaction between DDB1 and CSN4.
To immunoprecipitate proteins, cells were lysed in lysis buffer (50 mM Tris-Cl, pH 7.5, 150 mM NaCl, 1% Triton X-100, 1 mM EDTA, and 1 mM EGTA) supplemented with protease and phosphatase inhibitors. Lysates were incubated with anti-FLAG M2 affinity gel (Sigma-Aldrich, USA) or anti-HA magnetic beads for at least 3 h at 4 °C. The precipitates were washed four times with lysis buffer and finally eluted by boiling in SDS sample buffer for immunoblot analysis.
Proximity ligation assay (PLA)
PLA was performed using the Duolink® In Situ Red Starter Kit (Sigma-Aldrich, USA). Cells grown on coverslips were fixed, permeabilized, and blocked prior to incubation with primary antibodies against MDC1 (Abcam, USA), p-H2AX (Millipore, USA), CSN4 (Proteintech, USA), and DDB1 (Santa Cruz, USA). The PLA’s probing, ligation, and amplification steps followed a previously described protocol [28]. Red fluorescent signals were visualized by fluorescence microscopy and quantified using ImageJ.
Immunoblotting and immunocytochemistry
The following primary antibodies were used for immunoblotting: anti-DDB1, anti-FBXW7, anti-RFP, and anti-Ambra1 (Proteintech, USA); anti–β-actin, anti-Skp2, anti-Skp1, anti–phospho-Chk1, and anti-FLAG (Cell Signaling Technology, USA); anti-HA (Roche, Switzerland); anti–α-tubulin, anti-Chk1, anti-CSN6, and anti-ubiquitin (Santa Cruz Biotechnology, USA); anti-CSN4, anti-Cul4a, and anti-CSN5 (Bethyl Laboratories, USA); anti-DDB2 (Bosterbio, USA); anti-CSN6 (Santa Cruz Biotechnology, USA); and anti-SOCS2 (Abcam, UK). HRP-conjugated secondary antibodies (Bio-Rad, USA) were used, and signals were detected using enhanced chemiluminescence (ECL) reagents. Signals were visualized either by film exposure or using a chemiluminescence imaging system (e.g., Bio-Rad ChemiDoc MP) and visualized on LAS 4000 (Fujifilm, Japan).
For immunofluorescence staining, cells were fixed with 4% paraformaldehyde, permeabilized with 0.25% Triton X-100, and blocked with 1% BSA in PBS. Primary antibodies used were anti-CSN4 (Proteintech), anti-DDB1 (Santa Cruz Biotechnology, USA), and anti-LC3 (Cell Signaling Technology, USA). After washing three times with PBS with 0.03% tween20, cells were incubated for 1 h at room temperature with Cy3- or FITC-conjugated secondary antibodies (Jackson ImmunoResearch, USA). Cells were mounted with Vectashield containing 4′,6-diamidino-2-phenylindole (Vector Laboratories, USA). Images were obtained using a Zeiss LSM 710 confocal microscope (Carl Zeiss, Germany). Fluorescence quantification for immunocytochemistry (ICC) was performed using ImageJ. For each condition, five images were collected from three independent experimental sets (5 images per experimental set). DDB1 and LC3 fluorescence intensities were measured using identical exposure and threshold settings across all images. The resulting values were averaged, and the data are presented as mean ± standard deviation. In the quantification graphs, green bars represent DDB1 fluorescence intensity and red bars represent LC3 fluorescence intensity.
In vivo ubiquitination assay
Cells were transfected as described above. MG132 (10 µM) was added 5 h before cell lysis. Cells were lysed in RIPA buffer (50 mM Tris-HCl, pH 7.4, 150 mM NaCl, 1% NP-40, 0.5% sodium deoxycholate, 0.1% SDS) supplemented with a protease inhibitor cocktail, N-ethylmaleimide (20 µM), and iodoacetamide (5 mM final concentration), followed by incubation on ice for 30 min with occasional gentle mixing. Lysates were clarified by centrifugation at 16,000 × g for 15 min at 4 °C. Supernatants were incubated with anti-HA magnetic beads (Thermo Fisher Scientific, USA) at 4 °C for 3 h with rotation. Beads were washed three times with cold lysis buffer, and immunoprecipitated proteins were eluted with 2× SDS sample buffer, followed by SDS-PAGE and Western blotting.
Comet assay
Comet assay was performed as described in the manufacturer’s instructions (Cell Biolabs, San Diego, CA, USA). Briefly, endogenous DDB1 was depleted with siRNA and rescued with WT DDB1 or DDB1 K1131R. We further treated puromycin to exclude the untransfected cells and subjected them to DNA damage induction. The images were obtained using a fluorescence microscope and analyzed by calculating the length and fraction of DNA within the “tail” of a comet by multiplying the tail length by the percentage of DNA in the tail.
Cell cycle analysis
Cells were harvested using trypsin-EDTA and resuspended in PBS containing 0.1% BSA. Aliquots (500 µl at 5 × 10⁶ cells/ml) were transferred to conical tubes, and 5 ml of cold 70% ethanol was added dropwise with gentle vortexing. Cells were fixed overnight at 4 °C, washed twice with PBS, and resuspended in 1 ml of propidium iodide solution (20 µg/ml; Molecular Probes, USA) containing RNase A (0.5 µg/ml; Molecular Probes, USA). Samples were incubated for 4 h at 4 °C and analyzed for DNA content using a FACSymphony A5 SE flow cytometer (BD Biosciences, USA).

Comments (0)