
Remember me
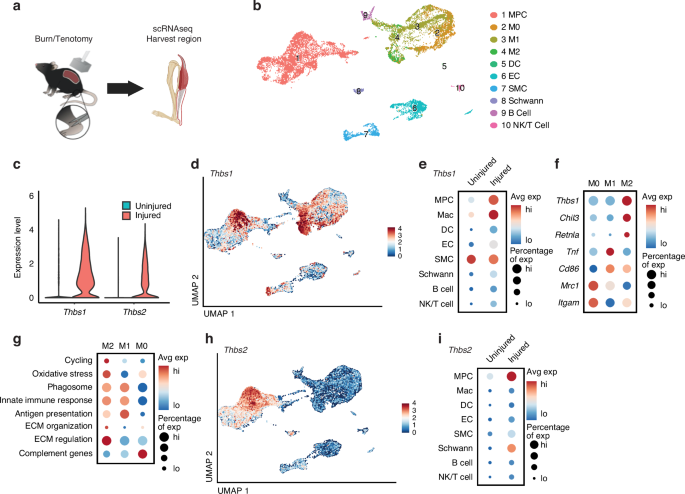
To investigate the transcriptional changes occurring within the musculoskeletal injury site during HO formation and progression, we revisited previously published single-cell RNA sequencing (scRNA-seq) datasets generated in our laboratory utilizing a well-characterized mouse model involving a burn/tenotomy (B/T) injury where mice undergo a 30% total body surface area dorsal burn and full Achilles tendon transection without repair.8,9,23,24,25,26,27,28,29,30,31,32 Cells were harvested from the tendon injury site at four-time points (uninjured, 3, 7, and 21 days after injury) for analysis (GSE12606) (Fig. 1a). To explore the potential differential expression of genes involved in ECM signaling, we examined the expression of TSP1 and TSP2 (Thbs1 and Thbs2). Our findings demonstrate significant upregulation of Thbs1 and Thbs2 in response to a B/T injury, underscoring their potential roles in ECM signaling during HO formation (Fig. 1b, c). In addition, to explore whether this thrombospondin signature is conserved in human HO, we reanalyzed a published microarray dataset (GSE94683) comparing bone marrow-derived MPCs from neurogenic HO patients to healthy donors.33 Notably, Thbs1 and Thbs2 were significantly upregulated in the HO derived MPCs compared to healthy donors (THBS1 logFC = 0.892 521, P = 0.000 1; THBS2 logFC= 0.844 618, P = 0.007 7, mirroring our murine results and highlighting a potential cross-species relevancy (Fig. S1C).
Fig. 1
Mesenchymal progenitor cells (MPCs) and M2-like macrophages express TSP2 and TSP 1, respectively, after injury. a Schematic of burn/tenotomy injury site collected for single cell RNA sequencing (scRNAseq). b UMAP of cells collected from injury site 0,3,7, and 21 days after injury. c Violin plot of Thbs1 and Thbs2 from uninjured (day 0) mice and injured mice. d Feature plot of Thbs1 expression. e Dot plot of Thbs1 expression in uninjured and injured mice across all clusters. f Dot plot of Thbs1 and macrophage markers for M0 (Mrc1, Itgam), M1(Tnf, Cd86), and M2(Chil3, Retnla). g Dot plot of Thbs1 expression and macrophage paths markers enriched at the HO site. h Feature plot of Thbs2 expression. i Thbs2 expression in uninjured and injured mice across all clusters
Thbs1 transcripts were most highly expressed in macrophage populations at the injury site, with the highest levels observed three days after injury (Figs. 1d, e and S1B–E), consistent with the time point with the highest macrophage population after injury.24Thbs1 expression was also detected in the MPC population, however, to a lesser extent. Within the macrophage subpopulations defined through MacSpectrum,34Thbs1 expression was highest among M2-like anti-inflammatory macrophages (Fig. 1f). These macrophages are known for their capacity to promote tissue regeneration and ECM remodeling, both crucial during HO formation.1,24,32 They produce key cytokines, including TGF-β1 and VEGF-A, which facilitate MPC proliferation and differentiation into osteoblasts, essential for new bone formation.1,24,32 As recent studies have shown, macrophages do not simply conform to a static M1/M2 classification but instead exist along a flexible spectrum of activation states that are dynamically influenced by tissue-specific cues and inflammatory conditions.35 Within this spectrum, Thbs1 is particularly associated with the remodeling path (ECM organization and regulation), playing a pivotal role in ECM remodeling35 (Fig. 1g). When comparing Thbs1 expression among bone marrow, blood, and injury site cell populations 3 and 7 days after injury, the highest expression of Thbs1 was observed at the injury site (Fig. S1D–F). Specifically, Thbs1 expression was markedly elevated in tissue-resident macrophages at the injury site, suggesting a local upregulation of Thbs1 in response to injury. While circulating macrophages present in the blood also exhibited Thbs1 expression, the levels were considerably lower than levels observed at the injury site (Fig. S1G). Thbs1 expression was further decreased within macrophages from the bone marrow (Fig. S1G). These results suggest that Thbs1 expression is activated after monocytes/macrophages mobilize into circulation rather than originating in the bone marrow. Furthermore, the highest levels of Thbs1 expression were consistently found at the injury site, implying a crucial role of macrophages and possibly other local cells in upregulating Thbs1 in the local tissue environment. Taken together, the expression of Thbs1 in M2-like anti-inflammatory macrophages associated with ECM organization and remodeling at the site of HO suggests that TSP1 may play a role in resolving local inflammation and remodeling the ECM to support tissue repair and new bone formation at the injury site.
Thbs2 is expressed exclusively in MPCs related to fibrillogenesis surrounding the HO siteImmobilization is a commonly used therapy for patients after extremity trauma. It has been established that immobilization of the tenotomy site after B/T results in decreased HO volume. This immobilization also resulted in altered collagen matrix alignment and a consequent decrease in osteogenesis.8 Based on these previous findings, we next set out to examine the impact of immobilization on Thbs2 expression given its role in collagen fibrillogenesis. Differential gene expression between immobilized and mobilized mice 0, 3, and 7 days after B/T injury reveals a significant downregulation of Thbs2 in immobilized mice 7 days after injury (GSE150995) (Fig. S2A–C). Notably, Thbs2 expression was most prominently downregulated in the MPC population of immobilized mice (Fig. S2D). Thbs2 differential downregulation in immobilized mice suggests that mechanical forces may play a role in regulating Thbs2 expression. Given the known roles of TSP2 in regulating ECM dynamics, inflammation, and cell differentiation, this observation prompted us to further investigate the expression and role of Thbs2 over the course of HO development.
Upon querying Thbs2 transcripts in our dataset of cells harvested from the B/T injury site 0, 3, 7, and 21 days after injury, we found that Thbs2 was almost exclusively and most highly expressed among the pre-HO progenitor population of MPCs (Fig. 1h, i). At day 7 after injury, Thbs2 expression peaks in MPC populations (Fig. S1F). Given these scRNAseq-based insights in Thbs2 expression, we next utilized a TSP2-eGFP reporter system to spatially characterize TSP2-eGFP expression at the HO site at timepoints leading up to the mineralization phase.36 Fluorescent microscopy demonstrated that TSP2-eGFP signal significantly increased on day 7 and 21 after injury around the HO site and tendon when compared to uninjured contralateral legs collected at the same time point (Figs. 2a, b and S3A–C). This TSP2-eGFP signal was highest on day 7, which is consistent with our scRNAseq findings of maximal Thbs2 expression 7 days after injury (Fig. 2c). We confirmed the presence of TSP2+ MPCs at the injury site 1 week after injury by containing the HO injury site for the MPC marker platelet-derived growth factor receptor-alpha (PDGFRa) (Fig. 2d, e). We observed a significant percentage of PDGFRα+ TSP2+ cells at the HO injury site, consistent with our scRNA-seq findings that MPCs are a major source of TSP2 (Fig. 2d, e). To highlight the onset of endochondral ossification at the HO anlagen, the same set of samples were also stained for the chondrogenic transcription factor SRY-Box Transcription Factor 9 (SOX9) and the hypertrophic chondrocyte/osteoprogenitor marker Osterix (OSX). This staining revealed an increase in SOX9+ and dual SOX9+ TSP2+ cells in injured limbs 7 days after injury, consistent with the active process of endochondral formation and chondrocyte differentiation (Fig. 2d, f).1 OSX+ cells were also observed at the site with no significant difference between injured and uninjured limbs observed. Dual OSX+ TSP2+ cells were rarely observed (Fig. 2d, j). Our results show Thbs2 is predominantly expressed in MPCs associated with HO formation, and TSP2 signal is appreciated around the HO anlagen, suggesting that TSP2+ MPCs are not only present, but likely contribute to the dynamic changes in the ECM environment required for bone formation.
Fig. 2
Temporal expression and localization of TSP2 following injury. a Schematic of HO anlagen after B/T injury; dashed boxes indicate IF region of interest (ROI). Letters correspond to magnified panels. b Representative tile scans and magnified regions from TSP2eGFP reporter mice at day 0, 7, and 21. White dashed lines outline anatomical areas (Ten = Achilles tendon, Calc = calcaneus, HO = HO anlagen). c Quantification of TSP2⁺ cells in ROI (percentage of all cells). Ordinary one-way ANOVA comparing uninjured, day 7, and day 21; n = 3 mice/group, 2–3 images/mouse. d IF of TSP2eGFP reporter mice at day 7 for PDGFRα, SOX9, and OSX. White dashed line = HO anlagen border. e–g Quantification of PDGFRα⁺, SOX9⁺, and OSX⁺ cells, and their overlap with TSP2⁺ cells, in uninjured vs day 7 mice (percentage of total cells in ROI). n = 3 mice/group, 2–3 images/mouse. ****P < 0.000 1, ***P < 0.001, **P < 0.01, *P < 0.05
Spatial transcriptomics reveals Thbs1 and Thbs2 expression within and surrounding the HO anlagen, respectivelyIn musculoskeletal injuries, the spatial context of gene expression patterns is critically important to understand, given the substantial variability in function across anatomic regions. Therefore, we next utilized spatial transcriptomics using the Visium platform to characterize Thbs1 and Thbs2 expression at the tenotomy injury HO site.27
We manually defined spatial spots to their corresponding tissue types on the H&E-stained histological slide using morphological landmarks27 (Fig. 3a–c). Leveraging our scRNAseq data, we set out to map the anatomical relationship of macrophage and MPC populations to the HO anlagen. Prediction scores, which correspond to the likelihood of macrophage or MPCs existing at each spot, were calculated (Fig. 3d, e). Those values were used to define cell-type positive or negative spots (i.e., MPC-positive vs MPC-negative) (Fig. S4A–F). Prediction scores for macrophage cells were highest at the HO anlagen and at the enthesis/tendon and bone regions. MPC prediction scores were high at the injury site but notably absent from the HO anlagen, where the beginning stages of endochondral ossification are observable. We then analyzed the expression patterns of Thbs1 and Thsb2 across these spots. As expected, given our scRNAseq findings, spots defined as positive for macrophage cells had a high expression of Thbs1, while MPC-positive spots were high for Thbs2 expression (Fig. 3f).
Fig. 3
Spatial transcriptomic analysis reveals Thbs1/2 expression patterns and cell type distributions relative to HO anlagen. a H&E histology section of injured leg day 7 after B/T injury. b Zoom representing magnified H&E region of interest (ROI). c H&E labeled for tendon, enthesis, injury, HO anlagen, bone, fat and skin. d Prediction scores for likelihood myeloid cells present in spatial dot. e Prediction scores for likelihood MPC cells present in spatial dot. f Dot plot of Thbs1 and Thbs2 across spatial dots defined as either macrophage (Mψ) and MPCs. g H&E superimposed with distance score from HO anlagen. h Spatialtime analysis of macrophage (Mψ) and MPC scores across scaled distance from HO site. Dashed line represents HO anlagen border. i Spatialtime analysis of Thbs1 and Thbs2 expression from HO anlagen. Dashed line represents HO anlagen border
To evaluate the spatial distribution of cell types within and around the HO anlagen, we analyzed cell type prediction scores in relation to SpatialTime, a distance-based metric where lower SpatialTime corresponds to spots closer in proximity to the HO anlagen37(Fig. 3g). Within the HO anlagen, we observed a high prediction score for macrophages and a low prediction score for MPCs. At the HO anlagen border, this relationship is reversed, and the likelihood of MPC presence significantly increases (Fig. 3h). This inverse distribution indicates the potential existence of a macrophage-MPC axis, where macrophages predominate at the HO anlagen, while MPCs largely exist at the perimeter. We also examined the relative expression levels of Thbs1 and Thbs2 across SpatialTime and observed a similar inverse expression pattern of the distribution of macrophage and MPCs. The relative expression of Thbs1 was found to be highest at the HO anlagen, steadily decreasing as SpatialTime increased. Conversely, Thbs2 showed limited expression at the HO anlagen, but increased significantly as SpatialTime increased, peaking before decreasing again (Fig. 3i). These results highlight distinct spatial patterns of Thbs1 and Thbs2 expression, with Thbs1 concentrated at the HO anlagen with macrophages and Thbs2 predominantly expressed in regions surrounding the injury with MPCs, suggesting specialized roles in local tissue remodeling and repair.
TSP1 and 2 coordinate MPC fate and extracellular matrix remodeling following injuryTo investigate the role of Thbs1 and Thbs2 in MPC differentiation during tendon injury response, we conducted a pseudotime analysis within the MPC niche using Monocle3. Along the trajectory, three distinct clusters were identified: General MPCs, ECM remodeling MPCs, and Proliferative MPCs (Fig. 4a, b). In uninjured tendon, MPCs predominantly progressed towards a proliferative terminal differentiation, reflecting a homeostatic state focused on tissue maintenance.38 Conversely, MPCs from injured tendons shifted their differentiation trajectory towards the ECM remodeling lineage (Fig. 4c). This shift indicates that injury prompts MPCs to engage in tissue repair processes following HO induction that involve significant ECM synthesis and remodeling.39Thbs1 and Thbs2 expression across MPC trajectory demonstrates a striking divergence between uninjured and injured groups (Fig. 4d, e). In injured MPCs, both Thbs1 and Thbs2 exhibited pronounced upregulation, peaking at the latest stages of differentiation. In contrast, uninjured MPCs maintained a relatively stable and low expression levels of these genes throughout the trajectory.
Fig. 4
TSP1/2-driven ECM remodeling guides MPC differentiation. a Pseudotime clusters of MPCs (ECM remodeling, proliferative, general). b MPC pseudotime trajectory. c Uninjured vs. injured trajectories. d, e Thbs1 & Thbs2 regression in uninjured vs. injured MPCs. f FUBP1 binding motif. g Fubp1 regression plot. h Fubp1 regulatory network. i RTqPCR of MPCs transfected with control or Fubp1 siRNA Fubp1 & Thbs2 expression (Gapdh control, 48 h). j Anatomical schematic of SHG sites. k SHG of collagen fibrils in tendon and HO from WT and DKO mice. l AU quantification: tendon P < 0.000 1, HO site P = 0.008 1 (n = 3/group)
Given that Thbs2 is particularly enriched in MPCs, especially shortly after injury, we focused further analysis on Thbs2 covariant module analysis using pseudotime to gain deeper insights into the transcriptional networks regulating Thbs2 associated ECM remodeling in MPCs (Fig. S5C). The gene set derived from co-regulation network analysis identified genes associated with ECM organization and remodeling including Col12a1, Col27a1, Plod2, and Mmp13 (Fig. S5D). Transcription factor (TF) motif analysis was performed to identify potential regulatory proteins that drive the coordinated expression of the identified gene set, providing insights into the upstream signals governing ECM remodeling. This analysis identified Far Upstream Element Binding Protein 1 (FUBP1) as a highly probable regulator of Thbs2 in MPCs (Fig. 4f–h). Following siRNA-mediated Fubp1 knockdown in MPCs derived from the tendon injury site, Fubp1 transcript levels decreased by over 50%. In parallel, Thbs2 expression was reduced by approximately 25% compared to negative control (Fig. 4i). To further explore this relationship, we examined RNA-seq data from Fubp1- knockout mice and a CRISPR-engineered RPE1 cell line carrying the cancer-associated A38D point mutation, disrupting FUBP1’s interaction with the splicing factor U2AF2 and impairs efficient splicing of long introns.40 In both models, Thbs2 expression was significantly reduced, consistent with a broader role for FUBP1 in regulating Thbs2 expression (Fig. S5E).
Loss of TSP1 and 2 disrupts matrix structure dynamics and inhibits HO in vivoTo further investigate the importance of thrombospondin in MPC and macrophage-mediated ECM organization and HO development, we utilized TSP1 and TSP2 double knockout (TSP1/2 DKO) mice. Using age- and sex-matched C57BL/6 mice as wild-type (WT) controls, we conducted our B/T model on both genotypes and performed quantitative analyses of tissue organization and bone formation (Fig. 4j). Six weeks post-injury, we employed second harmonic generation (SHG) microscopy to visualize ECM collagen organization along the injured Achilles tendon and at the HO anlagen. The SHG microscopy revealed notable differences in collagen fibril organization between DKO and WT mice (Fig. 4k, l). In WT mice, collagen fibers were more aligned and organized with a higher anisotropy (AU), reflecting a structured ECM conducive to proper bone formation and tissue repair. In contrast, DKO mice displayed a more disorganized distribution of collagen fibrils, with less alignment demonstrated by a lower AU and more random orientation throughout the hindlimb (Fig. 4k, l). This disorganization suggests that TSP1 and TSP2 are critical in maintaining ECM integrity and alignment throughout the healing process, and when both TSP1 and TSP2 are absent, organization is significantly disrupted.
Furthermore, micro-computed tomography (microCT) imaging was used to quantify bone formation in TSP1/2 DKO mice versus WT mice post-injury. Our B/T model predictably induces HO in four distinct anatomical regions: the calcaneus, tibia, distal residual Achilles tendon, and proximal residual tendon, nine weeks following injury.8,9,23,24,25,26,27,28,29,30,31,32 Compared to WT mice, TSP1/2 DKO mice exhibited a significant decrease in HO volume, with almost no HO formation observed in the distal and proximal residual tendons (Fig. 5a–d). No significant difference was observed between WT and DKO mice in tibial length or thickness in our model (Fig. S6A–D). Histological analysis of DKO mice revealed significant differences in tissue organization compared to control mice. In control mice, a distinct HO anlagen can be identified, characterized by PDGFRα+ cells surrounding the perimeter of the differentiating SOX9+ cells. In contrast, DKO mice did not exhibit this organized perimeter of PDGFRα+ cells, resulting in in a disrupted and disorganized distribution of dual positive PDGFRα+ SOX9+ cells at the HO anlagen (Fig. 5e–g). TSP1 and 2 signaling is critical for osteogenesis in our model and plays an essential role in HO formation in collagen-rich areas like tendon.
Fig. 5
TSP1/2 deletion reduces HO volume and alters MPC distribution. a 3D micro-CT of WT and TSP1/2 DKO mice 9 weeks post–burn tenotomy (green = proximal tendon HO, red = distal tendon HO, blue = calcaneal HO). b–d Quantified HO volume: total (P = 0.013 0), tendon (P = 0.000 6), and bone-associated (P = 0.024 1); n = 9/group. e WT micro-CT with ROI (white box) shown in IF. f IF staining for Hoechst, PDGFRa, and SOX9 in control vs. DKO. g Quantification of PDGFRα+ SOX9+ cells/total PDGFRa+ cells (P < 0.000 1, n = 2–3/group). h IF of injured hindlimbs (7 days) showing PLOD2, MMP14, LOXL2. i Quantification of PLOD2+, MMP14+ and LOXL2+ cells in total cells; n = 3/group
To investigate the molecular mechanisms underlying the disorganized ECM phenotype observed in TSP1/2 DKO mice, we first analyzed baseline transcriptional changes in the uninjured Achilles tendon. Bulk RNA-sequencing revealed downregulation of several matrisome-associated genes in DKO mice compared to WT, including Thbs1, Thbs2, (confirming knockdown) Plod2, Spp1, and Alox12, while expression of major fibrillar collagens remained unchanged (Fig. S6E). KEGG pathway enrichment of differentially expressed genes revealed suppression of ECM-receptor interactions and focal adhesions signaling pathways (Fig. S6F). Spp1 (osteopontin) is a mineral-binding glycoprotein involved in early matrix remodeling and ossification.41,42Spp1 downregulation may reflect impaired osteogenic matrix priming and defective mineralization signaling. Plod2 encodes lysyl hydroxylase 2, which catalyzes collagen crosslinking, and is essential for stabilizing newly deposited matrix during tissue repair and previously implicated in HO formation.27Alox12, a lipoxygenase, modulates inflammation and redox signaling in the wound environment, and has been implicated in mesenchymal differentiation and tissue remodeling.43,44 together suggesting impairment in ECM stabilization and inflammatory remodeling pathways. To evaluate how this baseline deficit affects the injury response, we performed immunofluorescence staining for the collagen crosslinking enzymes LOXL2 and PLOD2, and the matrix-remodeling protease MMP14, at day 7 post-injury.27,45,46,47 All three markers were significantly reduced in DKO tissues compared to WT controls (Fig. 5h–j), indicating that TSP1 and TSP2 are required for proper upregulation of ECM remodeling enzymes during the early repair phase.
Together, these findings support a model in which thrombospondin signaling coordinates the structural organization of the early HO anlagen, enabling the proper orchestration of MPC differentiation and osteogenesis. In the absence of TSP1 and TSP2, ECM remodeling is impaired, resulting in a disorganized matrix that fails to support robust osteogenic differentiation, particularly along the Achilles tendon. Thus, Thbs1 and Thbs2 play essential roles in mature MPCs and the matrix environment required for ectopic bone formation following injury.
Comments (0)