Animals models
The study utilized various mouse genotypes, including C57BL/6J (WT), SM/J, PPRCol2aERT2−/−, PPROCN−/−, and Slit3OCN−/−. WT young mice (#000664, 2–3 months of age) and SM/J mice (#000687) were purchased from the Jackson Laboratory in USA. WT aged mice (22 months of age) were obtained from the National Institute on Aging in USA. The Pth1r(PPR) flox/flox mice were obtained from H. Kronenberg at Massachusetts General Hospital, located in Boston, MA, USA. The Osteocalcin(OCN)-Cre mouse line was contributed by Thomas L. Clemens at Johns Hopkins University, located in Baltimore, Maryland, USA. We also acquired the Slit3 flox/flox mouse line from Jung-Min Koh at University of Ulsan College of Medicine, located in Songpa-Gu, Korea. To confirm genotypes, we performed polymerase chain reaction (PCR) analysis. This analysis involved extracting genomic DNA from the tails of the mice and utilizing a set of specific primers.
Pth1r Forward: 5′- TGGACGCAGACGATGTCTTTACCA -3′,
Pth1r Reverse: 5′- ACATGGCCATGCCTGGGTCTGAGA -3′;
Osteocalcin Transgene Forward: 5′- TCCTCAAAGATGCTCATTAG -3′,
Osteocalcin Transgene Reverse: 5′- GTAACTCACTCATGCAAAGT -3′,
Osteocalcin Internal positive control Forward: 5′- CAAATAGCCCTGGCAGAT -3′,
Osteocalcin Internal positive control Reverse: 5′- TGATACAAGGGACATCTTCC -3′;
Slit3 Forward: 5′-GATTCTAAGAGCCTGCTTAG -3′,
Slit3 Reverse: 5′-GACACTGGAGCGTAGGACTCC -3′.
In this study, Lumbar Spine Instability (LSI) surgery was conducted on adult male mice aged between 2 to 3 months. The mice groups included WT, PPROCN−/−, and Slit3OCN−/− genotypes. Anesthesia was induced by administering ketamine 100 mg/kg and xylazine 10 mg/kg intraperitoneally. For the LSI model, the L3–L5 spinous processes and the supraspinous and interspinous ligaments were surgically removed. For the sham procedure, only the posterior paravertebral muscles from the L3–L5 vertebrae were detached, without affecting the spine’s stability. Post-surgery, all mice were housed and cared for at the animal facility of The Johns Hopkins University School of Medicine. PTH (1-34, H-4835.0005, Bachem) treatment was intraperitoneally administered (40 µg/kg/d) for 2 weeks, 1 month, or 2 months. The animal protocol was approved by the Institutional Animal Care and Use Committee of Johns Hopkins University, Baltimore, MD, USA.
Micro CT
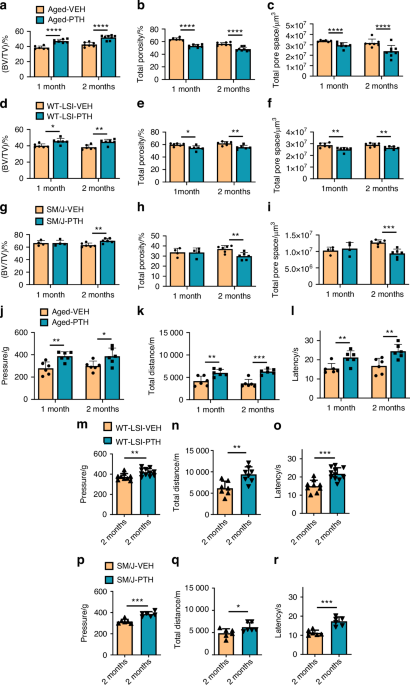
The mice in the study were humanely euthanized through an overdose of isoflurane, followed by perfusion with 1X Phosphate-Buffered Saline (PBS) and 10% buffered formalin. For evaluating the endplates, L5 segments of the lumbar spine were extracted and subjected to micro-Computed Tomography (μCT) analysis. The μCT parameters included a voltage of 55 kVp, a current of 181 μA, and a resolution of 9.0 μm per pixel, using a Skyscan 1172 system. The μCT images were processed using the NRecon v1.6 software (Skyscan) for reconstruction. Quantitative assessments of these images were carried out using the CTAn v1.9 software (Skyscan). Regarding the endplates, we chose six consecutive images of the caudal endplates of L4-L5 and the L5 vertebrae in the coronal view. These images were utilized for 3D reconstruction using the CTVol v2.0 software (Skyscan).
Pressure tolerance test
All behavioral assessments were conducted by an investigator who was blinded to the groupings of the mice. We utilized the SMALGO algometer (Bioseb) to measure pressure thresholds, which served as an indicator of pressure hyperalgesia. During the procedure, a sensor tip with a diameter of 5 mm was applied to the L4-L5 spinal region of each mouse while the mice were under gentle restraint. The pressure was incrementally increased at a rate of 50 grams per second until the mouse emitted a vocalization, indicating the threshold of pressure tolerance. The pressure force was recorded using the BIO-CIS software (Bioseb), with a maximum limit set at 500 grams to avoid causing tissue damage. Between each testing session, the mice were given a 15-min rest/recovery period. The average of these measurements was then calculated to determine the final pressure tolerance threshold for each mouse.
Active wheel test
For the assessment of spontaneous wheel-running activity, we employed specialized mouse activity wheels (BIO-ACTIVW-M model, Bioseb). This setup included software capable of tracking and recording each mouse’s activity levels within the wheel cage. Prior to the commencement of testing, mice were allowed an overnight period to acclimate to the wheel cage environment. During the testing period, the mice experienced a 12-h light/dark cycle. Each mouse was monitored for a continuous period of 48 h. Software automatically logged various parameters pertaining to movement of the activity wheel.
Hargreaves test
The Hargreaves method was employed to evaluate analgesia levels in various groups of mice. Each group of mice was first given an hour to become accustomed to the testing environment. For the test, a focused beam of radiant heat (provided by IITC Life Science Inc.) was directed onto the plantar surface of the hind paws of the mice. The response time, assessed as the time duration until the mouse withdrew its paw, was carefully measured. This response time, indicative of the latency period to the heat stimulus, was recorded for each paw. To ensure accuracy and consistency, the procedure was repeated a minimum of five times per mouse. The average of these latency times was then calculated and used for subsequent analysis.
Von Frey test
To evaluate mechanical nociception in mice, we employed a Von Frey filament-based approach. Mice were individually placed on a raised metal grid enclosed within transparent plastic chambers and allowed to habituate for a minimum of 1 h prior to testing. A calibrated monofilament exerting 0.4 g of force (BIOSEB) was applied to the plantar surface of each hind paw. The stimulus was delivered for up to 3 s or until a withdrawal response occurred. Responses included paw retraction, flinching, or licking. Each hind paw was stimulated ten times with an inter-stimulus interval of two seconds. The frequency of paw withdrawals was recorded and expressed as a percentage of total trials. Each animal underwent the test on at least three separate occasions, and the mean withdrawal frequency was computed for analysis.
Immunofluorescence staining
Upon euthanasia, bone specimens, specifically the L3-L5 lumbar spine, were harvested and immediately fixed in 10% buffered formalin for a duration of 24 h. The L1-L2 DRG tissues were isolated and fixed in 10% buffered formalin overnight. Subsequently, the bone samples underwent decalcification in 0.5 mol/L ethylenediaminetetraacetic acid at a temperature of 4 °C for 3 weeks, accompanied by constant agitation. The samples were embedded in optimal cutting temperature embedding medium (Sakura).
For histological examination, we prepared 40 μm thick spine or 10 μm thick DRG tissue sections for immunofluorescence staining following our previously reported protocol.68 The spine sections were incubated for 48 h at 4 °C with primary antibodies targeting CGRP (1:100, ab81887, Abcam), PGP9.5 (1:200, SAB4503057, Sigma), incubated overnight at 4 °C with primary antibodies targeting Osteocalcin (1:200, M188, Takara), PTH1R (1:100, ab75150, Abcam), Slit3 (1:100, AF3629, Biotechne), FoxA2 (1:100, 22474-1-AP, Proteintech), and E47 (1:100, sc-416, Santa Cruz), while the DRG sections were incubated overnight at 4 °C with primary antibodies targeting CGRP (1:100, ab81887, Abcam) and β3 tubulin (1:100, 2G10, Thermo Fisher). These were followed by the application of appropriate secondary antibodies and DAPI (1:250, H-1200, Vector) for 1 h in a light-protected environment. For the visualization and documentation of the samples, we employed both a fluorescence microscope (Olympus BX51, DP71) and a confocal microscope (Zeiss LSM 880). Quantitative analyses of the images were performed using ImageJ software (National Institutes of Health, Bethesda, MD).
Western blot
We pulverized the endplate tissue samples in a liquid nitrogen environment to facilitate the extraction of total protein. This extraction was carried out using the T-PER™ Tissue Protein Extraction Reagent (catalog number 78510, Thermo Fisher), complemented with 1% Protease and Phosphatase Inhibitor cocktail (catalog number 78442, Thermo Fisher). For cell culture lysates, we utilized RIPA buffer (catalog number 89901, Thermo Fisher), also supplemented with 1% of the aforementioned cocktail. Lysates obtained were then centrifuged and their protein concentrations standardized using the BCA Protein Assay Kit (catalog number 23227, Thermo Fisher).
The protein samples prepared were subsequently resolved by electrophoresis on a 10% SDS-PAGE gel and transferred to polyvinylidene difluoride membranes (sourced from Bio-Rad Laboratories). The membranes, post-transfer, were blocked with 5% fat-free milk and incubated overnight with specific primary antibodies at 4 °C. Following this, membranes were washed with Tris-buffered saline mixed with 0.05% Tween-20 and incubated with horseradish peroxidase-conjugated secondary antibodies.
For protein detection, we utilized an enhanced chemiluminescence kit (Thermo Fisher Scientific). A range of primary antibodies was used for this purpose, including those specific for mouse β3 tubulin (1:500, 2G10, Thermo Fisher), CGRP (1:1 000, sc-57053, Santa Cruz), PGP9.5 (1:1 000, SAB4503057, Sigma), IB4 (1:1 000, I21441, Thermo Fisher), TH (1:1 000, AB152, Sigma), Slit3 (1:1 000, AF3629, Biotechne), E47 (1:1 000, sc-416, Santa Cruz), FoxA2 (1:1 000, 22474-1-AP, Proteintech), and GAPDH (1:2 000, 14C10, Cell Signaling), which facilitated the determination of protein concentrations in the lysates.
MC3T3 cell culture
MC3T3 subclone 4 cell line was purchased from ATCC (CRL-2593TM) and cultured using Alpha Minimum Essential Medium with ribonucleosides, deoxyribonucleosides, 2 mmol/L L-glutamine and 1 mmol/L sodium pyruvate, but without ascorbic acid (A10490-01, Thermo Fisher). The osteoblast differentiation medium was supplied with 50 μg/mL ascorbic acid (Sigma) and 2 mmol/L of β-glycerophosphate (G9422, Sigma) to induce osteoblast differentiation for 3 days. PTH (1-34) was diluted in 1X PBS into different doses for cell treatment. Cells were cultured with 10% fetal bovine serum (35-011-CV, Sigma-Aldrich) at 37 °C in a 5% CO2-humidified incubator.
Primary osteoblast cell isolation and treatment
We followed the protocol reported by Chevalier.69 Clean bone was collected by flushing bone marrow from the femur and tibia of young WT mice. Cut bone pieces were digested in type1 collagenase solution (1 mg/mL) for 90 min at 37 °C in the cell incubator. The digested bone pieces were cultured in alpha MEM medium for 3 days, and refreshed every other day until the cells reached 80% confluence for passaging. The third generation of cells were seeded in 6-well plates for the treatment. Cells were stimulated in osteoblast differentiation inducing medium for 7 days, followed by PTH (100 nmol/L) or PBS treatment for 3 days. The total mRNA samples were collected for the qPCR experiments.
qPCR test
Total RNA was extracted from the spine endplate tissue or cultured cells using RNeasy Plus Mini Kit (74134, Qiagen) according to the manufacturer’s instructions. The purity of RNA was tested by measuring the ratio of absorbance at 260 nm over 280 nm. For RT-PCR, 500 ng of RNA was reverse transcribed into complementary DNA using the PrimeScript™ RT Master Mix (RR036A, Takara), then RT-PCR was performed with SYBR Green-Master Mix (Qiagen) using QuantStudio 3 Real-Time PCR System (Thermo Fisher). Relative expression was calculated for each gene by the 2-ΔΔct method, with glyceraldehyde 3-phosphate dehydrogenase (Gapdh) for normalization as reported.70 Primers used for RT-PCR were:
Slit3 Forward: 5′- TGCCCCACCAAGTGTACCT -3′,
Slit3 Reverse: 5′- CGCCTCTCTCGATGATGCT -3′;
Sema3a Forward: 5′- CACTGGGATTGCCTGTCTTTT -3′,
Sema3a Reverse: 5′- TGGCACATTGTTCTTTCCGTTT -3′;
Efnb2 Forward: 5′- GCTAGAAGCTGGTACAAATGGG -3′,
Efnb2 Reverse: 5′- CATCGGTGCTAGAACCTGGA -3′;
Bglap Forward: 5′- CTGACCTCACAGATCCCAAGC -3′,
Bglap Reverse: 5′- TGGTCTGATAGCTCGTCACAAG -3′;
Col1a1 Forward: 5′- GCTCCTCTTAGGGGCCACT -3′,
Col1a1 Reverse: 5′- CCACGTCTCACCATTGGGG -3′;
Sp7 Forward: 5′- ATGGCGTCCTCTCTGCTTG -3′,
Sp7 Reverse: 5′- TGAAAGGTCAGCGTATGGCTT -3′;
Runx2 Forward: 5′- ATGCTTCATTCGCCTCACAAA -3′,
Runx2 Reverse: 5′- GCACTCACTGACTCGGTTGG -3′;
Ets1 Forward: 5′- TCCTATCAGCTCGGAAGAACTC -3′,
Ets1 Reverse: 5′- TCTTGCTTGATGGCAAAGTAGTC -3′;
E47 Forward: 5′- GGGTGCCAGCGAGATCAAG -3′,
E47 Reverse: 5′- ATGAGCAGTTTGGTCTGCGG -3′;
FoxJ2 Forward: 5′- GCCTCCGACCTGGAGAGTAG -3′,
FoxJ2 Reverse: 5′- CTGTACCGTGGCTTGCCAT -3′;
FoxA2 Forward: 5′- CCCTACGCCAACATGAACTCG -3′,
FoxA2 Reverse: 5′- GTTCTGCCGGTAGAAAGGGA -3′;
Gapdh Forward: 5′- CATCACTGCCACCCAGAAGACTG-3′,
Gapdh Reverse: 5′- ATGCCAGTGAGCTTCCCGTTCAG-3′.
The primers were obtained from the Primer Bank Database, the specificity and linearity were verified and reported by others. We did the BLST to ensure specificity for the target gene with no significant off-target binding, further confirmed by a single sharp peak from the Melt Curve. Linearity was assessed by constructing a standard curve using serial 10-fold dilutions of the template.
Primary DRG neuron isolation and culture
Young WT mice were euthanized as described above for DRG tissue isolation. We dissected the DRG tissue from thoracic and lumbar vertebrate under microscope and collected in F12 Minimum Essential Medium (F12-MEM, Gibco) supplemented with 1% Penicillin-Streptomycin solution (P.S.) at 4 °C. The medium was then replaced by 1 mL collagenase Type I solution (1 mg/mL, 17100017, Gibco) and incubated in a microcentrifuge tube at 37 °C for 90 min. Collagenase solution was then replaced with 500 μL 1X TrypLE™ Express Enzyme solution (12604013, Gibco) and incubated at 37 °C for 15 min. The specimen was centrifuged and the tissue pellet was collected (1 000 r/min, 5 min). The pellet was resuspended using F12-MEM medium containing 1X supplement B27 (17504044, Gibco) and filtered using 40 μm strainer. Prior to use in experiments, the DRG neurons were collected by centrifuge under 1 000 r/min for 5 min.
Microfluid assay
For our neuron culture studies, we employed the Innsbruck Neuron Device (IND500) featuring a 500-µm microgroove barrier. This device was set up on a Corning cell culture dish with a 10 cm diameter. Initially, the device underwent a cleaning process involving an overnight soak in 10% hydrochloric acid, followed by a thorough ultrasonic cleaning in distilled and deionized water, repeated three times for 20 min each session. Prior to each experimental run, the device was air-dried and placed onto the culture dish. The dish wells were prepared by applying 100 μL of a coating solution that contained 100 μg/mL Poly-D-Lysine for 1 h at 37 °C, then coated with 10 μg/mL Laminin to each well after 1X PBS washing five times. The plate was incubated at 37 °C for 1 h, then the coating solution was discarded, and the wells were rinsed thrice with sterile 1X PBS.
DRG neurons were introduced into the central channel of the device. The successful migration of neurons into the designated channel was confirmed via microscopy. Subsequently, about 150 µL of culture medium was dispensed into each side well and cultured for 3 days before further intervention. Different interventions were administered to the wells: 150 µL conditioned medium from vehicle or PTH-treated osteoblasts, with or without Slit3 antibody (1 µg/mL, AF3629, R&D Systems), or human recombinant Slit3 protein (1.25 µg/mL, 9067-SL, Biotechne), for 1 week. Nerve growth factor (50 ng/mL, N-100, Alomone Labs) was supplemented for each well. After 1 week of incubation, the neurons and their axons were fixed and prepared for immunofluorescence staining.
For staining, the culture medium was removed, and cells were fixed using 4% paraformaldehyde (PFA, 200 μL/well) for 15 min at room temperature. Following fixation, the cells underwent three 1X PBS washes and were blocked with a solution containing 1% bovine serum albumin, 0.3% Triton X-100, and 2% normal goat serum in 1X PBS for an hour at room temperature. Axons were labeled with PGP9.5 antibody (1:200, SAB4503057, Sigma) and incubated overnight at 4 °C. Post-secondary antibody treatment, the wells were washed and prepared for confocal microscopy analysis using a Zeiss LSM 880 system.
Chip assay
MC3T3 cells were cultured with osteoblast differentiation medium for 3 days and treated with PTH (100 nmol/L) or vehicle for another 3 days. Chip assay was performed according to the manufacturer’s protocol (Pierce™ Agarose CHIP Kit, Cat. 26156, Thermo Fisher). Briefly, we crosslinked the cell pellet using Glycine Solution after fixation in 1% formaldehyde. The cells were lysed in membrane extraction lysis buffer and nuclear extraction lysis buffer, along with MNase digestion (DTT, MNase Digestion Buffer). Of the sample, 10% was removed as an input control. Antibodies targeting E47 (sc-416, Santa Cruz), FoxA2 (22474-1-AP, Proteintech) were utilized. Additionally, anti-RNA polymerase II and control IgG served as the positive and negative controls, respectively. The DNA samples were further analyzed by qPCR and electrophoresis as introduced by the manufacturer. PCR primers used to detect E47 and FoxA2 binding site were as follows:
E47 Site #1: Forward: 5′- TCAGCCCTGGTACTAAAT -3′,
Reverse: 5′- CAAACCTTGAACCAATTT -3′;
E47 Site #2, Forward: 5′- GAGGACTGAGGCAAAGGC -3′,
Reverse: 5′- CTCTGCTTCCGATGGTGA -3′;
E47 Site #3, Forward: 5′- AGGCTATTTCAGACCTTT -3′,
Reverse: 5′- CAGGCTCCATACATACTTG -3′.
E47 Site #4, Forward: 5′- AGAACGGTGGCACCTTGA -3′,
Reverse: 5′- GCGGACCTTTATTTCCTTATTT -3′.
E47 Site #5, Forward: 5′- CCTACAGGCTCTTGGTTGCTC -3′,
Reverse: 5′- CGCTCGCTTTCTCCATTCAC -3′.
FoxA2 Site #1: Forward: 5′- TGGGGGTGGGGGGGGGGAGCTGGGG -3′,
Reverse: 5′- TCTTCTATTTTCCTTAAAGGAAACT -3′;
FoxA2 Site #2, Forward: 5′- TCAAGGAAGTCTGGGCAATA -3′,
Reverse: 5′- GGCAGGAACTGGAGGAAA -3′;
FoxA2 Site #3, Forward: 5′- TAGTTGTTGGCCTTAGCT -3′,
Reverse: 5′- TGAAATGATTATCCGAGAC -3′.
FoxA2 Site #4, Forward: 5′- GGGAGGCGGAGCTGGTGTTT -3′,
Reverse: 5′- GCGCTCGCTTTCTCCATTCAC -3′.
Statistics
Statistical evaluations were conducted utilizing GraphPad Prism version 8.0 (Boston, MA, USA), with outcomes expressed as the mean ± standard deviation. Differences among multiple experimental groups were assessed using one-way Analysis of Variance (ANOVA) followed by Tukey’s multiple comparison test. Comparisons between two distinct groups were using an unpaired, two-tailed Student’s t test. A p value of less than 0.05 was designated as the threshold for statistical significance across all experimental conditions.

Comments (0)