
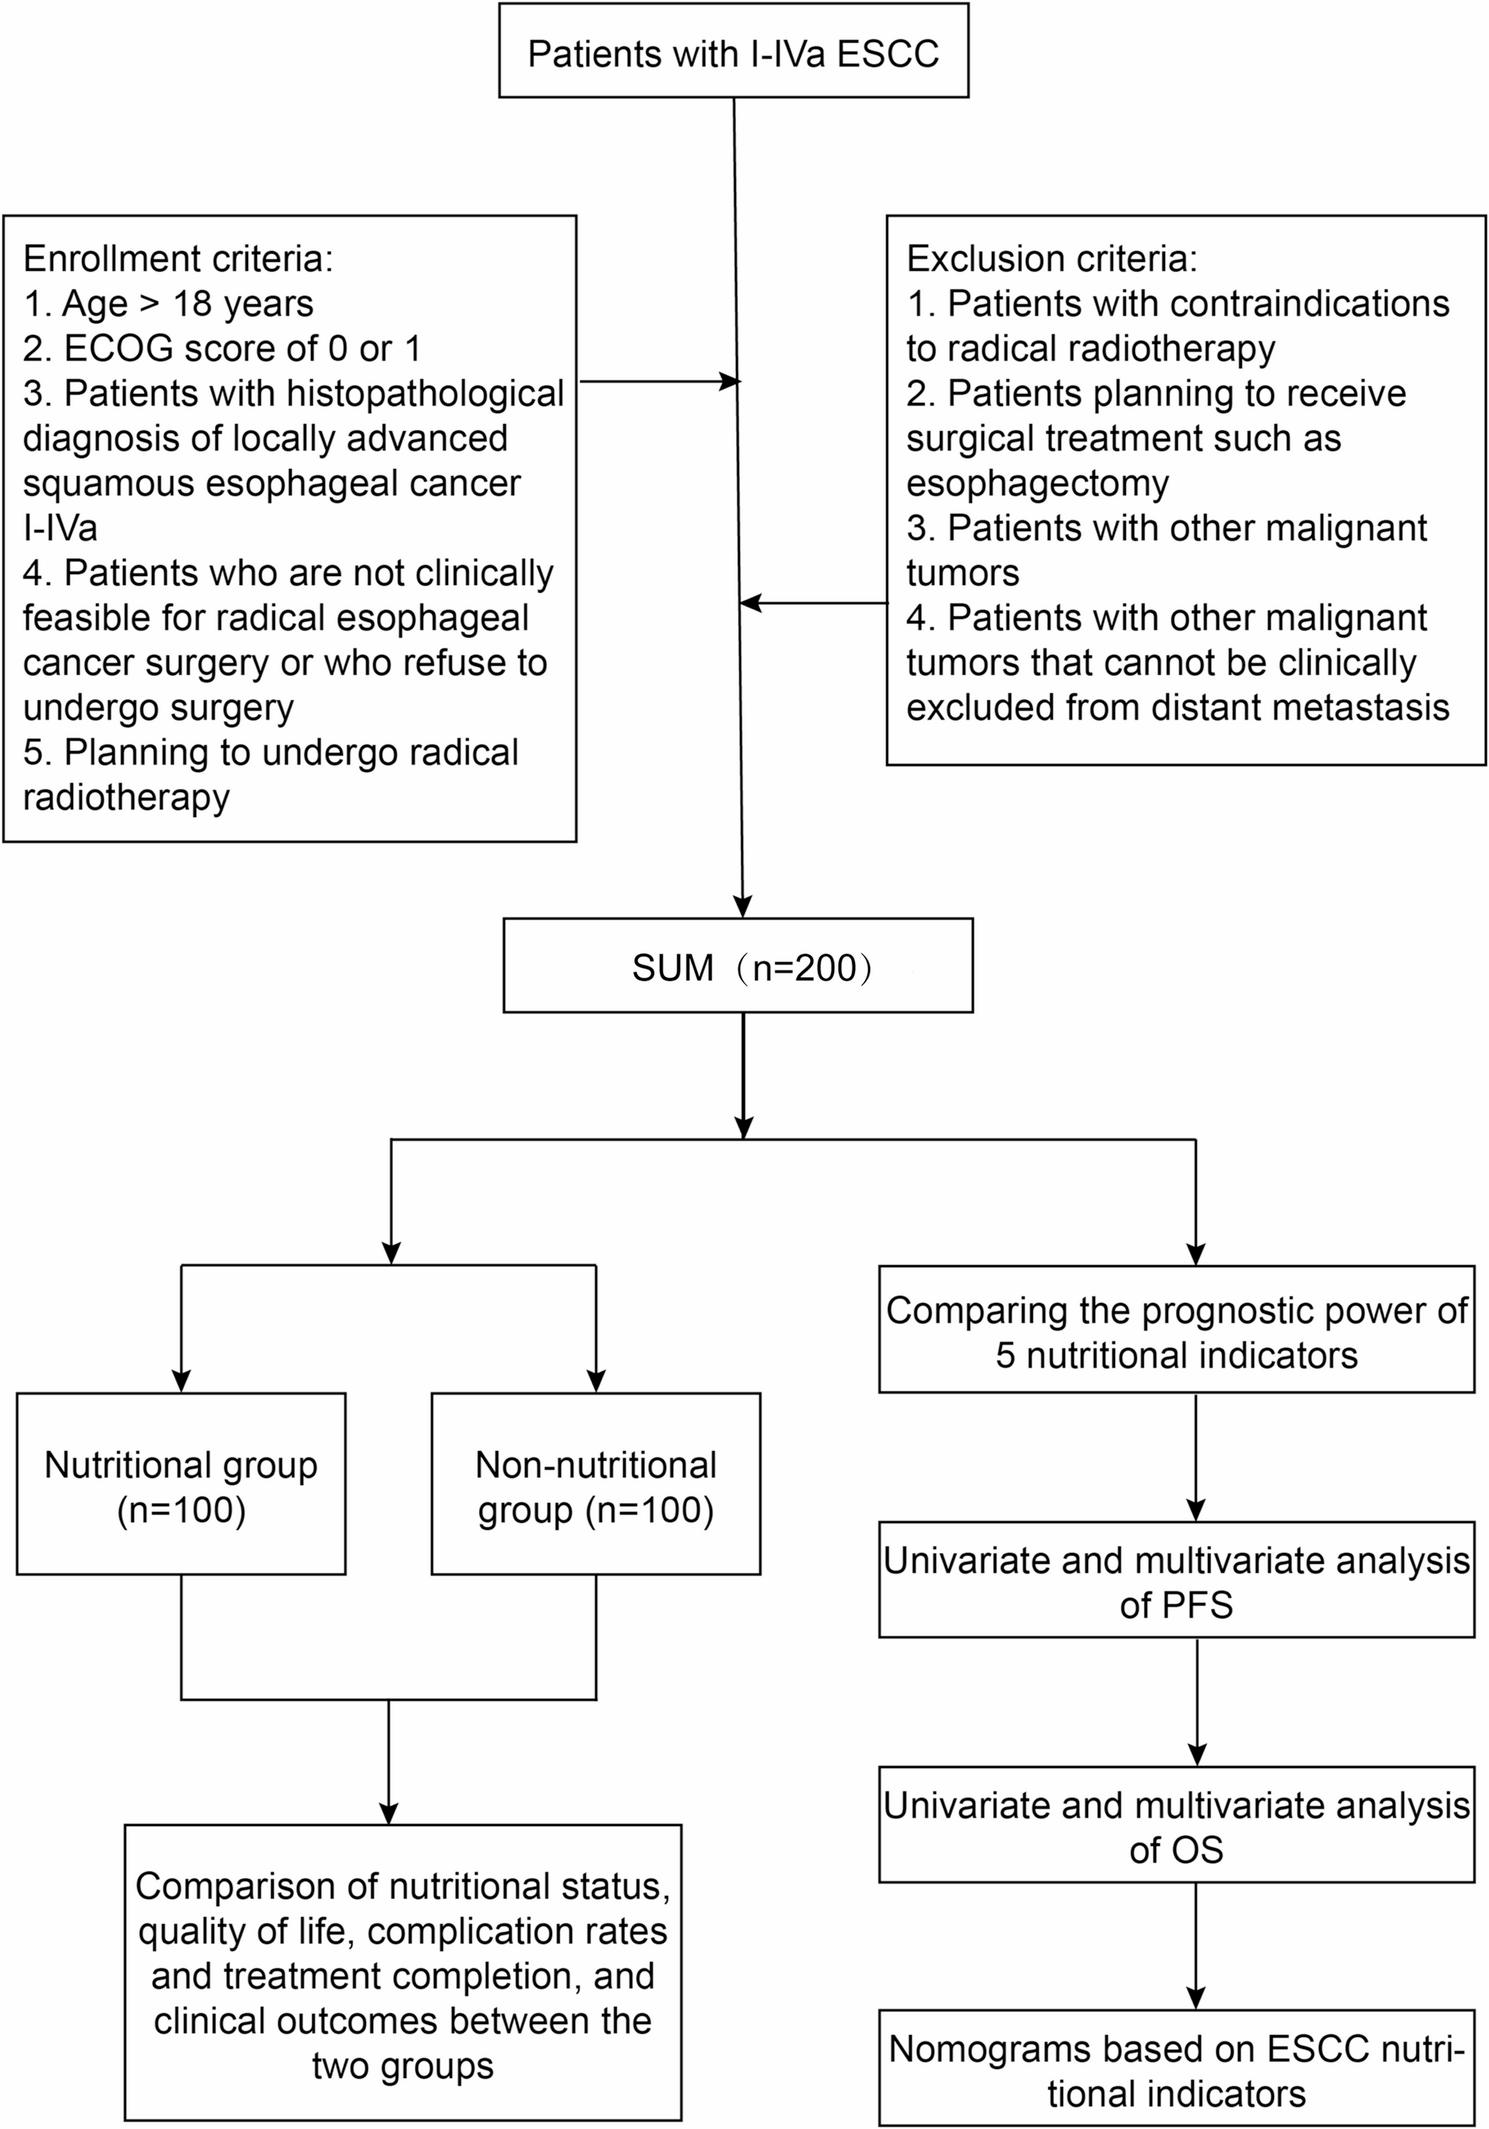
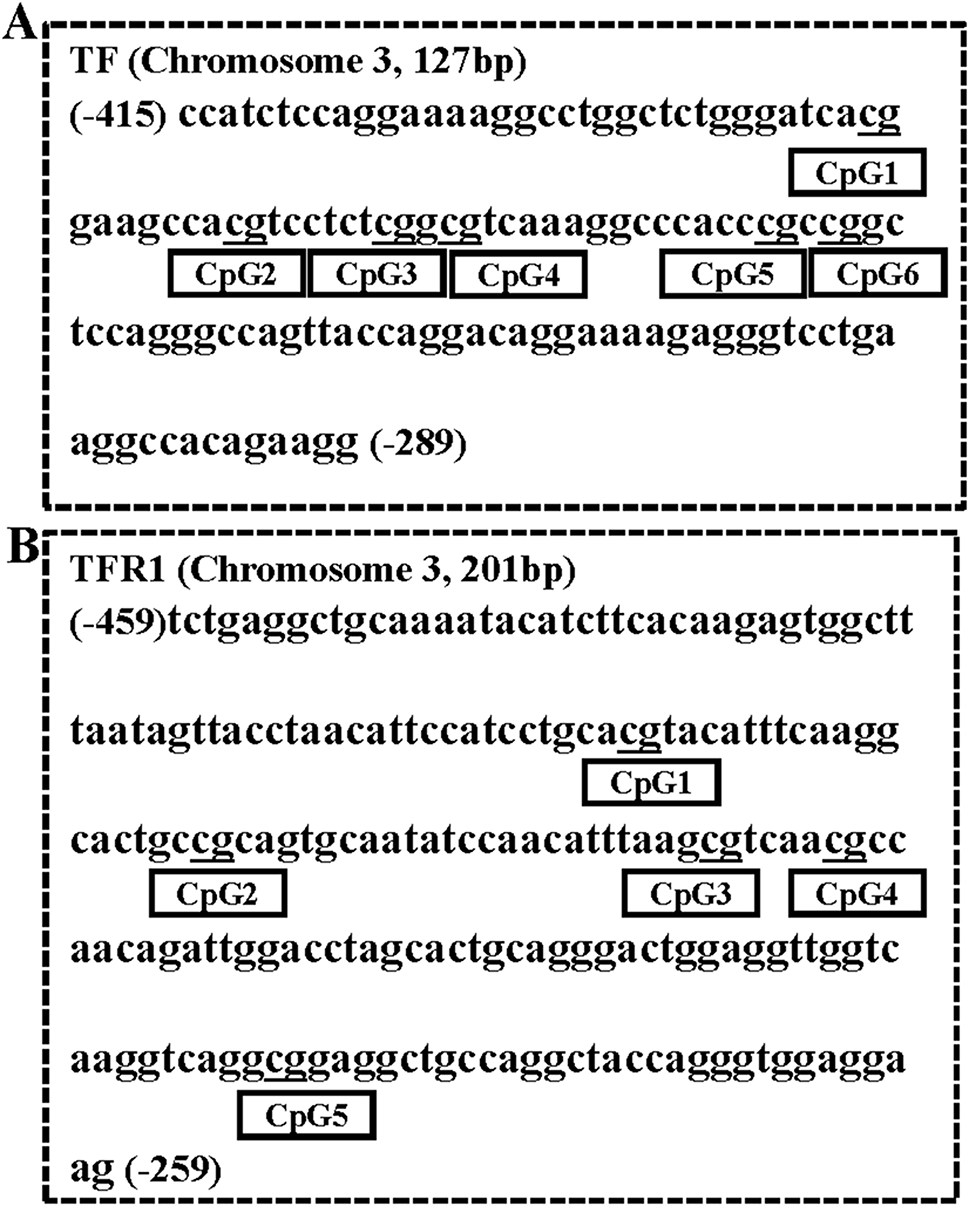
Remember me
According to Table 1, there are no significant differences between the nutritional and non-nutritional groups in most baseline characteristics. The groups are similar in age, gender, weight, BMI, tumor diameter, tumor location, T stage, N stage, TNM stage, and PG-SGA scores, with all P-values exceeding 0.05. The only significant difference is in tumor length, with the nutritional group having a significantly longer tumor length than the non-nutritional group (P = 0.010). Overall, the balance in baseline characteristics between the two groups ensures the reliability of subsequent analyses.
Table 1 Baseline characteristics of patients in the nutritional and non-nutritional groupsComparison of nutritional status between nutritional and non-nutritional groupsAccording to Table 2, there are significant differences in the nutritional status of patients in the nutritional and non-nutritional groups before and after treatment. Post-treatment, patients in the nutritional group showed marked improvement in ALB and NLR, with P-values of 0.035 and 0.013, respectively. The differences in ALB (−1.63 vs. −3.91, P < 0.001) and NLR (−0.50 vs. −0.750, P < 0.001) were statistically significant. Additionally, the differences in LMY, A/G, LMR, and PAR between the two groups also showed statistical significance, indicating that nutritional therapy markedly improves patients’ nutritional status. In summary, nutritional therapy demonstrates a significant advantage in enhancing the nutritional status and related indicators in esophageal cancer patients.
Table 2 Comparison of nutritional status between nutritional and non-nutritional groupsComparison of quality of life between nutritional and non-nutritional groupsQuality of life was assessed using the QLQ-C30 questionnaire, focusing on symptom scales including fatigue, nausea and vomiting, pain, dyspnea, insomnia, appetite loss, constipation, and diarrhea. The nutritional group reported significantly lower incidence rates of nausea and vomiting, pain, and appetite loss compared to the non-nutritional group (P < 0.05). However, there were no significant differences between the two groups in terms of fatigue, dyspnea, insomnia, constipation, and diarrhea. This indicates that while the nutritional intervention had a substantial impact on some symptoms, its effect on others was less pronounced. Overall, the nutritional group experienced a better quality of life, underscoring the benefits of personalized nutritional support in managing treatment-related symptoms (Table 3).
Table 3 Comparison of symptom scales in the QLQ-C30 between nutritional and non-nutritional groupsComparison of complication rates and treatment completion between nutritional and non-nutritional groupsThe study monitored both short-term and long-term complications, including myelosuppression, skin symptoms, radiation esophagitis, radiation pneumonitis, esophageal stricture, and esophageal fistula. Grading criteria for radiation esophagitis and skin symptoms were strictly adhered to, while myelosuppression was assessed using established oncological standards [12]. Additionally, all infection-related complications were meticulously identified and recorded throughout the study. The nutritional group had significantly lower rates of myelosuppression and radiation esophagitis compared to the non-nutritional group (P < 0.05), indicating better tolerance to treatment. Additionally, the incidence of skin symptoms was markedly lower in the nutritional group (P = 0.000). Despite these benefits, there were no significant differences in treatment completion between the two groups, suggesting that while nutritional intervention can reduce certain complications, it does not necessarily influence the ability to complete treatment (Table 4). These results highlight the role of nutritional support in mitigating adverse effects associated with chemoradiotherapy.
Table 4 Comparison of complication rates, treatment completion, and short-term efficacy between nutritional and non-nutritional groupsComparison of clinical outcomes between the nutritional and non-nutritional groupsClinical efficacy is divided into short-term and long-term outcomes. Short-term clinical outcomes, measured by the rates of NR, PR, and CR, showed no significant differences between the nutritional and non-nutritional groups (Table 4). However, long-term clinical outcomes, assessed by OS and PFS, demonstrated significant impact from nutritional therapy on esophageal cancer patients. Kaplan-Meier analysis (Fig. 2A) revealed that the overall survival rate for patients receiving nutritional therapy was significantly higher than that of the non-nutritional group, with a P-value of 0.0203, indicating statistical significance. Similarly, Fig. 2B showed that the progression-free survival rate was also higher in the nutritional group compared to the non-nutritional group, with a P-value of 0.0081. These results indicate that nutritional therapy significantly improves the prognosis of esophageal cancer patients, extending both overall survival and progression-free survival. Nutritional support should be integrated into the comprehensive treatment of esophageal cancer to enhance patient survival and quality of life.
Fig. 2
Survival analysis of the nutritional and non-nutritional groups
Retrospective analysis based on five immunonutritional indicators and the application of nomogram modelsPatient characteristicsThis table provides a comprehensive demographic and clinical profile of 200 patients. The majority of the patients are male (93.5%), and the age distribution shows a slight predominance of patients older than 65 years (51.5%). The body mass index (BMI) indicates that 57% of the patients have a BMI greater than 19.2. Tumor characteristics reveal that 78% have a tumor diameter larger than 13.39 mm, and 84% have a tumor length of 88.5 mm or less. Tumor location is predominantly in the middle to lower regions (76%), with advanced T stage (80%) and N stage (56%) being more common. The majority of tumors are in stage III/IVA (79.5%). Additionally, inflammatory markers such as LMY, NLR, PNI, LMR, and PAR exhibit varied distributions, highlighting their potential relevance in the patient cohort (Table 5).
Table 5 Basic information on 200 patientsComparing the prognostic power of 5 immunonutritional indicatorsBased on the ROC curves and AUC indices of five immunonutritional indicators (PNI, PAR, NLR, LMY, and LMR), their predictive capabilities for the prognosis in terms of progression-free survival (PFS) and overall survival (OS) were evaluated. The results indicate that PAR for PFS has the highest AUC value at 0.83, suggesting the strongest predictive ability among the indicators tested for PFS. LMY follows with an AUC of 0.7551 for PFS. For OS, the highest AUC value is also held by LMY at 0.7138, making it a significant predictor in both PFS and OS scenarios (Fig. 3). Other indicators like PNI, NLR, and LMR show lower AUC values, indicating relatively weaker predictive abilities.
Fig. 3
ROC curves of five immunonutritional indicators in ESCC
Univariate and multivariate analysis of PFSThe Cox analysis for PFS identifies several factors influencing patient outcomes. In the univariate analysis, factors such as N stage and PAR show significant associations with PFS, with N stage having a hazard ratio (HR) of 2.16 (P = 0.017) and PAR with an HR of 3.38 (P = 0.013). In the multivariate analysis, N stage and PAR remain significant with HRs of 2.08 (P = 0.013) and 4.04 (P < 0.001), respectively. These findings underscore the importance of these markers in predicting PFS, suggesting that higher PAR is associated with poorer outcomes, while other variables like gender, age, BMI, and tumor characteristics show no significant impact (Table 6).
Table 6 Univariate and multivariate analysis of PFS based on clinicopathological characteristicsUnivariate and multivariate analysis of OSThe analysis for OS explores the impact of various clinical factors. In the univariate analysis, the N stage, LMR, and LMY are significant, with N stage showing an HR of 1.76 (P = 0.022), LMR with an HR of 3.49 (P = 0.002), and LMY with an HR of 0.26 (P = 0.012). Multivariate analysis confirms the significance of N stage (HR = 1.61, P = 0.042), LMR (HR = 3.83, P < 0.001), and LMY (HR = 0.46, P = 0.041), indicating that higher N stage and lower LMR are associated with decreased survival, while higher LMY is associated with better survival. Other factors, including gender, age, BMI, and various tumor metrics, do not demonstrate significant associations with OS, highlighting the pivotal role of lymph node involvement, lymphocyte-to-monocyte ratio, and lymphocyte percentage in determining patient prognosis (Table 7).
Table 7 Univariate and multivariate analysis of OS based on clinicopathological characteristicsNomograms based on ESCC immunonutritional indicatorsThe nomograms, based on Cox multivariable analysis of OS and PFS, utilize key variables such as LMY, PAR, N stage, and LMR to construct two predictive models. The models indicate that higher PAR values, higher N stage, lower LMR, and lower LMY are all associated with poorer prognosis. Calibration curves demonstrate a high degree of concordance between predicted and actual outcomes, indicating good calibration and reliability of the models. Overall, these models hold significant clinical potential, aiding physicians in personalized risk assessment and treatment decision-making, thereby enhancing patient outcomes and survival rates (Fig. 4).
Fig. 4
Comments (0)