
Remember me
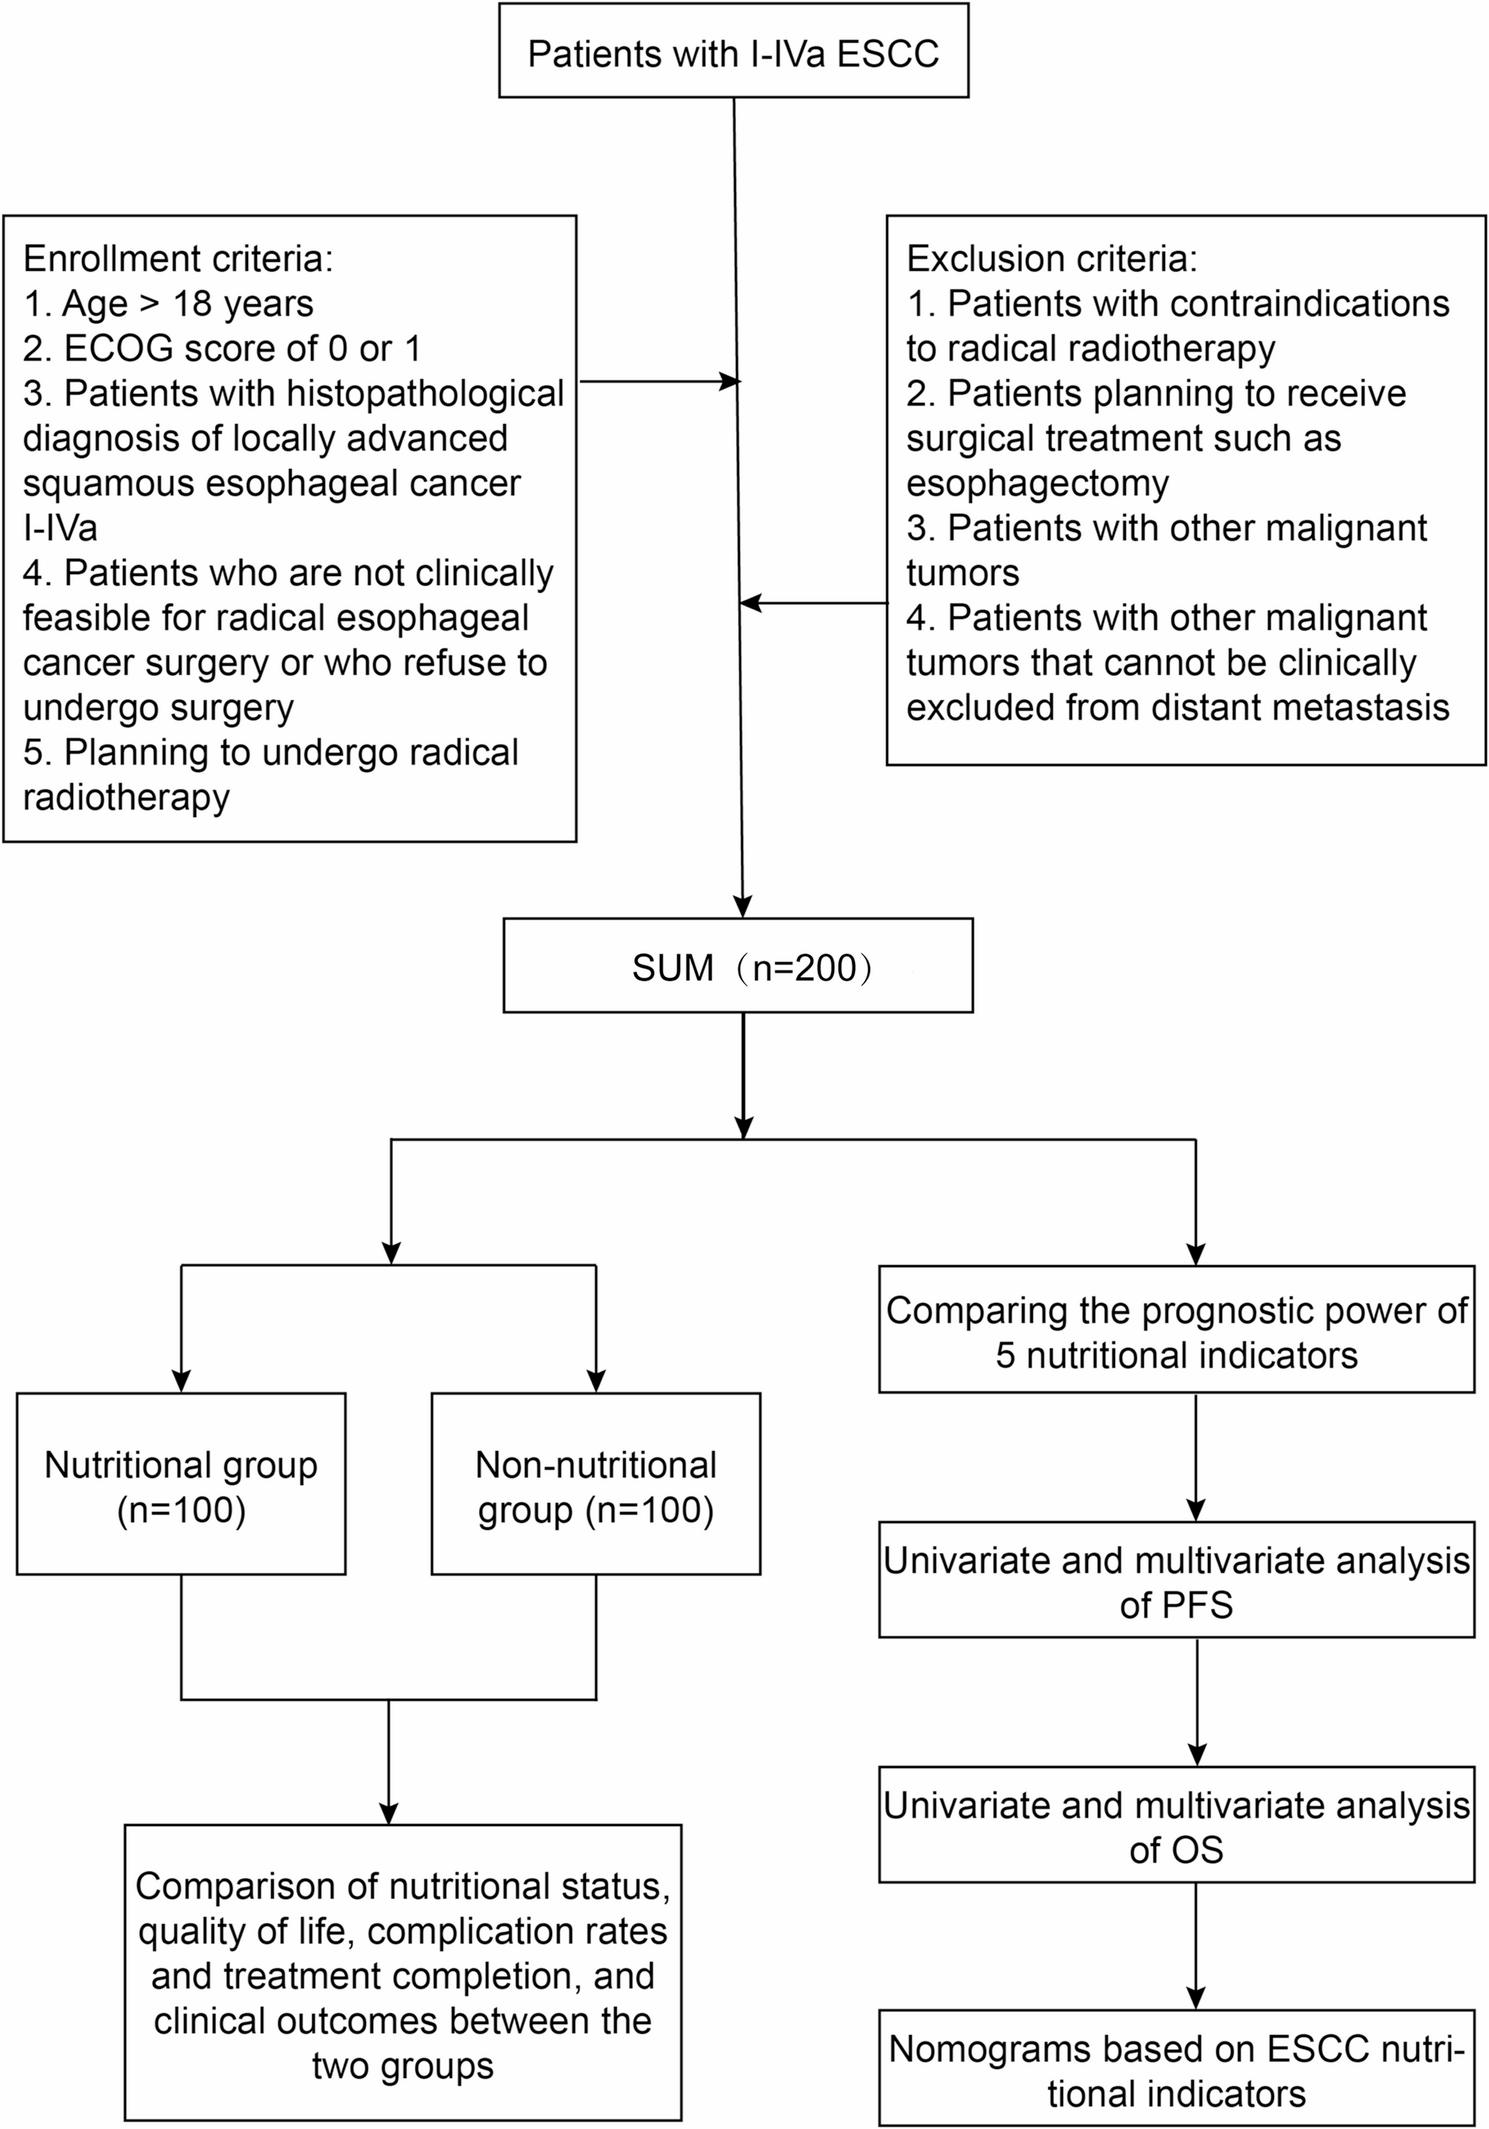

A representative cross-sectional study was conducted to select 104 obesity school-age children as the experimental subjects by the classification systems of body mass index (BMI) basing on the age and gender from the Centers for Disease Control and Prevention (CDC), while 65 participants with the normal BMI were as the controls by matching the age, gender and etc [22]. All above subjects were carried out at the Department of Clinical Nutrition in the Beijing Children’s Hospital from July 2019 to April 2022 according to the strict inclusion and exclusion criteria. Specifically, the including subjects were 7–12 year healthy school-age children without obvious endocrine, autoimmune and genetic metabolic diseases. Conversely, the participants were excluded if they were previously diagnosed as the genetic syndrome coexisting with obesity, Cushing’s syndrome, other secondary causes of obesity, chronic somatic diseases (heart failure, encephalitis disseminate dementia and so on) and severe mental disorders. Meanwhile, they were also excluded with the lack of written informed consents from the participants and their guardians. Moreover, the subjects could be actively withdrew if they were loss of interests, follow-up records and the other unknown reasons.
This study was approved by the Ethics Committee of Beijing Children’s Hospital affiliated to Capital Medical University (No. IEC-C−006-A04-V.06), which was also registered at the website of http://www.chictr.org.cn/showproj.aspx?proj=4673 (No. ChiCTR-OCH−14004900). Meanwhile, all the subjects and their guardians were granted the written informed consents after they were clearly informed the significance of this survey by the trained investigators.
Measurement of body compositionsThe basic characteristics of the included subjects was collected by the trained pediatricians at the Department of Clinical Nutrition in the Beijing Children’s Hospital through the face to face method. The individuals’ height (Seca 213, Germany) and weight (H-key 350, see-higher, China) were recorded with three repeated measurements to determine the values of BMI, length for age Z score (LAZ), weight for age Z score (WAZ) and BMI for age Z score (BMIZ). Meanwhile, their body compositions including the body fat, muscle mass, visceral fat area (VFA) and waist hip ratio were obtained by the bio-electrical impedance analyses (BIA) using the whole-body impedance (H-key 350, Haikang, China) under the fasting state.
Collection of blood samplesThe peripheral blood samples (about 2mL) were consequently obtained from each participant between 8 am and 9 am after the detection of body compositions by the trained professional researchers under the strict uniform protocols. Then, their serum samples were collected under the 3000r/min for 20min at the room temperature as soon as possible to divide into two EP pipes, in which one was left at the Department of Clinical Laboratory in the Beijing Children’s Hospital to determine the concentrations of biochemical indicators, while the others were immediately preserved at -20 °C until use.
Determination of serum biological indicatorsThe serum biological indicators, such as triglyceride (TG), total cholesterol (TC), high density lipoprotein cholesterol (HDL-C), low density lipoprotein cholesterol (LDL-C), very low density lipoprotein cholesterol (VLDL-C), fasting blood glucose (FBG), alanine aminotransferase (ALT) and aspartate aminotransferase (AST), were measured by the Coulter 5821 automatic biochemical analyzer (Beckman, USA). Then, the fasting insulin (FINS) was detected by the instruments of immunohistochemical chemiluminescence immunoassay (Siemens, Germany) and calculated the indicators of homeostasis model assessments for β-cells function (HOMA-β) and insulin resistance (HOMA-IR) to evaluate the functions of β-cells. Moreover, the serum glycosylated hemoglobin (HbA1c) was tested by the high-performance liquid chromatography (HPLC, Bio-Rad Variant II Turbo, USA).
Definition of MUO and MHO subgroupsAmong the 104 obesity school-age children, the MHO (n = 60) and MUO (n = 44) subgroups were respectively defined according to the pediatric criteria for the components of MetS by the de Ferranti et al. [23], including the TG ≥ 110 mg/dL, HDL-C < 50 mg/dL, FBG ≥ 100 mg/dL, ALT ≥ 30U/L or AST ≥ 24U/L.
Evaluation of serum oxidative enzyme activityThe contents of serum superoxide dismutase (SOD) (Nanjing Jiancheng Bioengineering Institute, China, no. A001-3), CAT (mlbio. Co., Ltd, Shanghai, China, no.ml095171) and glutathione peroxidase (GSH-Px) (mlbio. Co., Ltd, Shanghai, China, no.ml09526) were evaluated using the commercial kits according to the manufacturer’s instructions.
Determination of serum iron, TF and TFR1The concentrations of serum iron were detected by the inductively coupled plasma mass spectrometer (ICP-MS), while the contents of serum TF (mlbio. Co., Ltd, Shanghai, China, no. ml092732) and TFR1 (mlbio. Co., Ltd, Shanghai, China, no. ml063113) were measured by the commercial assay kits according to the manufacturer’s instructions.
DNA extraction and detection of 8-hydroxydeoxyguanosine (8-OHdG)Within the strictly controlled workplace, DNA samples of all the enrolling subjects (n = 169) were extracted from the peripheral blood (approximately 200uL) using the TIANamp Blood Clot DNA kits (TIANGEN. Co., Ltd, China, no. DP335-02). The quantity of purified DNA was evaluated by the NanoDrop 2000 C (Thermo Fisher Scientific, CN). Then, the oxidized DNA injuries as 8-OHdG were measured using the Elisa kits (CUSABIO, China, no.CSB-E10140h). Exactly, the DNA samples were incubated with the diluted 8-OHdG antibody for 30 min at 37 °C, followed by washing three times and incubated with HRP-conjugated streptavidin for 30 min at 37 °C. Finally, the assay was stopped with the TMB and analyzed at 450 nm using the Micro-plate Reader.
Genome-wide methylation and hydroxymethylationThe DNA samples (about 100ng) were used to determine the levels of genome-wide methylation (MethylFlash Methylated DNA Quantification Kits, Epigentek Co. Ltd, USA, no. P-1034-96) and hydroxymethylation (MethylFlash Global DNA Hydroxymethylation (5-hmC) Elisa Easy Kit, Epigentek Co. Ltd, USA, no. P-1032-96) by the related Elisa kits according to the manufacturer’ instructions.
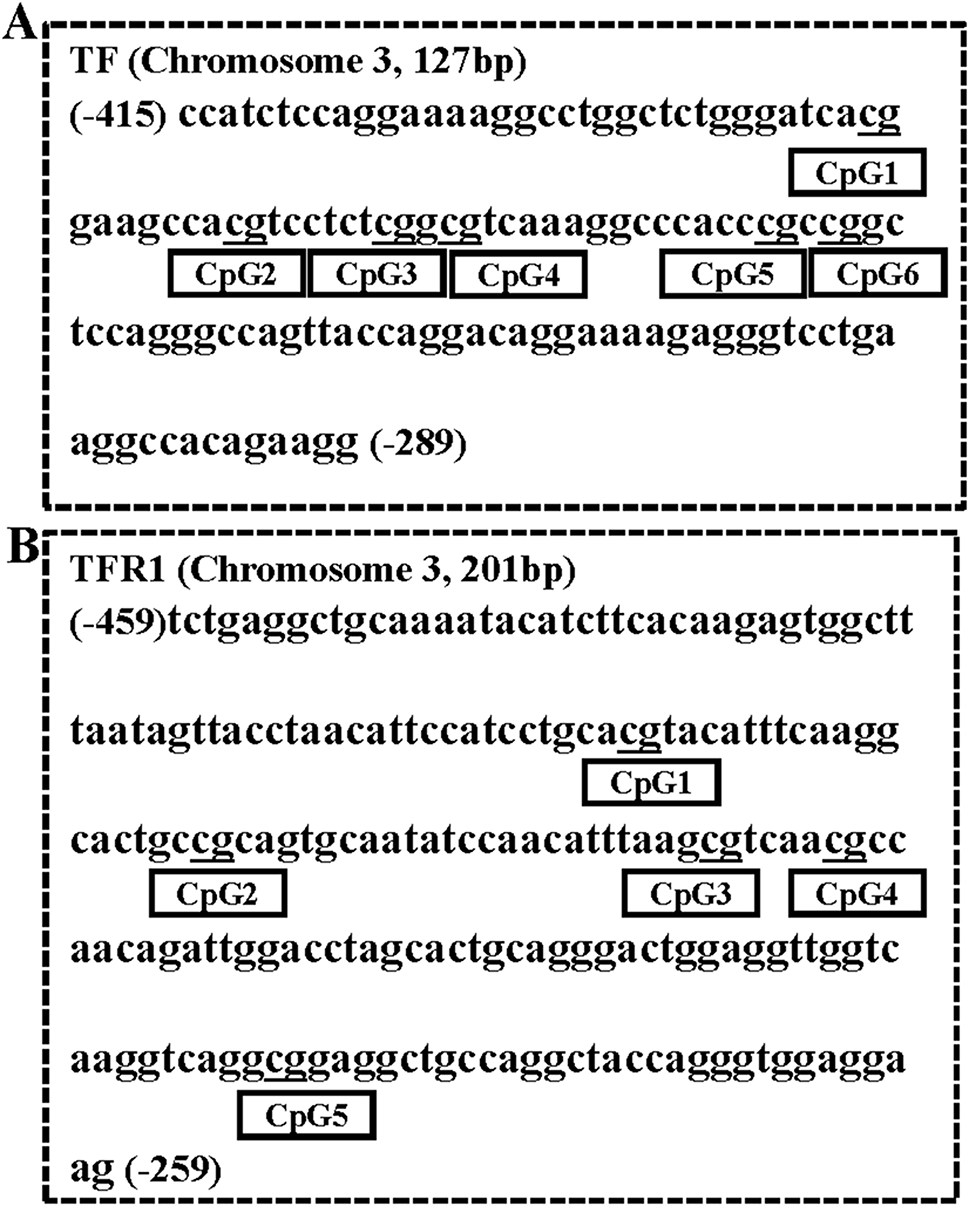
Methylation patterns of CpG sites in the TF and TFR1The DNA samples were bisulfite-converted to determine the methylation levels by the EZ DNA Methylation kits (Zymo Research, Irvine, CA, USA, no. D5002) according to the manufacturer’ instructions. The target sequences of CpG islands in the TF (Forward: TTATTTTTAGGAAAAGGTTTGGTTTT, Reverse: CCTTCTATAACCTTCAAAACCCTCT) and TFR1 (Forward-out: TTTTTTTGTATTTTTGAGGTTGTAA AATAT, Forward-in: TTTGAGGTTGTAAAATATATTTTTATAAGA and Reverse: CTTCCTCCACCCTAATAACCTAAC) were obtained using the NCBI Gen-Bank Database (http://www.ncbi.nlm.nih.gov). Their meth-primers were designed basing on the sequences of target regions by the Meth-Primer (http://www.urogene.org/methprimer). Meanwhile, the spans CpG sites were shown in the Fig. 1. Then, the above bisulfite converted DNA samples were determined by the Beijing Genomics Institute (Sangon Biotech (Shanghai) Co., Ltd), in which the PCR reactions were as 95℃ for 10 min, (95℃ for 30 s, 55℃-30 s, 72℃-50 s) × 40 cycles and 72℃ for 5 min.
Fig. 1
CpGs sites and sequences in the TF and TFR1. Note: A: TF, B: TFR1. TF: transferrin, TFR1: transferrin receptor 1
Evaluation of the contents and damages of mtDNAThe contents of mtDNA were determined using the quantitative real-time polymerase chain reaction (RT-PCR), which was measured by the ratio of MTF3212/R3319 (F: CACCCAAGAACAGGGTTTGT, R: TGGCCATGGGTATGTTGTTAA) and ND1 (F: ATGGCCAACCTCCTACTCCT, R: CTACAACGTTGGGGCCTTT), with the control gene as the RPLP0 (F: CAGCAAGTGGGAAGGTGTAATCC, R: CCCATT CTATCATCAACGGGTACAA).
The mtDNA lesions were employed by a semi-long run RT-PCR technique, in which the DNA lesions were on a template strand to block DNA polymerase and result in the decreased amplification of target sequences [24]. Only DNA templates without any DNA damages were amplified. Therefore, the numbers of mtDNA lesions per fragment were calculated basing on the Poisson distribution using the modified equation as Number of mtDNA lesions=-ln(2▲Ctshort−▲Ctlong). The primers in the above reactions were as ND1-long-F: ATGGCCAACCTCC TACTCCT, ND1-long-R: GATGAGTGTGCCTGCAAAGA, ND1-short-F: CCTAA AACCCGCCACATCTA and ND1-short-R: GCCTAGGTTGAGGTTGACCA. Then, the above reactions were run in the duplicate and performed as 95℃ 3 min, (95℃ for 30 s, 65℃ for 30 s, 72℃ for 45 s) × 42 cycles and 72℃ for 5 min.
Detection of methylation levels of mtDNAThe methylation levels were determined by the ratios of estimated amounts for the methylated (F: TAGGAATTAAAGATAGATATTGCGA, R: ACTCTCCATACATTTAATATTTTCGTC) and unmethylated mtDNA (F: GGTAGGAATTAAAGATAGATATTGTGA, R: ACTCTCCATACATTTAATATTTTCATC) in the D-loop [24, 25].
Statistical analysisThe statistical analyses were performed using the SPSS 21.0. Exactly, the normality of data was assessed by the Kolmogorov-Smirnov-Goodness-of-Fit test, in which the continuous descriptive variables were expressed as Mean ± Standard error (SE) and categorical data was expressed as percentage (%) when they were followed the normal distributions. Otherwise, the inter-quartile range (IQR) was chosen to demonstrate the non-normal distributed variables. Besides, the log-transformation was used to determine the methylated/unmethylated mtDNA and contents of mtDNA, because they were not normally distributed. Then, the comparisons of continuous and categorical parameters were respectively performed using the multiple tests of One-way analysis of variance (ANOVA) and Chi-square tests, and the significant comparisons were conducted using the Bonferroni’s test to compare the differences between every two groups. Meanwhile, the Mann-Whitney U non-parametric test was chosen to determine the differences among the different groups when the data was not normally distributed. Moreover, the coefficients of Spearman correlation were assessed the relationships between the methylation levels and their related enzymes, biological indicators, growth outcome and body compositions by adjusting the sex, age and the other confounding factors. Furthermore, the residual standard error and semi standardized coefficients were comprehensively evaluated the sensitivity of special values. A two-sided P < 0.05 was considered as the statistical significance, while the P < 0.017 was chosen as the significant differences under the Bonferroni’s correction tests. Meanwhile, we assumed the means of DNA methylation levels (or mtDNA copy numbers) among the MHO, MUO, and control groups, along with the related standard deviation, type 1 error of 0.017, and with current sample size, we could ultimately choose more than 80% power to identify their mean differences.
Comments (0)