
Remember me
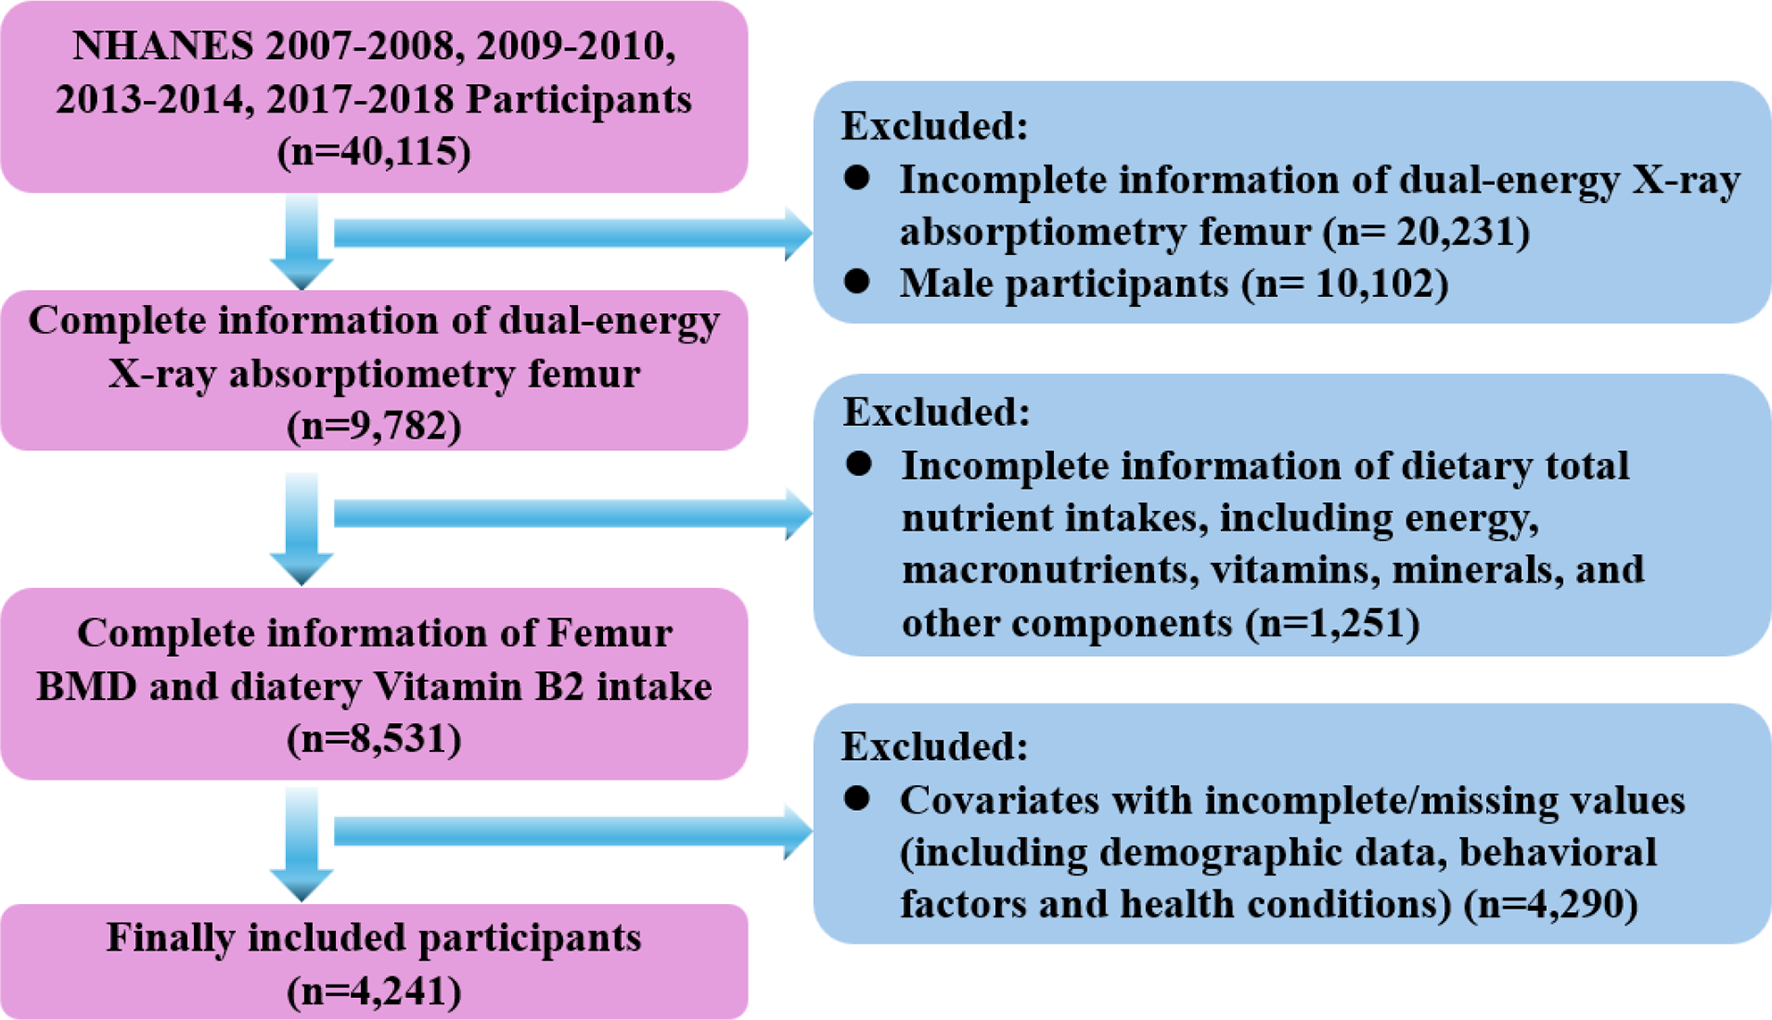

A total of 4, 241 female participants from four cycles of NHANES were included in this study for the association analysis of dietary vitamin B2 intake, osteoporosis, BMD and hip fracture. The baseline characteristics of the included female participants are presented in Table 1, and the differences in dietary vitamin B2 intake, femur BMD in different regions, and hip fracture frequency between OP and non-OP groups were reported in Table. S2 and Fig. S1. Overall, age, race, education, marital status, BMI, total MET, smoking, milk consumption, prednisone or cortisone intake, diabetes, menopausal status, serum markers (including albumin, ALP, total calcium, and phosphorus), and dietary intake of energy and nutrients (including calcium, magnesium, vitamin D and zinc) were statistically significant between OP and non-OP groups (Table 1). Specifically, compared with non-OP participants, OP participants were more likely to be older, be Non-Hispanic White, be postmenopausal, suffer diabetes, with lower levels in education, BMI and total MET, with history of prednisone or cortisone intake, and showing less intake of energy, calcium, magnesium, vitamin D and zinc (all P value < 0.05, Table 1). Additionally, as opposed to non-OP participants, OP individuals showed remarkably lower levels of BMD in different femur regions (all P value < 0.05, Table. S2), as well as reduced levels of dietary vitamin B2 intake (P value < 0.05, Fig.S1), while presented higher percentages in hip fracture (P value < 0.05, Table. S2).
Table 1 Baseline characteristics of survey participants according to osteoporosis diagnosisAssociation between dietary vitamin B2 intake and osteoporosis, BMD, and hip fractureTo determine the association between dietary vitamin B2 intake and osteoporosis and hip fracture, multiple logistic regression models were utilized and the results were presented in Tables 2 and 3, respectively. No significant association was observed between dietary vitamin B2 intake and hip fracture in unadjusted, partially- or fully-adjusted models (Table 3). In contrast, in model 3, the intake of vitamin B2 was found to be significantly correlated with decreased risks for osteoporosis regardless of whether the intake of vitamin B2 was analyzed as continuous variable or categorical variable (Table 2). In model 3, the highest quantile of vitamin B2 intake (OR = 0.613; 95%CI: 0.454–0.829) was positively associated with decreased risk of osteoporosis compared to quantile 1 (P for trend = 0.002).
Table 2 Association between dietary total vitamin B2 intake and osteoporosisTable 3 Association between dietary total vitamin B2 intake and femoral BMDTable 4 Association between dietary total vitamin B2 intake and hip fractureGeneral linear regression models were used to explore the association of vitamin B2 intake and BMD, with the results being presented in Table 4. Similarly, the intake of vitamin B2 was found to be positively associated with increased levels of femur BMD in model 2 and model 3, regardless of the variable type of vitamin B2 intake. In model 3, when vitamin B2 intake was analyzed as continuous variable, 1 mg increment of vitamin B2 intake was associated with conspicuous elevation of BMD in all femur regions, with the β being 0.008 (95%CI: 0.003–0.012), 0.005 (95%CI: 0.001–0.009), 0.007 (95%CI: 0.003–0.011) and 0.009 (95%CI: 0.003–0.014) for total femur BMD, femoral neck BMD, trochanter BMD, and intertrochanter BMD, respectively (all P value < 0.05, Table 4). Consistently, when vitamin B2 intake was analyzed as categorical variable, the quantile 4 group was positively associated with increased BMD in all femur regions when compared with the quantile 1 group, with the β being 0.020 (95%CI: 0.007–0.033), 0.015 (95%CI: 0.002–0.027), 0.020 (95%CI: 0.009–0.031) and 0.022 (95%CI: 0.006–0.037) for total femur BMD, femoral neck BMD, trochanter BMD, and intertrochanter BMD, respectively (all P value < 0.05, all P for trend < 0.05, Table 4).
Identification of potential nonlinear relationships between dietary vitamin B2 intake and osteoporosis, BMD, and hip fractureThe above-mentioned results indicated that the dietary vitamin B2 intake, whether being continuous variable or categorical variable, was significantly associated with reduced risks for osteoporosis and increased femur BMD, while not significantly related to the risk of hip fracture. Therefore, multivariate restricted cubic spline (RCS) analysis was used to determine the potential nonlinear relationships between dietary vitamin B2 intake and osteoporosis, BMD, and hip fracture. As depicted in Fig. 2, vitamin B2 intake was found to be negatively and linearly associated with risks for femoral OP (P for overall = 0.004, P for nonlinear = 0.644), and positively and linearly correlated with total femur BMD (P for overall = 0.016, P for nonlinear = 0.926), trochanter BMD (P for overall = 0.003, P for nonlinear = 0.962) and intertrochanter BMD (P for overall = 0.047, P for nonlinear = 0.830), while positively and nonlinearly correlated with femoral neck BMD (P for overall = 0.035, P for nonlinear = 0.014). However, no significant relationship was found between vitamin B2 intake and hip fracture (P for overall = 0.760, P for nonlinear = 0.813).
Fig. 2
RCS analysis exploring the association between dietary intake of Vitamin B2 level and osteoporosis, hip fracture and femoral BMD in all participants. Variables of age, race, education, marital status, PIR, BMI, prednisone or cortisone intake, milk consumption, Vitamin D supplement, diabetes, smoking, menopause, total MET, serum albumin, serum ALP, serum total calcium, and serum phosphorus were adjusted during RCS analyses. Abbreviations: RCS, restricted cubic spline; BMI, body mass index; MET, metabolic equivalent task; PIR, ratio of family income to poverty; ALP, alkaline phosphatase
Association between dietary vitamin B2 intake, osteoporosis and femur BMD levels within different subgroupsIn order to further confirm the robustness of the above analytic results, subgroup analyses and interaction tests were subsequently performed. As presented in Table 5, except for the variable of total MET, the relationship between vitamin B2 intake and osteoporosis remained consistent in different subgroups stratified by age, BMI, race, education level, marital status, menopausal status, milk consumption, diabetes and smoking. Moreover, interaction tests indicated that the associations between vitamin B2 intake and osteoporosis was modified by the variable of total MET, with the risk for OP reduced more pronounced in the subgroup of insufficiently active individuals as the increment of vitamin B2 intake (P interaction = 0.0364, Table 5). Additionally, the RCS analyses based on different total MET groups also verified the findings from subgroup analyses, with a more pronounced relationship between vitamin B2 intake and osteoporosis and femur BMD being observed in insufficiently active participants (Fig. 3). Similarly, the association between vitamin B2 intake and BMD levels in different femur regions was also verified by subgroup and interaction analyses. As presented in Table S3, the association remained stable in different subgroups except for the stratifying variable of education and milk consumption, with the aforementioned association being more pronounced in those with higher education levels (P interaction = 0.0413 for total femur BMD, and P interaction = 0.0108 for intertrochanter BMD) and with more milk consumption (P interaction = 0.0405 for trochanter BMD).
Table 5 Association between dietary total vitamin B2 intake and osteoporosis in different subgroupsFig. 3
RCS analysis exploring the association between dietary intake of Vitamin B2 level and osteoporosis, hip fracture and femoral BMD in different total MET subgroups. (A) Femur osteoporosis, (B) Hip fracture, (C) Total femur BMD, (D) Femoral neck BMD, (E) Trochanter BMD, and (F) Intertrochanter BMD. Variables of age, race, education, marital status, PIR, BMI, prednisone or cortisone intake, milk consumption, Vitamin D supplement, diabetes, smoking, menopause, serum albumin, serum ALP, serum total calcium, and serum phosphorus were adjusted during RCS analyses. Abbreviations: RCS, restricted cubic spline; BMI, body mass index; MET, metabolic equivalent task; PIR, ratio of family income to poverty; ALP, alkaline phosphatase
ALP mediates the association between dietary vitamin B2 intake and osteoporosis and BMDThe association between dietary vitamin B1 intake and femur OP and BMD were significantly mediated by ALP, with the mediation proportions being 12.43%, 7.58%, 12.17%, 7.64% and 6.99% for femoral OP, total femur BMD, femoral neck BMD, trochanter BMD, and intertrochanter BMD, respectively (Sober test, all P < 0.05). The direct effect and mediated effect were − 0.014 (95% CI: -0.027, -0.000) and − 0.002 (95% CI: -0.004, -0.000) for femoral OP, 0.008 (95% CI: 0.004, 0.012) and 0.001 (95% CI: 0.000, 0.001) for total femur BMD, 0.004 (95% CI: 0.000, 0.008) and 0.001 (95% CI: 0.000, 0.001) for femoral neck BMD, 0.007 (95% CI: 0.004, 0.010) and 0.001 (95% CI: 0.000, 0.001) for trochanter BMD, and 0.009 (95% CI: 0.004, 0.014) and 0.001 (95% CI: 0.000, 0.001) for intertrochanter BMD, respectively (all P < 0.05, Fig. 4).
Fig. 4
ALP mediated the association between dietary vitamin B2 intake and OP and femur BMD in all regions
Potential mechanisms and targets of vitamin B2 involved in bone homeostasisA total of 129 genes, 18,447 genes and 2864 genes were identified to associate with vitamin B2, osteogenesis/bone formation, and osteoclastogenesis/bone resorption (Figs. 5A and 6A), respectively. 73 intersection targets were determined between vitamin B2 and osteogenesis/bone formation, and 37 overlapping targets were obtained between vitamin B2 and osteoclastogenesis/bone resorption. In addition, a total of 37 overlapping targets were confirmed by Venn analysis between riboflavin, osteogenic, and osteoclastic processes (Fig. S2). The STRING database was then utilized to get the PPI information of the selected 73 and 37 overlapping targets, and then the PPI network (Figs. 5B and 6B), as well as the top 10 hub target genes (Figs. 5C and 6C), were established and evaluated by Cytoscape software. According to the defined criteria for core targets selection, the top 10 core genes for osteogenic/osteoclastic process regulated by riboflavin were HIF1A, HDAC4, HDAC3, HDAC2, BCL2, TP53, MYC, NFKB1, PPARG and PPARGC1A (Figs. 5C and 6C).
Fig. 5
Identification of potential targets and mechanisms of vitamin B2 in regulating osteogenesis through network pharmacological analysis. (A) Venn graph showing the intersection targets of vitamin B2 and genes related to osteogenesis/bone formation. (B) The protein-protein interaction (PPI) network of overlapping targets. (C) The PPI network of the core intersection targets. (D) GO enrichment analysis based on core intersection genes. (E) KEGG enrichment analysis based on core intersection genes. (F) The plot of drug-disease-target genes network established by Cytoscape software
Fig. 6
Determination of potential targets and mechanisms of vitamin B2 in regulating osteoclastogenesis through network pharmacological analysis. (A) Venn graph showing the intersection targets of vitamin B2 and genes related to osteoclastogenesis/bone resorption. (B) The protein-protein interaction (PPI) network of overlapping targets. (C) The PPI network of the core intersection targets. (D) GO enrichment analysis based on core intersection genes. (E) KEGG enrichment analysis based on core intersection genes. (F) The plot of drug-disease-target genes network established by Cytoscape software
The DAVID database was used to perform GO enrichment and KEGG pathway analyses based on the selected core target genes, and the results were presented in Figs. 5 and 6. According to the results, the top 10 entries for GO terms and KEGG pathways were visualized. Specifically, regarding the core targets for osteogenesis regulated by riboflavin, the biological process (BP) mainly focused on inflammatory response, response to xenobiotic stimulus, positive regulation of transcription by RNA polymerase II, negative regulation of transcription by RNA polymerase II, etc., and cell composition (CC) mainly included histone deacetylase complex, external side of plasma membrane, transcription regulator complex, etc., while molecular function (MF) primarily involved in protein lysine deacetylase activity, histone deacetylase activity, DNA-binding transcription factor binding (Fig. 5D), and so on. Additionally, the enriched KEGG pathways based on the aforementioned core target genes mainly included neutrophil extracellular trap formation, HIF-1 signaling pathway, longevity regulating pathway, p53 signaling pathway (Fig. 5E), and so on. The network diagram between riboflavin, osteogenesis and significantly enriched KEGG pathways was further plotted and presented in Fig. 5F.
Similarly, regarding the core targets for osteoclastogenesis regulated by riboflavin, the related terms for BP, CC and MF were inflammatory response, response to xenobiotic stimulus, response to lipopolysaccharide, etc., and histone deacetylase complex, protein-containing complex, transcription regulator complex, etc., and DNA-binding transcription factor binding, protein lysine deacetylase activity, histone deacetylase activity, etc., respectively (Fig. 6D). Moreover, the KEGG pathways associated with these core target genes included neutrophil extracellular trap formation, longevity regulating pathway, riboflavin metabolism, AGE-RAGE signaling pathway in diabetic complications, sphingolipid signaling pathway, p53 signaling pathway, HIF-1 signaling pathway (Fig. 6E), and so on. The relationship between riboflavin, osteoclastogenesis and significantly enriched KEGG pathways, as revealed by the drug-target-pathway network, was shown in Fig. 6F.
Comments (0)