
Remember me


This study enrolled retrospectively adult patients who underwent cardiac surgery at the Department of Cardiovascular Surgery, The First Affiliated Hospital with Nanjing Medical University, from January 2015 to March 2024. Inclusion criteria for patients: (1) undergoing isolated CABG or combined CABG and heart valve surgery; (2) receiving preoperative, intraoperative, or postoperative IABP support therapy during cardiac surgeries. Exclusion criteria for patients: (1) receiving prophylactic preoperative IABP use; (2) clinical information missing more than 30%. After applying the exclusion criteria, a total of 15 patients were removed from the initial cohort, resulting in a final study population of 236 individuals. All patients underwent cardiac surgery under the condition of cardiopulmonary bypass. Patients who received IABP implantation prior to the initiation of surgery were classified as the “preoperative IABP group,” whereas those who underwent IABP placement intraoperatively or postoperatively were categorized as the “non-preoperative IABP group.” This study adhered to the principles outlined in the Declaration of Helsinki (2013 revision) and received approval from the Ethics Committee of The First Affiliated Hospital with Nanjing Medical University (approval number: 2024-SR-278). Given the retrospective design of the study, the Ethics Committee granted a waiver for the requirement of informed consent from the patients.
Indications for IABP implantationPatients during the perioperative period received IABP support therapy when they presented with cardiogenic shock. Cardiogenic shock is characterized by sustained decline in systolic blood pressure (< 90 mmHg for over 30 min) attributed to impaired cardiac output, necessitating inotropic agents or mechanical circulatory support to preserve hemodynamic stability and end-organ perfusion. In this study, the decision to initiate IABP support was guided by considering a combination of established Chinese expert consensus (e.g., the Chinese expert consensus on perioperative mechanical circulatory support) and prior published literature [3, 18, 19].The specific indications of IABP use in our study were: (1) prolonged systolic blood pressure < 90 mmHg; blood pressure decreasing progressively or extremely unstable blood pressure levels under treatment of two vasoactive drugs; (2) after fluid therapy, cardiac output decreasing significantly and less than 2.0 L/(m2 min); (3) mean arterial pressure < 50 mmHg, urine volume < 0.5 mL/(kg h); (4) acute cardiogenic pulmonary edema due to coronary artery disease (left atrial pressure [LAP] > 20 mmHg, central venous pressure [CVP] > 15 mmHg); (5) mechanical complications of acute myocardial infarction (AMI), such as papillary muscle dysfunction or rupture, ventricular septal perforation, etc. The percutaneous implantation of IABP into the descending aorta was exerted at the bedside by experienced intensivists from the cardiac surgery ICU, who were proficient in percutaneous circulatory support techniques. Post-insertion verification of the IABP position was conducted using either a chest radiograph or fluoroscopy. The IABP-related parameters were adjusted to achieve balloon inflation at a ratio of 1:1 or 1:2, synchronized with either aortic blood flow or electrocardiogram signals. The duration of IABP support therapy was determined at the discretion of the attending physician, based on the patient’s hemodynamic stability and clinical tolerance to IABP-related complications.
Data collection and statistical analysisData were extracted from the hospital’s electronic medical records (EMR) system, encompassing demographic characteristics, medical history (hypertension, diabetes mellitus [DM], chronic kidney disease [CKD], atrial fibrillation [AF], atrioventricular block [AVB], AMI, and stroke), New York Heart Association (NYHA) classification, as well as electrocardiogram, echocardiogram, coronary angiography, and laboratory test results. Overweight was defined as a body mass index (BMI) ≥ 24.0 kg/m², and the BMI was calculated using the standard formula: BMI = weight (kg) / [height (m)]². The laboratory indicators included myocardial injury biomarkers, liver function, kidney function, serum lipid levels, fasting blood glucose (FBG), hemoglobin A1c (HbA1c), and routine blood test. The detection was performed within 24 h after admission. Furthermore, the information on length of hospital stay (LOS), length of ICU stay (LICU), and in-hospital mortality were documented by the EMR system. Operation-related parameters, including emergency surgery, total operation time (TOT), and cardiopulmonary bypass time (CBT) were also recorded. Missing data were handled using multiple imputation with the “mice” package (version 3.12.0) in R, generating 10 imputed datasets. The final dataset used for model training and evaluation was derived by averaging the imputed values. No abnormal values were identified in the dataset, and all features were used in their original form without normalization and standardization. No features underwent encoding or transformation prior to analysis.
Continuous variables with a normal distribution were presented as means ± standard deviation (SD), with inter-group comparisons performed using the Student’s t-test. For continuous variables with a non-normal distribution, values were expressed as medians (interquartile range, Q25-Q75), and the Mann-Whitney U test was used for comparisons. Categorical variables were reported as frequencies (percentages), with the chi-square test applied for inter-group comparisons of unordered categorical variables and the Mann-Whitney U test for ordered categorical variables. All statistical analyses were conducted using SPSS software (version 23.0), with p < 0.05 considered statistically significant.
Feature selection by cross-validation least absolute shrinkage and selection operator (LassoCV) algorithmThe LassoCV algorithm achieves a more refined model by incorporating a penalty function that shrinks specific regression coefficients, thereby constraining the sum of their absolute values to remain below a predefined threshold [20]. Additionally, it enforces some regression coefficients to be exactly zero. Consequently, it preserves the benefits of subset selection while acting as a biased estimator, effectively managing complex collinearity in data analysis. The LASSO model effectively reduces the coefficients associated with irrelevant features to zero, thereby accomplishing feature screening [21]. Specifically, the model constructed with the use of the LassoCV algorithm was able to screen for variables that were strongly associated with preoperative IABP implantation (i.e., included measures). In this study, the initial 54 features were screened by the LassoCV algorithm.
Machine learning model development and validationTo enhance the robustness of the analysis, the dataset was randomly partitioned into the training and validation sets in a 9:1 ratio. Using the selected variables, a total of six machine learning algorithms, including logistic regression, AdaBoost, Gaussian Naïve Bayes (GNB), Complement Naïve Bayes (CNB), support vector machine (SVM), and multi-layer perceptron (MLP), were implemented for model development. All models were trained and internally validated by using 10-fold cross-validation (CV) [22]. To ensure the reproducibility of the experiment, fixed random seeds were employed during the dataset partitioning. This approach can guarantee consistent splitting of the data into the training and validation sets upon each execution, allowing for reliable validation and comparison of the results. The training set was utilized for model development, while the validation set was reserved for performance evaluation.
Logistic regression is considered as an algorithm for building machine learning model that utilize logistic functions based on the linear regression to predict categorical variables with a high accuracy and reliability. The AdaBoost is a deeply classic representative of boosting algorithms, and it trains the subsequent base classifier by modifying sample weights of the previous one and performs a linear weighted combination of all base classifiers to make final prediction. The GNB classifier is an efficient supervised learning algorithm that applies Bayes’ theorem under assumption of feature independence and Gaussian-distributed inputs, enabling rapid estimation of class probabilities for classification tasks. The GNB algorithm has been successfully applied across the diverse scientific domains, consistently demonstrating superior performance even when considering a limited number of variables. The CNB model is a variant of the Multinomial NB model that incorporates Complement Naive Bayes algorithm. The CNB can utilize statistics derived from the complement class to determine the weights of the model, making it particularly well-suited for imbalanced datasets. The SVM is grounded in statistical learning theory and seeks to minimize generalization error by constructing an optimal hyperplane in a high-dimensional space, maximizing the margin between feature vectors from different classes to achieve effective separation. The MLP is a neural network model that employs a feedforward architecture, consisting of multiple fully connected layers, where nonlinear transformations are applied through activation functions to process the input data.
Machine learning model evaluation and applicationThe performance evaluation of prediction models includes differentiation and calibration degree. The receiver operating characteristic (ROC) curve was constructed, and area under the ROC curve (AUC) was then computed to assess the models’ discriminatory ability. In addition, performance metrics, including accuracy (ACC), specificity, sensitivity, positive predictive value (PPV), negative predictive value (NPV), and F1-score, were employed for further evaluation. The final predictive model was selected according to its superior overall performance, particularly in terms of the AUC. In simple terms, based on the highest AUC value, the other indicators mentioned above were comprehensively considered. If a model had the best performance in both the training set and the validation set, it would be selected as the final prediction model for the dataset of and for analyzing the weight of characteristic factors affecting preoperative IABP implantation. Subsequently, the clinical net benefit curve obtained through the application of decision curve analysis (DCA) was utilized for evaluating clinical net benefits in the predictive model. The Kolmogorov-Smirnov (KS) plot was utilized to assess the predictive model’s ability to distinguish between risk groups, with the KS statistic quantifying the maximum divergence between the cumulative distributions of predicted probabilities for positive and negative cases [23]. Generally, KS values between 0.3 and 0.5 indicate that the model is well differentiated.
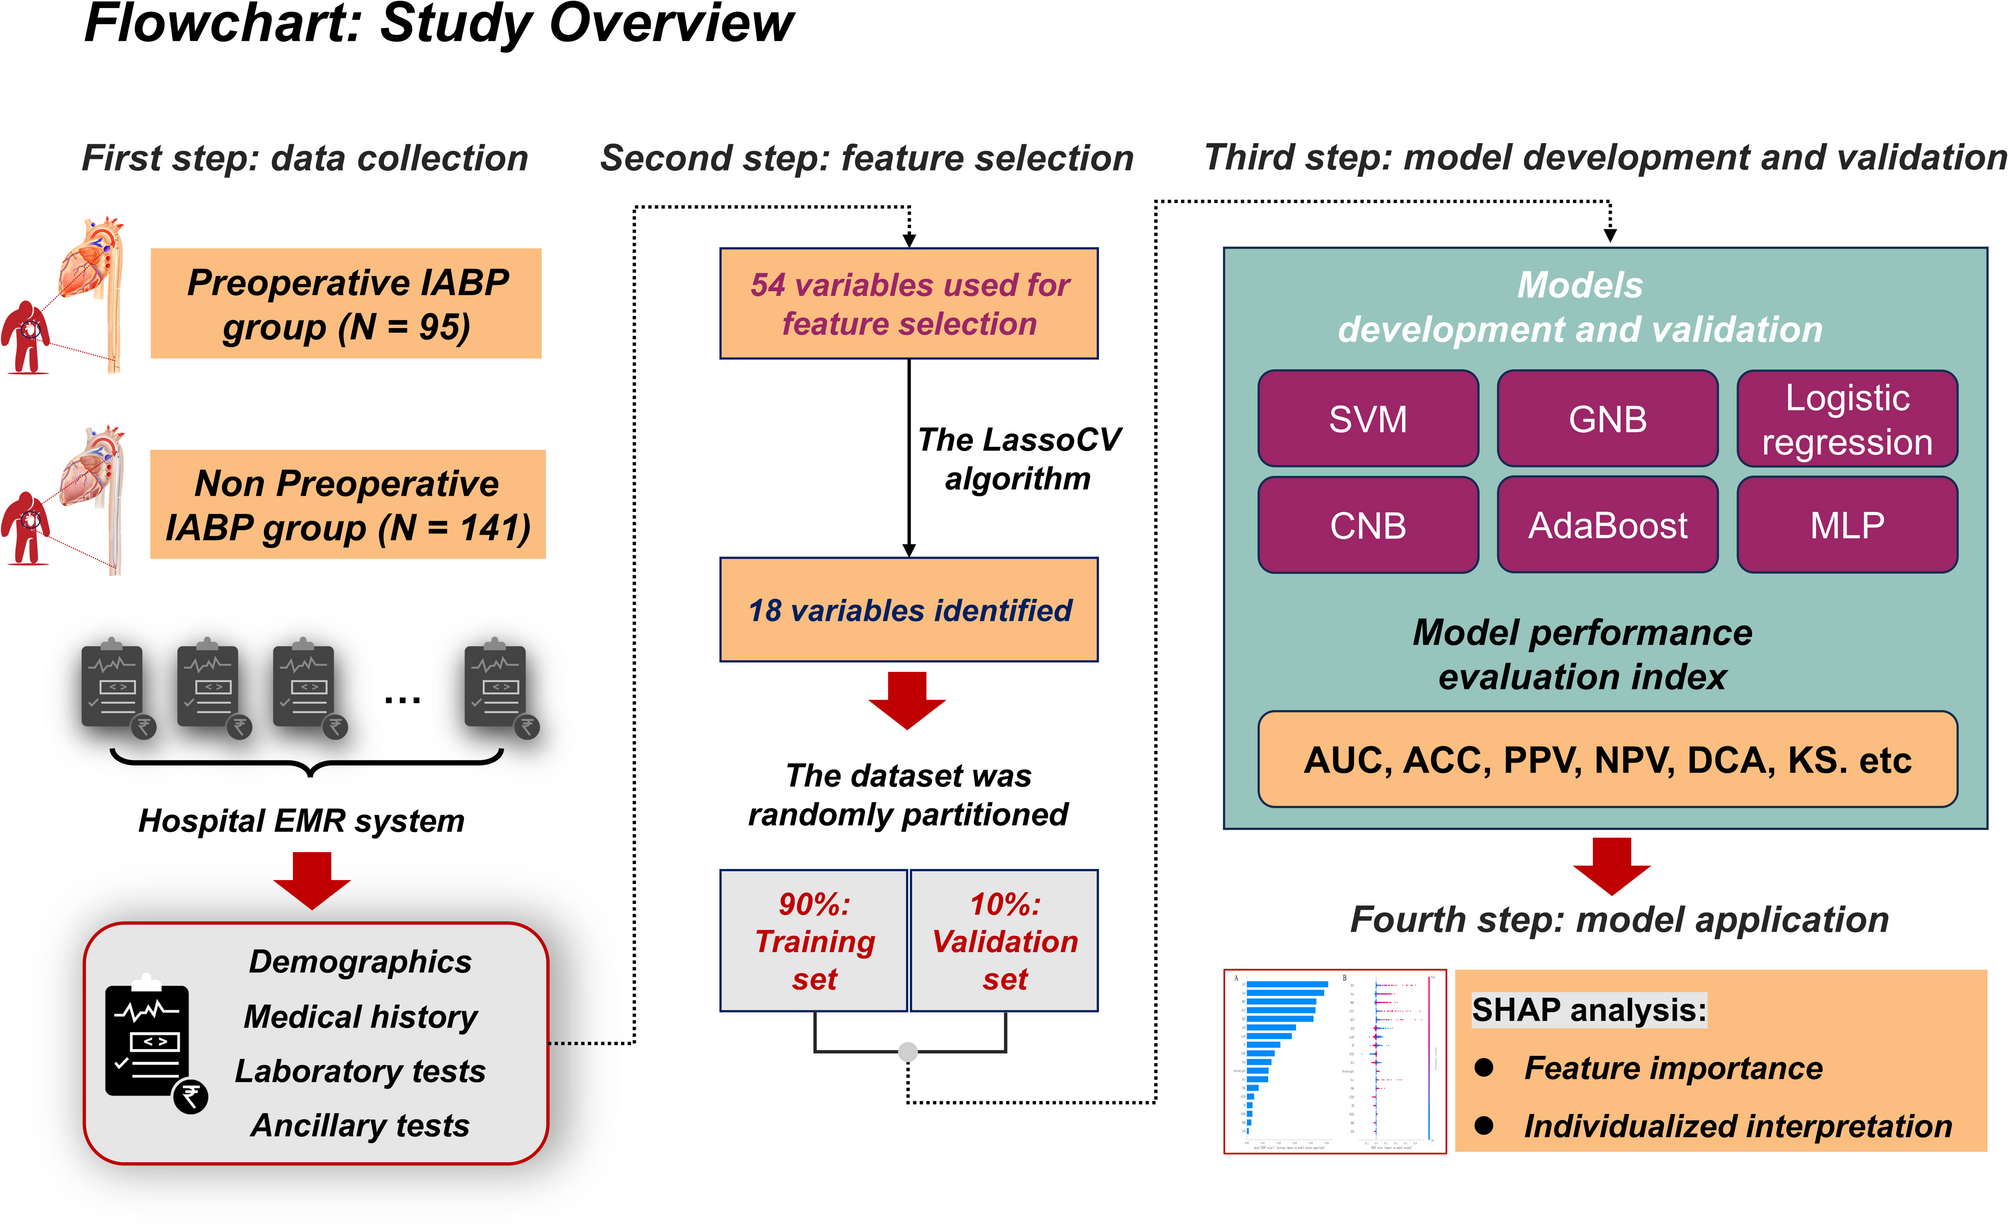
To enhance the interpretability of the final predictive model, we applied the SHapley Additive exPlanations (SHAP) method, a technique that helps to explain the contribution of each feature to the model’s predictions in a transparent manner [22]. First, the SHAP summary plot was employed to show the overall importance of each variable, providing insight into which clinical factors, such as laboratory indicators or demographic information, had the most significant impact on the model’s output. Then, the SHAP dependency plots were utilized to explore how variations in specific features influenced the model’s prediction, allowing for a deeper understanding of the relationships between individual factors and the model’s decision-making process. To provide a more personalized view, the SHAP force plot was next employed to visually represent how key features, such as the presence of certain risk factors or specific medical conditions, influenced the model’s prediction for the patient, offering a valuable insight into individual risk profiles. The flowchart in Fig. 1 illustrates the overall process of the study, from data collection to model development and evaluation, providing a clear understanding of how the analysis was conducted.
Fig. 1
Flowchart of this study. IABP, intra-aortic balloon pump; EMR, electronic medical record; LassoCV, cross-validation least absolute shrinkage and selection operator; MLP, multi-layer perceptron neural network; SVM, support vector machine; CNB, Complement Naïve Bayes; GNB, Gaussian Naïve Bayes; AUC, area under receiver operating characteristic (ROC) curve; ACC, accuracy; PPV, positive predictive value; NPV, negative predictive value; DCA, decision curve analysis; KS, Kolmogorov-Smirnov; SHAP, SHapley Additive exPlanations
Comments (0)