Data source and extraction
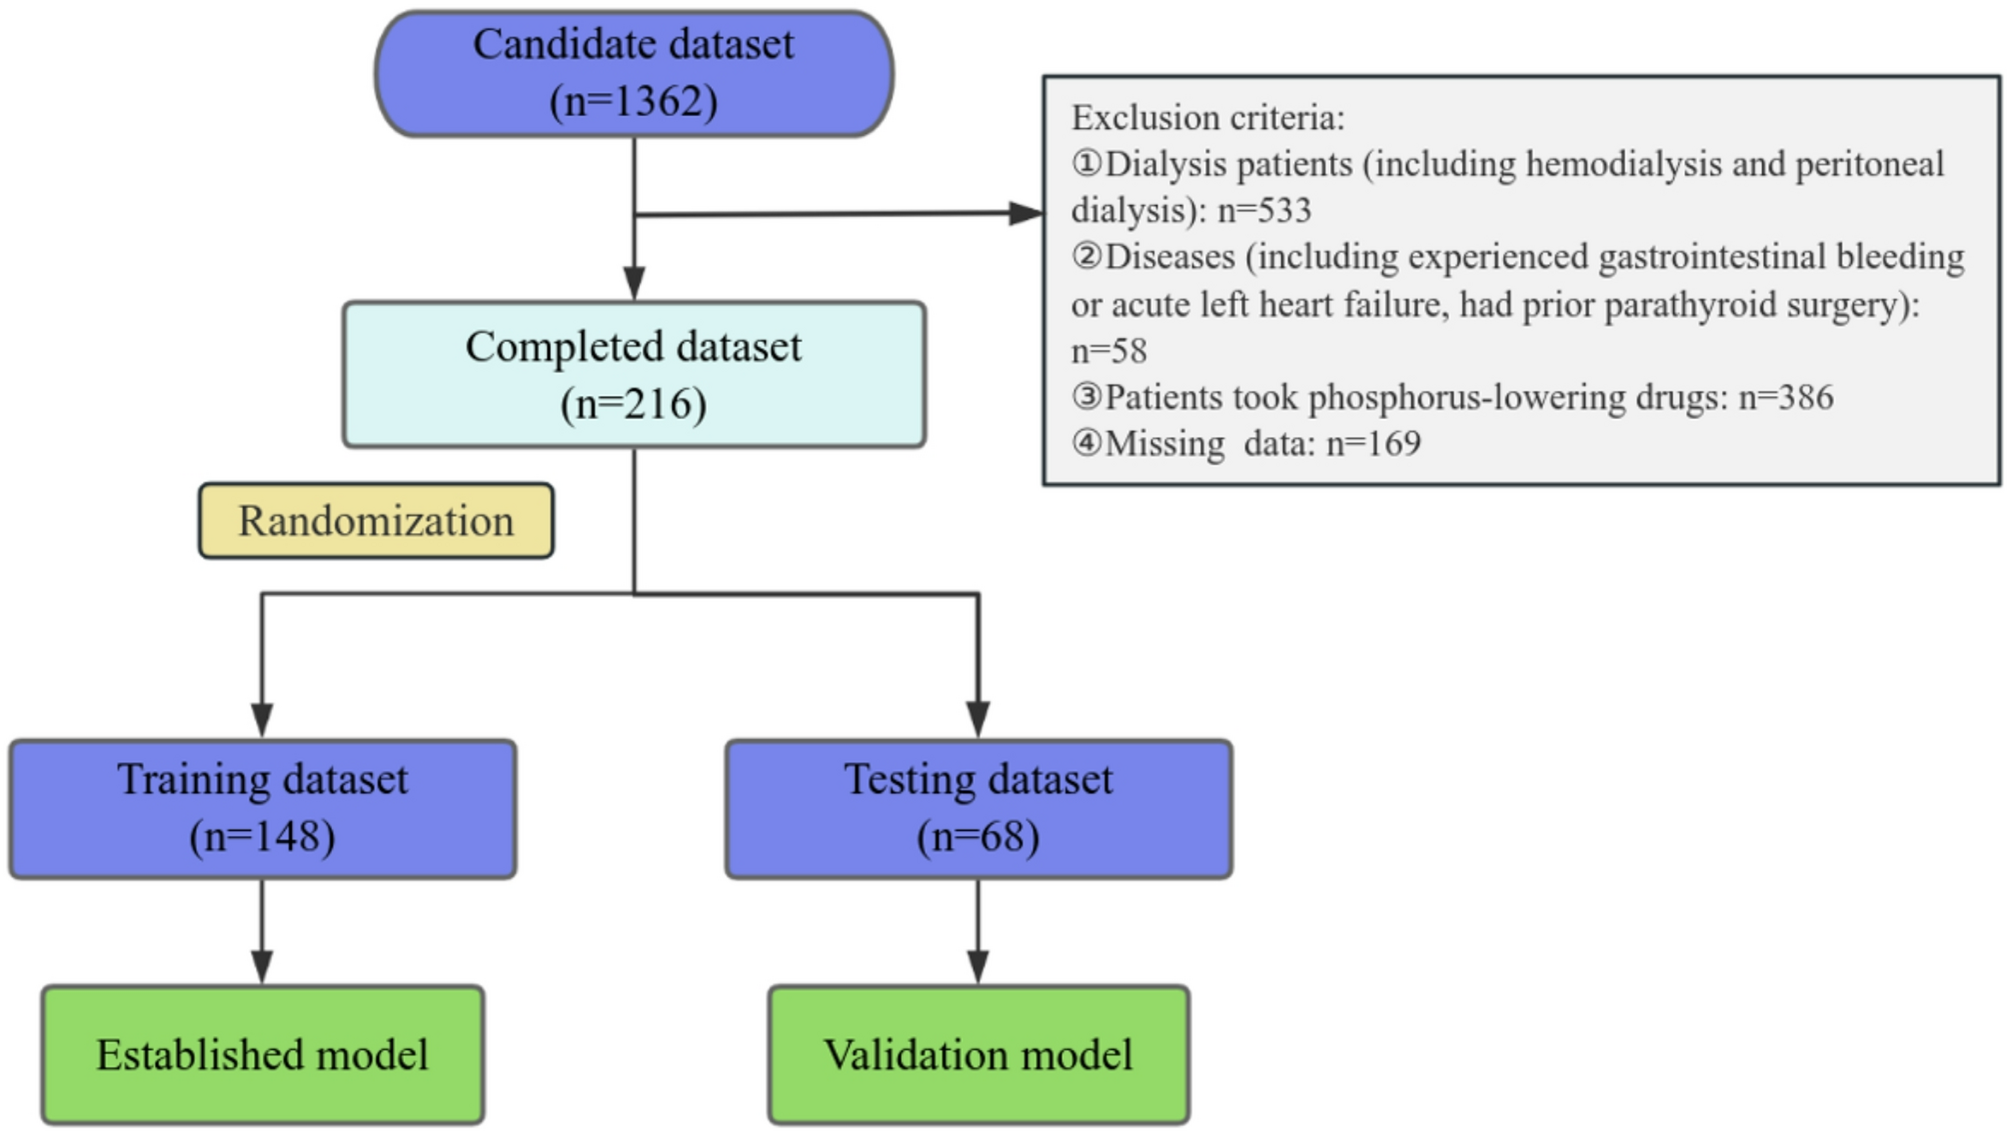
The study included 1362 patients with CKD discharged between January 2021 and December 2023 from the Department of Nephrology, Nanping First Hospital Affiliated to Fujian Medical University. Cases were extracted from the inpatient electronic medical record system. Data included basic information (sex, age, alcohol consumption, and smoking history), concomitant diseases (e.g., hypertension, diabetes, and coronary atherosclerosis), therapeutic agents (e.g., dagagliptin, oral iron, human erythropoietin injection, roxadustat capsules, intestinal detoxifying agents, and renal care agents), and laboratory indicators (e.g., hemoglobin [HGB], electrolytes, renal function, alkaline phosphatase, ferritin, transferrin saturation, parathyroid hormone [PTH], and urinary protein levels).
Patients were excluded if they met any of the following criteria: (1) < 18 years of age, (2) subjected to dialysis, (3) treated with phosphorus-lowering drugs (including patients who had previously taken and those who were currently taking phosphorus-lowering drugs), (4) had experienced gastrointestinal bleeding or acute left heart failure, (5) had prior parathyroid surgery, or (6) missing data. This study was conducted in accordance with the Declaration of Helsinki and approved by the Ethics Committee of Nanping First Hospital affiliated to Fujian Medical University (approval number: NPSY202401007). Owing to the retrospective nature of the study, the requirement for written informed consent was waived.
Definition of CKD stages and hyperphosphatemia
According to the KDIGO Improving Global Outcomes guidelines, CKD is any abnormality of kidney structure or function with a negative health impact that persists for a minimum of 3 months. Kidney disease was categorized based on estimated GFR (eGFR) values, which correlate with progression risk [13]: G1 (eGFR ≥ 90 mL/min/1.73 m2), G2 (60–89 mL/min/1.73 m2), G3a (45–59 mL/min/1.73 m2), G3b (30–44 mL/min/1.73 m2), G4 (15–29 mL/min/1.73 m2), and G5 (< 15 mL/min/1.73 m2). Cystatin C was used to calculate eGFR in the hospital laboratory.
Hyperphosphatemia was diagnosed when serum phosphorus exceeded 1.45 mmol/L. For patients with G3a–G5 stage CKD, the 2017 KDIGO guidelines recommend maintaining their blood phosphorus levels close to the normal range [14].
Statistical analysis
SPSS version 29.0 (IBM Corp., Armonk, NY, USA) and RStudio version 4.4.2 (R Foundation for Statistical Computing, Vienna, Austria) were used for statistical analysis and mapping. The dataset was randomly partitioned into training and validation sets in a 7:3 ratio for comparative analysis. For continuous variables, normally distributed data are expressed as mean ± standard deviation and non-normally distributed data as median (range); categorical variables are represented as percentages. Intergroup comparisons were performed using Student’s t-test, chi-square test, or Mann-Whitney U test, with Fisher’s exact test applied when appropriate. To evaluate the relationship between variables, Pearson’s correlation analysis was performed for normally or near-normally distributed data, whereas Spearman’s correlation analysis was applied to non-normally distributed data. Thirty-two training set predictors were screened using least absolute shrinkage and selection operator (LASSO) regression and then used in a 10-fold cross-validation analysis to yield the minimum criteria (lambda.min). The optimal lambda was determined to be one standard error of the minimum criterion (Lambda.1se) [15]. Higher lambda values enforce stronger regularization in the LASSO regression, driving more coefficients to zero and yielding a simpler model.
Selected variables were included in a multivariate logistic regression to determine an independent risk score of hyperphosphatemia incidence. Subsequently, this score was used to establish a risk prediction model. Variance inflation factor (VIF) was used to assess multicollinearity. Significance was set at p < 0.05 (two-tailed test).
The nomogram prediction model was developed in RStudio and internally validated with validation and full datasets. The discriminatory power of the model was assessed through receiver operating characteristic (ROC) analysis, demonstrating preferable forecast performance with an area under the curve (AUC) of > 0.7. The Hosmer–Lemeshow test was used to evaluate model fit. Calibration curves were used to examine the applicability of the model in clinical settings through decision curve analysis (DCA). Subgroup analyses stratified by age, sex, and CKD stage were conducted to evaluate model robustness. The nomogram was constructed using the rms package, whereas ROC curves and corresponding AUC values were generated using the pROC package. Calibration curves were plotted using the val.prob() function in the rms package, and DCA curves were generated using the rmda package.


Comments (0)