Study design
Retrospective audit of inpatient admission data from 2nd April 2022 to 22nd February 2023 as part of a Population Health Fellowship in Chronic Kidney Disease and University of Manchester Medical School– medical student Applied Personal Excellence Project. Primary aims: to measure total and coded/uncoded CKD prevalence on admission and discharge, and conversion of uncoded to coded CKD in secondary care. Secondary aims: to map coding status to kidney health inequality themes and to measure predictors of coding, death and AKI. Diagnosis and coding of CKD are key standards within NICE CKD guidelines [1] and the primary care Quality and Outcomes Framework (QOF) [7], and are further supported by expert consensus [12].
Setting, participants and data sources
All adult patients admitted to the 21-bed Clinical Assessment Unit in Rochdale Care Organisation (RCO), including multiple admissions by the same patients, were included. Inpatient admission data were extracted from the electronic health record (EHR)– HealthViews.
Ethical approval
Ethical approval was not required for this audit as per UK Health Research Authority (HRA) guidance which was registered with and endorsed by the Northern Care Alliance (NCA) National Health Service (NHS) Foundation Trust Research and Innovation department (project code: 23HIP17).
Variables
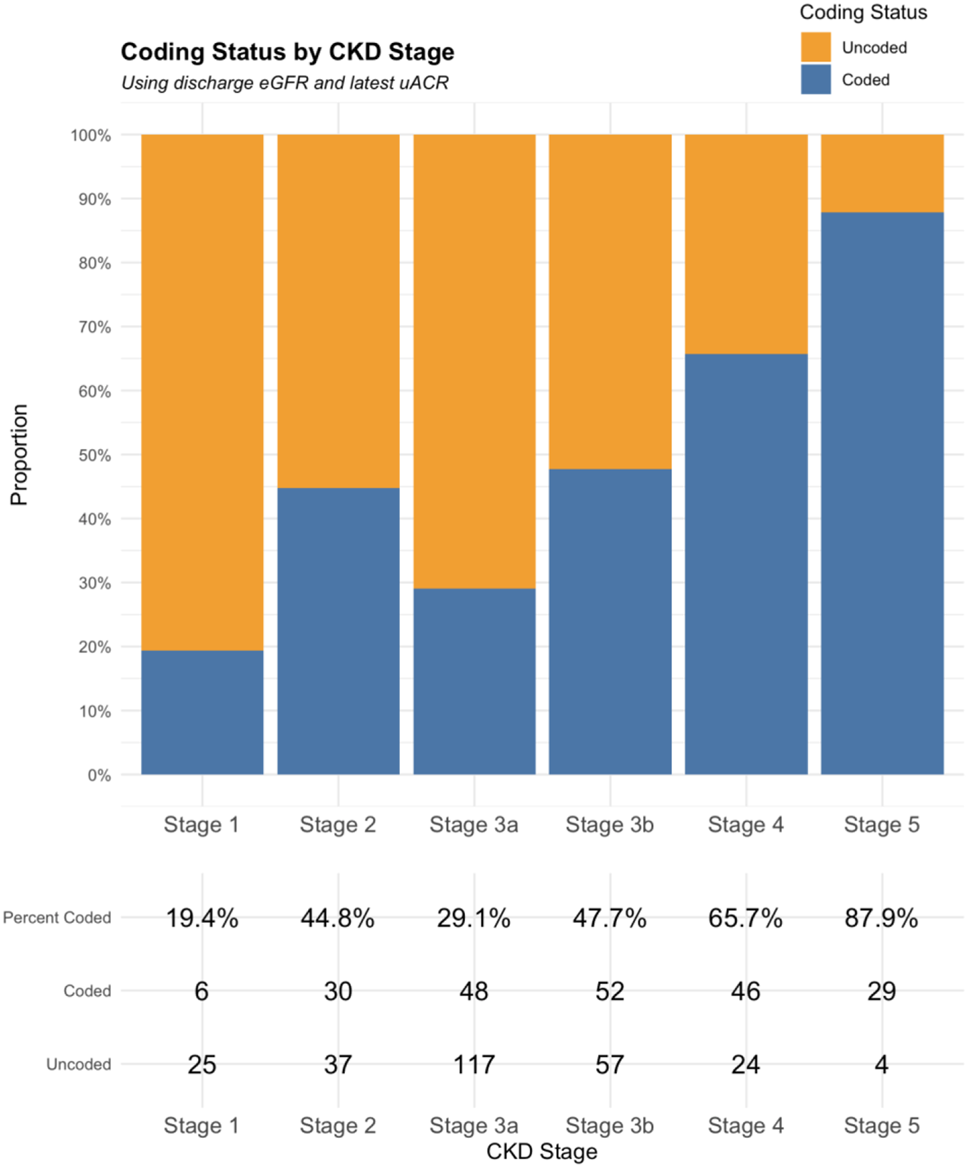
The following outcomes were used: prevalence estimates, calculated as the proportion of patients with the outcome of interest (numerator) divided by the total number of patients in the relevant group (denominator), expressed as a percentage; coded CKD based on admission or discharge eGFR and latest uACR in preceding 12 months; conversion from uncoded to coded CKD at discharge; odds of patients receiving a diagnostic CKD code on discharge, death during admission, and AKI during admission (defined according to KDIGO definition [13]).
Demographic and predictor variables included: age and age groups (17–29, 30–39, 40–49, 50–59, 60 − 59, 70–79, 80–89, 90 + years), sex, ethnicity, GP practice post code– mapped to indices of multiple deprivation (IMD) [14]: a measure of geographical area level deprivation at a low geographical level of approximately 1600 people, measured over several domains (income; employment; education, skills, and training; health deprivation and disability; crime; and housing) - used as a proxy for socioeconomic status; admission and discharge date; first and last creatinine on admission (µmol); uACR (mg/mmol); past diagnostic codes in primary care: CKD, diabetes, hypertension, mental health diagnoses (anxiety, depression, bipolar disorder, schizophrenia and psychosis, self-harm and suicidal ideation, eating disorder, dementia), cancer; diagnoses of AKI and/or heart failure during admission; death during admission. Derived variables included eGFR (ml/min/1.73m2) using the CKD-EPI 2021 equation [15]. CKD was defined and staged according to the KDIGO classification criteria using 2 x eGFR values within 90 days and the latest uACR in the preceding 12 months (if measured) [3]; patients with eGFR > 60 ml/min/1.73m2 without uACR were classified as ‘Not CKD’. Admission eGFR was the first eGFR during admission. Discharge eGFR was the last eGFR during admission. For patients with only one eGFR measured on admission, this was carried forwards as their discharge eGFR. Coded CKD was defined as any patient with biochemical evidence of CKD who either had a diagnostic CKD code in their primary care EHR or who were given a diagnostic CKD code on discharge from hospital. Patients with coded CKD were accepted as having CKD and this diagnosis was not challenged. Uncoded CKD was defined as any patient with biochemical evidence of CKD on discharge without ever having a diagnostic CKD code in their primary care EHR. Kidney health inequality themes are overarching themes which highlight patterns of disparities in kidney health outcomes for patients. Coding status was mapped to kidney health inequality themes of sex, age, ethnicity, socioeconomic status, and mental health diagnoses [10].
Bias
To minimise selection and information bias we included all admitted patients within the prespecified study period and cross-checked hospital level data with primary care EHR data to accurately identify patients with uncoded and coded CKD.
Statistical analyses
R and R Studio were used for data cleaning and analysis, employing packages dplyr, tidyr, logistf, patchwork and ggplot2. Descriptive statistics (counts/percentages for categorical data; mean and standard deviation for continuous data) were reported. Demographics were compared between the total cohort and patients with CKD. Firth’s penalised likelihood method was used for logistic regression analyses to address the sample size limitations and potential separation [16, 17]. Analyses assessed key predictors of diagnostic coding at discharge, in-hospital mortality, and AKI risk during admission. An alpha level of 0.05 was set a priori and 95% confidence intervals (CIs) are presented. Logistic regression assumptions were verified before modelling. Likelihood ratio tests and p-values guided model selection.


Comments (0)