
Remember me


This study was designed to investigate the induction of the SGLT2 overexpression with Fn-LPS in murine diabetic renal tubules and diabetes exacerbation. All experiments were conducted in the Fukuoka Dental College Animal Center following the conditions described elsewhere [10, 14,15,16, 33, 34]. The protocol was approved by the Animal Experiment Committee of Fukuoka Dental College (No. 19010). The 4-week-old male genetically identical ICR mice were purchased from a commercial vendor (Kyudo, Fukuoka, Japan). The number of mice was decided by rules of the Animal Experiment Committee of Fukuoka Dental College based on the viewpoint of animal welfare [10]. This study used 4 groups (9 mice in each group): non-treated control, Fn-LPS-administered non-diabetic control, diabetic control, and Fn-LPS-administered diabetic experimental. The humane endpoints were daily assessed according to the ARRIVE guidelines and mice reaching humane endpoints were euthanized by induction anesthesia with intraperitoneal injections of sodium pentobarbital and cervical dislocation. In this study, all mice were used as the data included in the experimental and control data, and there were no exclusions. The methods of the production of STZ-induced diabetic mice and of the LPS administration in diabetic mice were described elsewhere [14,15,16, 33, 34]. Briefly, a single intraperitoneal injection of STZ (200 mg/kg body weight; Sigma-Aldrich Japan, Tokyo, Japan) in a 0.05 M citric acid buffer at pH 4.5 (20 mg/ml) and a single Fn-LPS injection under the buccal mucosa were performed to mice under inhalation anesthesia, and blood glucose concentrations were checked by a Glutest Sensor (Sanwa Kagaku Kenkyusyo CO., LTD., Nagoya, Japan) twice a week after the administrations of STZ and Fn-LPS. Most studies for the STZ-induced murine diabetes model consider blood glucose levels over 300 mg/dL as a sign of diabetes and 50% of mice commonly become diabetic two weeks after STZ administration with blood glucose levels in the 300 to 600 mg/dl range [39, 40]. In this study mice with blood glucose levels above 300 mg/dl were determined to be diabetic, and mice with blood glucose levels above 600 mg/dl were used in the renal immunohistochemical study as the severe diabetic model according to our previous studies [14,15,16, 33, 34]. The dosage of Fn-LPS (3 mg/kg) was determined according to our previous studies and it was confirmed that the Fn-LPS dosage has no effect on the health condition of these ICR mice (Fig. 1) [33, 34]. There are many reports that the amount of LD50, given all at once, for LPS of the reference strain like Escherichia (E.) coli 0111:B4 (Sigma-Aldrich, St. Louis, MO, USA) which causes the death of one half of a group due to the endotoxin shock caused by intraperitoneal administration to C57BL6 mice at 5–6 weeks of age is approximately 27–30 mg/kg. Fusobacterium (F.) nucleatum is a normal inhabitant of the oral cavity and its proliferation causes periodontitis, but there have been rare cases invade vascular from the oral to cause sepsis worldwide. Since it was assumed that the lethality and physiological toxicity of septic shock by F. nucleatum LPS would be much lower than that of E. coli LPS, in this experiment the same amount of LPS was administered as in the previous experiment with P. gingivalis LPS [41, 42]. Urine and blood samples of diabetic mice with Fn-LPS were collected after euthanasia on the day the mice reached humane endpoints, and of other mice were collected on the day the last diabetic mice with Fn-LPS reached humane endpoints. The samples were analyzed for urine albumin by albumin ELISA kit (Bethyl Laboratories, Inc. Montgomery, Texas, USA), for blood urea nitrogen (BUN) by DetectX (BUN detection kit, Arbor Assays LLC, Ann Arbor, MI, USA), and for blood creatinine (CRE) by LabAssay (Fujifilm Wako Pure Chemical Corporation, Osaka, Japan). Survival curves of control and diabetic mice with/without Fn-LPS were plotted from the day blood glucose levels reached the diabetic range described above.
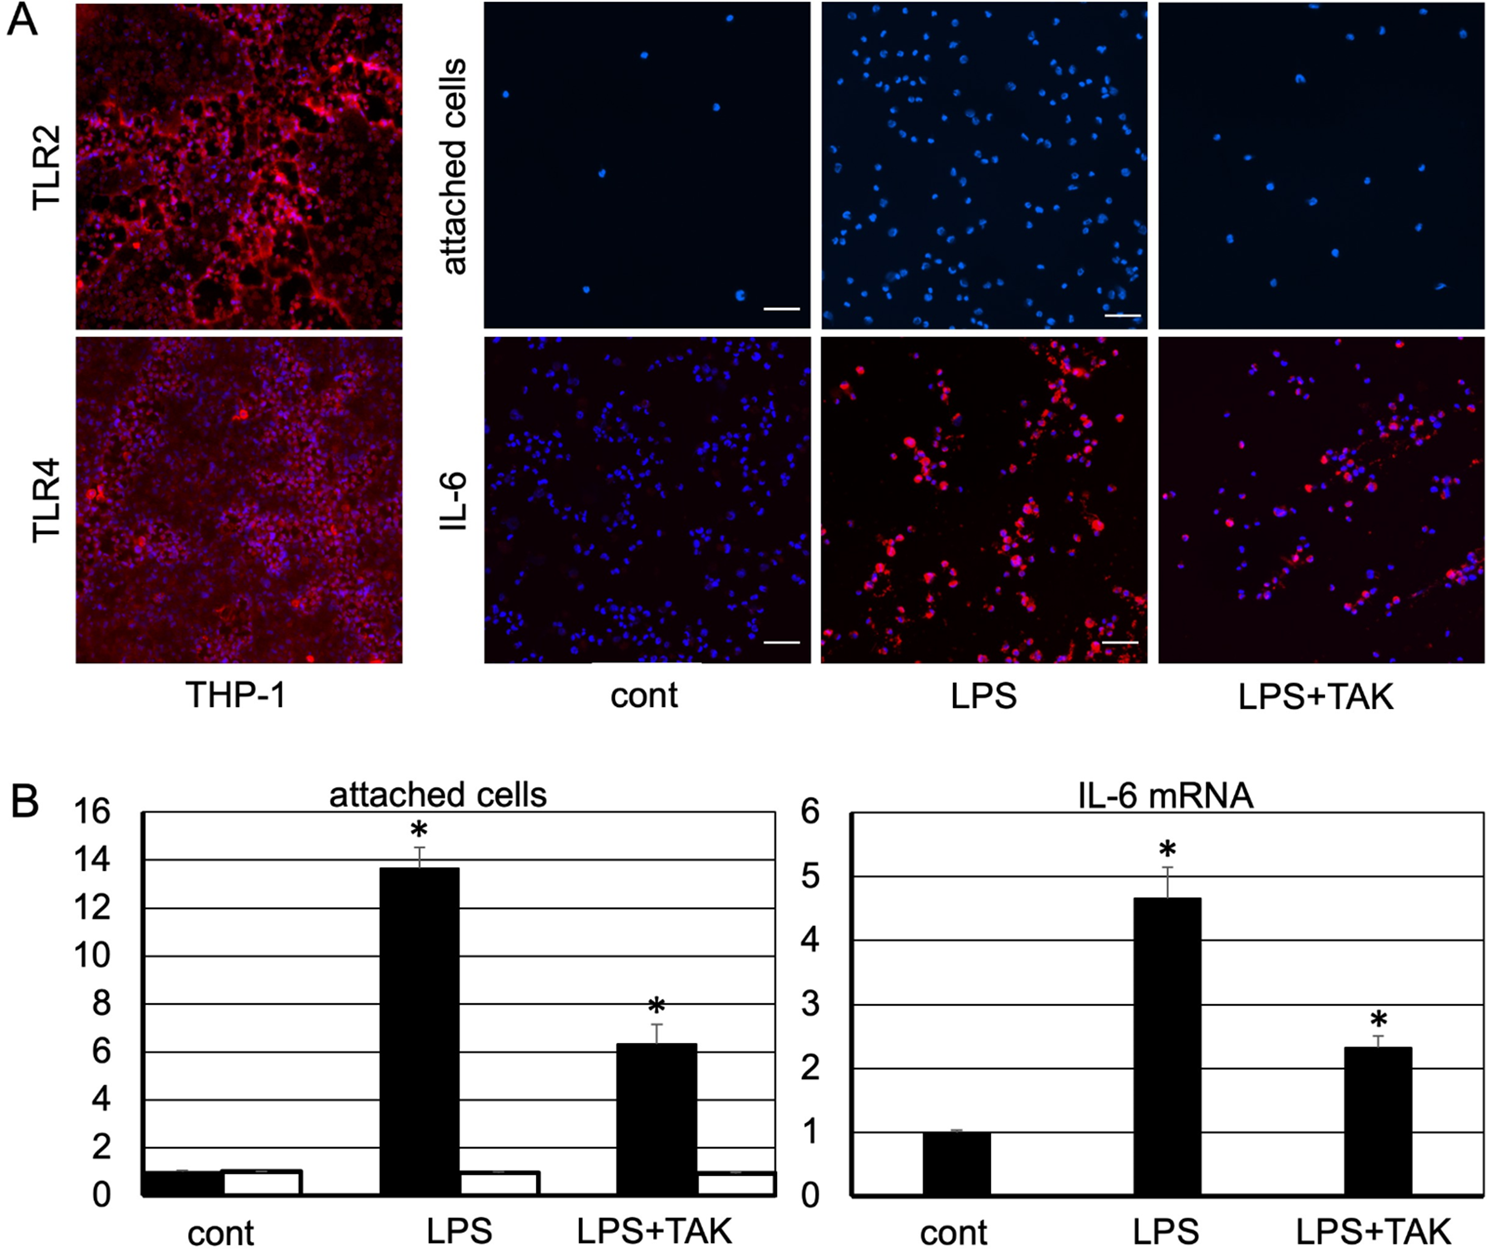
Fig. 1
Analysis for the antigenicity of Fn-LPS to THP-1 cells. A. Cell adhesion test and immunostaining by anti-IL-6. Left panels: immunostaining for TLR2 and TLR4 on human monocyte-macrophage-like THP-1 cells cultured without any treatment. It is found that THP-1 cells usually express TLR2 and TLR4. Right top panels: THP-1 cells cultured without any treatment as a control (cont) and with Fn-LPS (LPS) / LPS and TLR4 antagonist TAK-242 (LPS + TAK). Attached cells after the treatment are stained by DAPI in blue. The THP-1 cells are floating cells, attached cell assemblies differentiated into macrophage-like cells are more numerous in the culture of LPS-treated cells than in the control, and there are fewer in culture of LPS + TAK-treated cells than in the culture of LPS-treated cells. Right bottom panels: immunostaining with anti-IL-6 in red on all the cells collected by trypsinization and centrifugation. The nuclei are counterstained by DAPI in blue. The control cells are not stained but the LPS-treated cells are strongly stained. The LPS + TAK-treated cells are immunostained less than the LPS-treated cells. Bar: 100 μm. B. Quantitative analysis for the amounts of attached cells and IL-6 mRNA from all cells. The THP-1 cells were cultured without Fn-LPS (LPS) or TLR4 antagonist TAK-242 (TAK) as a control (cont) and cultured with LPS/LPS + TAK. The amounts of attached cells were determined by the absorbance at 450 nm for the medium containing metabolites of a cell counting kit (solid bars). All data were normalized to the amount of control cells and expressed relative to the control in arbitrary units. The amounts of attached cells were larger in LPS-treated cells than in cells without any treatment, and less in LPS + TAK-treated cells than in LPS-treated cells only. The amounts of alive cells in culture with both attached and floating cells were determined by the absorbance of medium containing metabolites of a cell counting kit at 450 nm. There were no significant differences in the number of alive cells among cultures (open bar) and the viability of THP-1 cells was not influenced by LPS and TAK. The antigenicity of LPS to THP-1 cells was also evaluated by the IL-6 mRNA production and the inhibitory effect of TAK. The target gene cDNA from the total cell volumes, attached and floating, in culture were normalized to β-actin cDNA. All data were expressed relative to the control in arbitrary units. The amounts of IL-6 mRNA were for cells with LPS than in cells without any treatment, and smaller in cells with LPS + TAK than in cells with LPS only. *Significantly different from the other two in ANOVA (P < 0.001)
CellsThis study used the human monocyte-macrophage-like cell line (THP-1, JCRB0112, Japanese Collection of Research Bioresources, Ibaraki, Japan) and mouse monocyte-macrophage-like cell line (J774.1, JCRB0018, Japanese Collection of Research Bioresources) to examine the activity of purified Fn-LPS described below. The cells were cultured in RPMI1640 with 10% fetal calf serum in the usual culture condition. This study also used C57BL/6 mouse primary proximal tubular epithelial cells (C57-6015, Cell Biologics Inc., Chicago, IL) to examine the SGLT2 expression with mouse recombinant TNF-α (R&D Systems Inc., Minneapolis, MN). The cells were cultured in the epithelial cell medium (M6621, Cell Biologics) in the usual culture condition. The MC3T3-E1 cells (RCB1126, RIKEN BioResource Research Center, Tsukuba, Japan) were also used as a negative control for the immunostaining with anti-SGLT2 cultured in α-MEM.
Bacterial cultureF. nucleatum (ATCC 25586) were cultured in Gifu anaerobic medium (Code 05422, Nissui Pharmaceutical Co., Ltd., Tokyo, Japan) in an anaerobic jar for 7 days at 37 °C until the absorbance at OD595 = 1.0, adjusted to 1.0 × 10⁸ CFU /ml and the colonies were counted on the agar plate (Nissui Plate 51041, NK-containing ABHK agar; Shimadzu Diagnostics Corporation, Tokyo, Japan) according to the manufacturer’s instructions. Bacterial cells were harvested by the centrifugation at x 4000 x g for 30 min and the pellet was heat-inactivated at 60 °C for 1 h to confirm the absence of growth on the Nissui plate (Shimadzu).
Purification of periodontal pathogen F. Nucleatum LPSThis study used F. nucleatum (ATCC 25586) to examine the SGLT2 overexpression in the renal proximal tubular epithelial cells with Fg-LPS in vitro and in vivo. The F. nucleatum membrane components including LPS termed as Fn-LPS was purified using a LPS extraction kit (iNtRON Biotechnology, Inc., Seongnam, Korea). The activity of purified Fn-LPS was determined by the RT-PCR analysis to determine the increase of interleukin-6 (IL-6) mRNA expression in the THP-1 cells and the inhibition of the IL-6 mRNA production by the TLR4 Inhibitor TAK-242 (Sigma-Aldrich Japan, Tokyo, Japan) which inhibits IL-6 production with IC50 of 1.3 nM. All were performed according to the manufacturer instructions and previous studies [43,44,45]. The THP-1 cells (1.0 × 10⁸/well) were treated with RPMI1640 culture medium containing LPS (100 ng/ml) or LPS (100 ng/ml) and TAK-242 (1 µM, Sigma-Aldrich Japan) in a 6-well plate for 24 h. After the treatment the attached cells were trypsinized and collected by centrifugation with the floating cells, and the cell pellets were analyzed by real-time PCR described below. The LPS yield was quantified at 545 nm using a ToxinSensor (LAL Endotoxin Assay Kit, GenScript Biotech Corporation, Piscataway, NJ, USA) and a microplate reader.
Cell viability assayThe viabilities of the cells cultured with medium containing LPS (100 ng/ml), TAK-242 (1 µM, Sigma-Aldrich Japan), and recombinant mouse TNF-α (10 pg/ml, sodium azide free, R&D Systems) were tested using water soluble tetrazolium salts WST-8 (2-(2-methoxy-4-nitrophenyl)-3-(4-nitrophenyl)-5-(2,4-disulfophenyl)-2 H-tetrazolium) of a Cell Counting Kit-8 (Dojindo Molecular Technologies, Inc., Tokyo, Japan). The dosages were determined according to the data sheets and previous studies [46,47,48,49]. The nicotinamide adenine dinucleotide produced by intracellular dehydrogenase in mitochondria reduces WST-8 to orange formazan dye via 1-methoxy-5-methylphenazinium methylsulfate. Since the amount of formazan dye as a reduction product of WST-8 is proportional to the number of alive cells, the number was estimated with optical density measurements at the 450 nm wavelength by a microplate reader. Relative viabilities were calculated according to the following formula: absorbance of experimental culture / absorbance of control culture. All data were normalized to controls with no treatment and expressed in arbitrary units.
Cell adhesion assayThe antigenicity of purified Fn-LPS was also determined by the cell adhesion to investigate the number of macrophage-like THP-1 cells differentiated from monocyte-like THP-1 cells cultured with the Fn-LPS and evaluated by the inhibitory effect to the cell adhesion by TAK-242. The THP-1 cells were cultured with LPS (100 ng/ml) or with LPS (100 ng/ml) and TAK-242 (1 µM, Sigma-Aldrich Japan) in a 6-well plate for 24 h. After the treatment the culture medium was removed and washed by new medium five times. The cells attached on the 6-well plate were cultured in the medium containing the substrate of cell counting kit-8 for 4 h and the absorbance of WST-8 metabolizing was measured at 450 nm to determine the number of macrophage-like attached cells differentiated from THP-1. All data were normalized to the control with no treatment and expressed in arbitrary units.
Cell activation assayThe activation of mouse primary proximal tubular epithelial cells by Fn-LPS, TNF-α, and J774.1 cells with Fn-LPS was investigated. The procedures and dosages were determined according to the data sheets and previous studies [15, 33, 34, 46, 47, 50, 51].The tubular cells were cultured in 24-well plates and in 6-well plates on glass cover slips with the medium containing Fn-LPS (100 ng/ml) or TNF-α (10 pg/ml, azide free, ED50: 8–50 pg/m, aa80-235; R&D Systems Inc., Minneapolis, MN), and co-cultured with J774.1 cells supplemented with Fn-LPS (100 ng/ml) in the culture insert (pore size 0.4 μm, Falcon, Thermo Fisher Scientific Inc., Chino, CA). After culturing the SGLT2 production was analyzed by RT-PCR, cell ELISA, and immunostaining as described below.
Real-time PCRThe real-time PCR was performed to quantify the mRNA expressed amounts of human IL-6 in THP-1 cells and mouse SGLT2 in the cultured mouse renal proximal tubular epithelial cells, and in the mouse kidney tissue using primer sets where the specificities had been confirmed by the manufacturer (Sigma-Aldrich Japan) described elsewhere [15, 16, 33, 34](Table 1). Immediately after excision five mm squares of tissue from mouse kidneys were ground into a paste with a scalpel on glass plates on ice and dissolved in the RLT buffer of an RNeasy kit (Qiagen, Inc., Tokyo, Japan). Also, THP-1 cell pellets collected by centrifugation at 200 x g for 10 min, and the renal proximal tubular epithelial cells attached on the 6-well plate were also dissolved in the RLT buffer of an RNeasy kit (Qiagen). The total RNA extraction from the tissue was performed with a QIAshredder column and an RNeasy kit (Qiagen). When many non-specific bands were identified at the gel electrophoresis after the PCR, a DNAfree kit (Ambion, Huntingdon, UK) was used to remove contaminating genomic DNA. The cDNA samples were analyzed by RT-PCR to quantify the mRNA amounts with 50 pM of primer sets. The cDNA (1 µl) was amplified in a 25 µl volume of PowerSYBR Green PCR Master Mix (Applied Biosystems, Foster City, CA, USA) in a Stratagene Mx3000P real-time PCR system (Agilent Technologies, Inc., Santa Clara, CA, USA) and the fluorescence was monitored at each cycle. Cycle parameters were 95˚C for 15 min to activate Taq followed by 40 cycles of 95˚C for 15s, 58˚C for 1 min, and 72˚C for 1 min. Two standard curves were created for the real-time analysis from amplicons for β-actin and target genes in three serial 4-fold dilutions of cDNA. The β-actin/SGLT2/IL-6 gene cDNA levels in each of the samples were quantified with β-actin/SGLT2/IL-6 standard curves by allowing the Mx3000P software to accurately determine each cDNA unit. Finally, the target gene cDNA amounts in each sample were normalized to β-actin cDNA. All data were normalized to controls with no treatment and expressed in arbitrary units.
Cell ELISAThe ELISA to examine the induction of SGLT2 in proximal tubular epithelial cells (C57-6015, Cell Biologics) by Fn-LPS, TNF-α, and J774.1 cells with Fn-LPS was performed according to the method described elsewhere [33]. The cells with the treatment in 24-well plates described above were fixed in 100% methanol for 5 min at -20˚C followed by treatment with 0.5 µl of PBS blocking solution containing goat serum (0.1%) for 30 min at 20˚C and then with 0.5 µl of blocking solution containing rabbit anti-mouse SGLT2 (1 µg/ml of #ab85626, Abcam plc., Cambridge, UK) for 8 h at 4˚C. After the primary antibody treatment, the sections were washed three times in PBS for 10 min, treated with 0.5 ml of blocking solution containing a peroxidase-conjugated second antibody (0.1 µg/ml, Vector Elite ABC kit; Vector Laboratories, Burlingame, CA) for 1 h at 20˚C, reacted with a TMB kit (volume 0.18 ml; Thermo Fisher Scientific, Inc., Waltham, MA) at room temperature, and then the absorbance changes at 450 nm were measured by a microplate reader. The relative production amounts of SGLT2 protein were evaluated by the absorbance of TMB metabolizing and normalization to the control, expressed in arbitrary units.
ImmunohistochemistryThe procedure was performed according to the method described elsewhere [15, 33, 34]. The frozen 10 μm mouse kidney tissue sections cut in a cryostat on slide glass were fixed in 100% methanol for 5 min at -20˚C. The sections were rinsed by 10 mM PBS and immersed in the PBS blocking solution containing goat serum (0.1%) for 30 min at 20˚C, and then double immunostained with a rabbit polyclonal anti-mouse SGLT2 (#ab85626, Abcam plc., Cambridge, UK) to discriminate proximal tubules and a hamster monoclonal anti-mouse podoplanin clone 8.8.1 (#127402, BioLegend Inc., San Diego, CA, USA) to distinguish renal glomerular podocytes and macrophages [34]. The sections were treated with blocking solution containing primary antibodies (1 µg/ml) for 8 h at 4˚C. After the treatment the sections were washed three times in PBS for 10 min and immunostained for 1 h at 20˚C with Alexa Fluor 488/568-conjugated goat anti- hamster/rabbit IgGs (0.1 µg/ml, Probes Invitrogen Com., Eugene, OR). The sections were mounted in 50% polyvinylpyrrolidone solution and examined by microscope digital camera systems with CFI Plan Apo Lambda lens series and DS-Ri2/Qi2 (Nikon Corp., Tokyo, Japan). All experiments were repeated three times with several sections.
For the cultured cells, THP-1 and tubular cells were immunostained by anti-IL-6 and by anti-SGLT2. The monocyte-like THP-1 cells floating in the medium were harvested by centrifugation. Since the macrophage-like THP-1 cells activated by Fn-LPS were attached in the 6-well plate, the cells were trypsinized and harvested by the centrifugation. The cell pellets were resuspended in PBS and the cell suspension (10 µl) was placed on slide glass and air dried. The mouse renal proximal convoluted tubular cells cultured on glass cover slips were also air dried. The cells on the glass were fixed in 100% methanol for 5 min at -20˚C, rinsed by 10 mM PBS, and then immersed in the PBS blocking solution containing goat serum (0.1%) for 30 min at 20˚C. After blocking, cells were exposed to primary antibodies (1 µg/ml) diluted in the blocking agent for 8 h at 4˚C. The THP-1 cells were treated with a rabbit polyclonal anti-human IL-6 (1 µg/ml, #ab6672; Abcam plc., Cambridge, UK) and mouse proximal tubular cells were treated with rabbit polyclonal anti-mouse SGLT2 (#ab85626, Abcam plc., Cambridge, UK). After the treatment cells were exposed to secondary antibodies (0.1 µg/ml): Alexa Fluor 488/568-conjugated goat anti-rabbit IgG (Probes Invitrogen). Cell nuclei were counterstained with 4’, 6-diamidino-2-phenylindole (DAPI). The immunostained sections were examined by microscope digital camera systems with a CFI Plan Apo Lambda lens series and DS-Ri2/Qi2 (Nikon Corp., Tokyo, Japan).
Measurements of the immunostained areas of tissue sectionsThe SGLT-positive glomeruli immunostained by anti-SGLT2 (Abcam) were counted by fluorescence microscopy (BZ-810; Keyence Corp., Osaka, Japan). The proximal convoluted tubules where the luminal side was reacted with anti-SGLT2 (Abcam) were also counted and determined as tubules in the SGLT2 overexpression. Relative numbers of the SGLT-2-positive organs were expressed as arbitrary units according to the formula of the normalization to the ICR control: the number of organs in Fn-ICR, STZ-ICR or Fn-STZ / ICR. All experiments were repeated at least five times.
StatisticsAnimal experiments were done with 36 mice of 4 groups (9 mice in each group) as described above. All experiments for immunohistochemistry, RT-PCR and ELISA were repeated five times. Data were expressed as the mean + SD and mean values were calculated with standard deviations. The statistical significance of differences (P < 0.01) was determined by one-way ANOVA and two-tailed unpaired Student’s t test with STATVIEW 4.51 software (Abacus concepts, Calabasas, CA, USA). The corresponding author is fully aware of the group allocation at the different stages of the experiments. The data analysis and assessments were performed by all co-authors.
Comments (0)