
Remember me
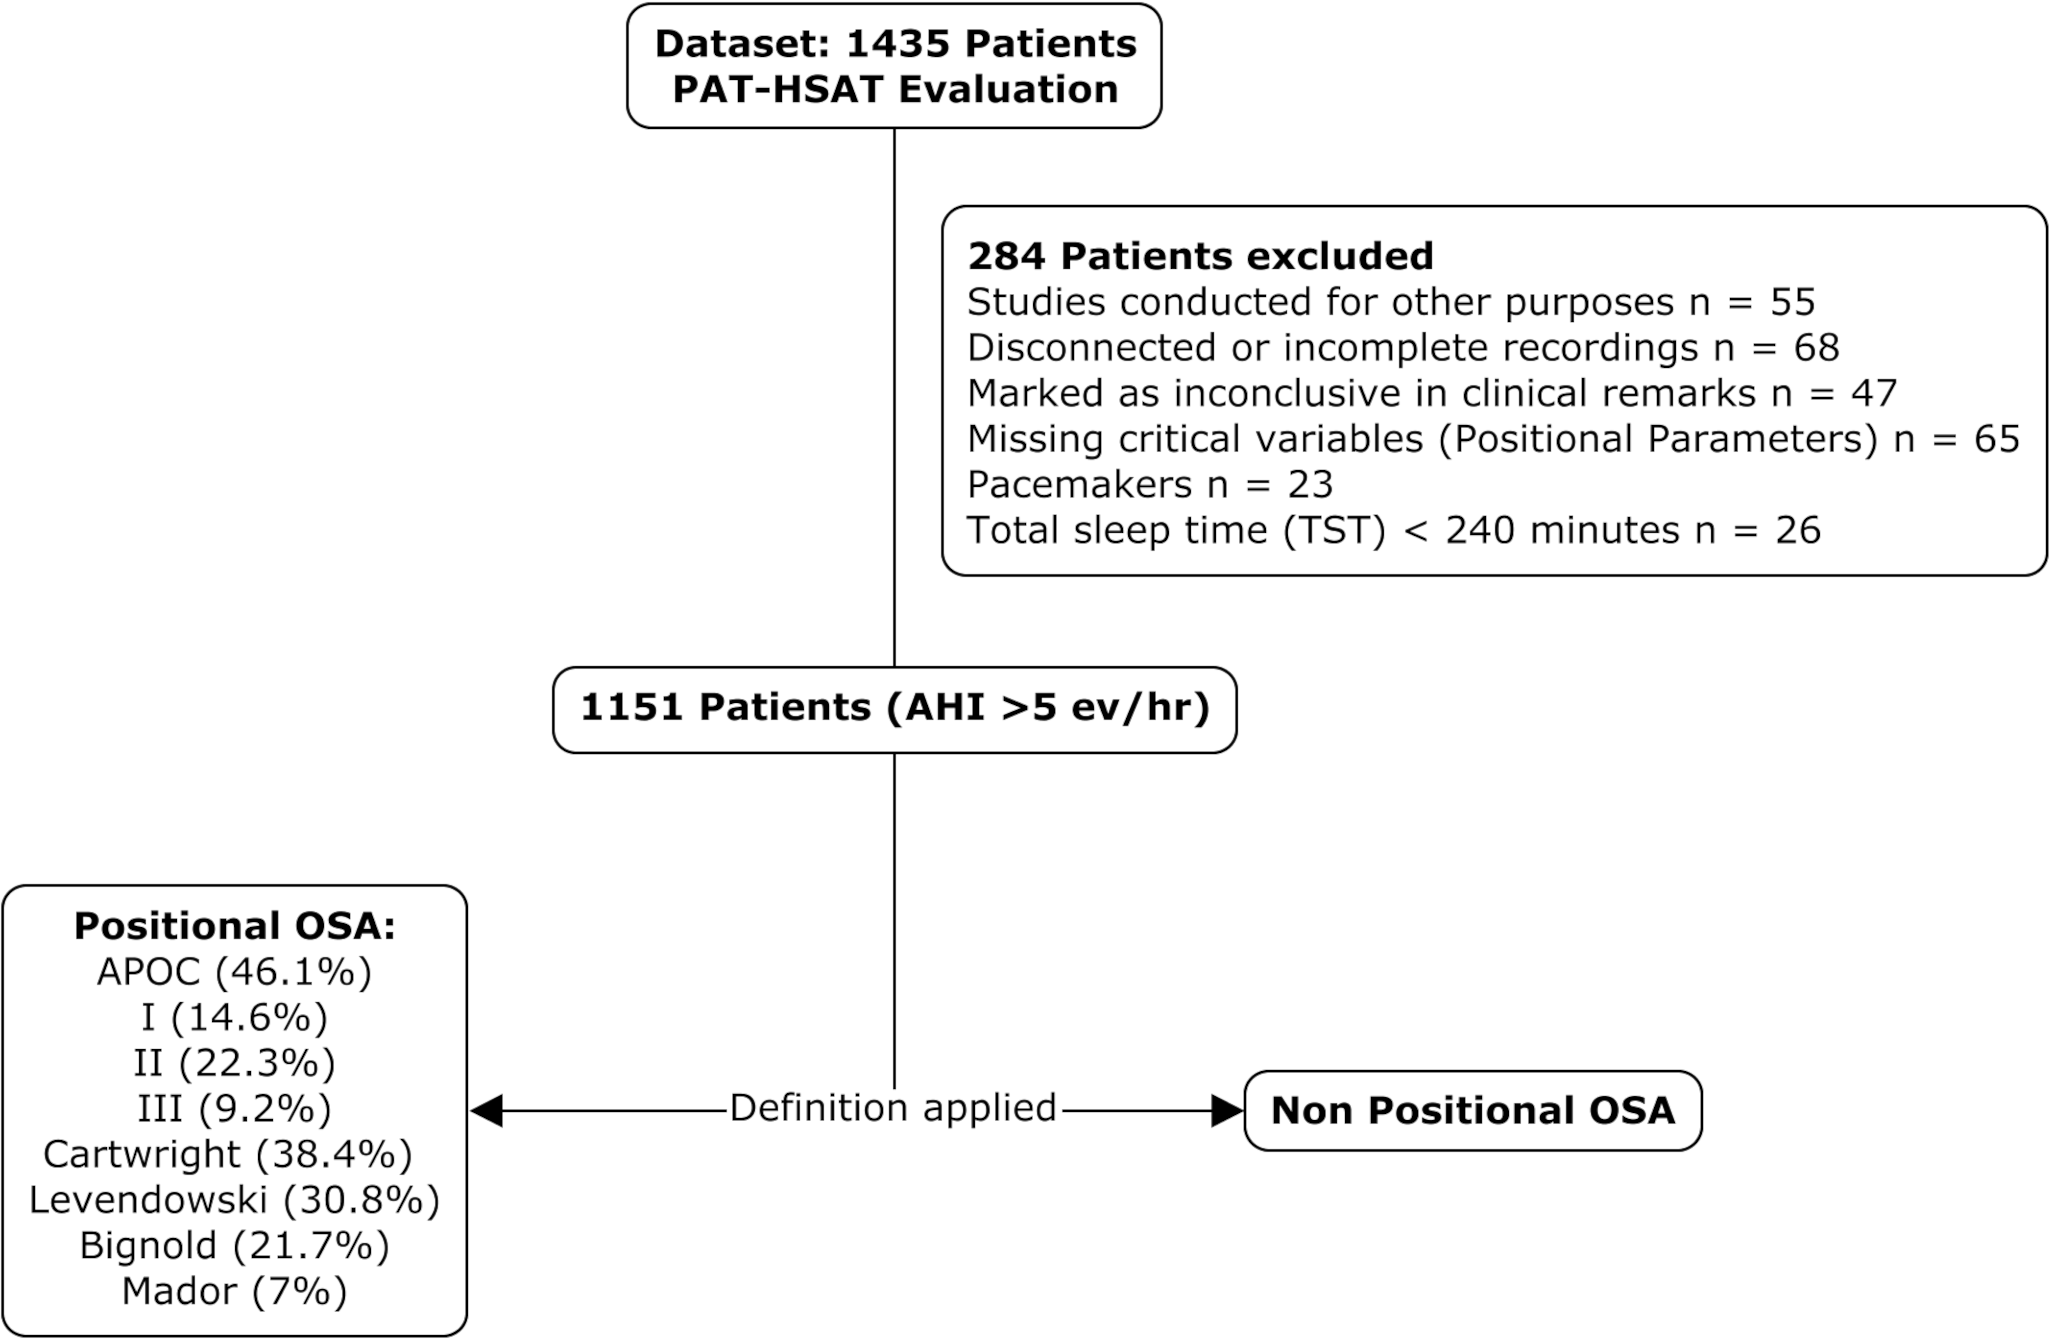
A total of 1,151 patients with a confirmed diagnosis of OSA by PAT-HSAT were included in the study. The median age was 53 years (IQR: 43–64), with a slight male predominance (56.7%). The median BMI was 26.95 kg/m² [24.26–30.08], and 68.2% of the cohort was classified as overweight or obese. According to the STOP-BANG questionnaire, 63.1% of participants were at intermediate or high risk for OSA. Subjective daytime sleepiness, assessed using the Epworth Sleepiness Scale (ESS), had a median score of 6 [IQR: 3-10], with 24.1% of patients reporting moderate to severe levels of sleepiness. Regarding OSA severity, 31.7% of patients had mild, 34.6% moderate, and 33.7% severe OSA. A full summary of the clinical and anthropometric characteristics is presented in Table 2.
Table 2 Clinical characteristics of patients included in the studyPrevalence of positional obstructive sleep apneaThe prevalence of POSA varied considerably depending on the diagnostic criterion employed (Fig. 2; Table 3). The composite APOC Global classification—which hierarchically integrates the APOC I, II, and III categories—identified 531 patients with POSA, representing the highest overall prevalence (46.1%). This was followed by the Cartwright criterion (38.4%), Levendowski (30.8%), APOC II (22.3%), Bignold (21.7%), APOC I (14.6%), APOC III (9.2%), and Mador (7.0%) (Table 3).
Fig. 2
Patients with positional obstructive sleep apnea. This figure illustrates the prevalence of POSA according to widely recognized definitions. The percentages represent the proportion of patients meeting each definition, while the number of cases is displayed above each bar. This visualization highlights two aspects: (a) the heterogeneity in POSA classification definitions and their relative frequency in the study population and, (b) how different POSA populations defined in most of the classification could potentially be contained by the APOC classification
Table 3 Distribution of positional obstructive sleep apnea (POSA) classifications according to OSA AASM classification, based on different diagnostic criteria and the APOC systemUnder the Cartwright, Levendowski, and APOC Global classifications, most patients exhibited mild or moderate OSA, with a marked decline in the proportion of POSA cases among those with severe disease (Fig. 3; Table 3). In contrast, the Mador criterion identified only patients with mild (81%) or moderate (19%) OSA, and a similar distribution was observed in the APOC I subgroup, where 97% of patients fell within the mild (74%) or moderate (22%) categories. APOC II included exclusively moderate and severe OSA cases in comparable proportions (56.5% and 43.5%, respectively), whereas all patients classified under APOC III had severe OSA. Notably, the APOC framework—composed of three hierarchically and mutually exclusive categories—successfully encompassed all patients identified through its subtypes. This reaffirms its structured and inclusive approach to POSA phenotyping and highlights its alignment with the clinical spectrum of the disease [27].
Fig. 3
Distribution of OSA severity (by AASM) across POSA criteria. Notably, APOC Global and its subcategories show a gradient in apnoea severity. APOC I was predominantly associated with mild OSA, while APOC III was exclusively observed in patients with severe disease
Global sleep and respiratory physiology from PAT-HSAT (see Online Resource 1)Sleep architecture and respiratory physiology, as assessed through PAT-HSAT recordings, revealed a TST of 422 min [377–472] and a high sleep efficiency of 89.7% [85.71–92.56]. Light sleep comprised the majority of sleep stages (61.7%), followed by REM sleep (23.2%) and deep NREM sleep (15.6%). The pAHI 3% was 21.9 events/hour [12.7–38.2], with a higher burden observed during REM sleep (29.75 events/hour) compared to deep NREM (18.55 events/hour). Similarly, pRDI showed a median of 26.3 events/hour [18.2–40.5], following the same distribution pattern.
Oxygenation profiles indicated: the ODI4% was 11.8 events/hour [6.2–23.6], with 80 desaturations [42–159] recorded per night. Minimum SatO₂ was 82% [77–85], and the mean desaturation nadir was 89% [88–91]. T < 90 was 22.2 min [2.5–132.2]. Additional physiological metrics included a stable median HR of 63 bpm [58–70], mean snoring intensity of 41 dB, and REM latency of 74 min [52–115]. WASO was 32 min [20–53], and sleep latency was 16 min [IQR:6-19].
Phenotypic comparisons across APOC classifications (see Online Resource 2 for detailed data)Significant differences were observed across APOC phenotypes in age, sex, anthropometrics, respiratory burden, and hypoxaemia metrics. APOC III patients were the oldest (58 years, IQR: 48–68), while APOC I were the youngest (47.5 years, IQR: 38–58; p < 0.001). A male predominance increased progressively from APOC I to III (p = 0.040). BMI followed a similar gradient, with lower values in APOC I (25.9 kg/m²) and higher medians in APOC II and III (27.4 and 27.8 kg/m², respectively; p = 0.008). Neck circumference was also highest in APOC III (39.5 cm; p = 0.027). TST was longest in APOC III (445.5 min) and shortest in APOC I (414 min; p = 0.002), although sleep efficiency remained uniformly high across all groups. REM and sleep latency showed no significant variation. Respiratory indices revealed a clear gradient: APOC III showed the highest burden of events (pRDI: 52.0 events/h; pAHI3%: 51.0 events/h), while APOC I displayed the lowest (15.9 and 10.6, respectively; all p < 0.001). These differences persisted across REM and NREM subcomponents.
Desaturation metrics also followed this pattern. APOC III had the highest ODI4% (34.9 events/h), total desaturations (median: 249), and lowest nadir and minimum SatO₂ (87.0% and 77.0%, respectively). In contrast, APOC I maintained a more preserved oxygenation profile (ODI4%: 5.7; desaturations: 37; nadir: 90.0%). Time spent below oxygen thresholds (T < 90, < 88, < 85, < 80) increased markedly from APOC I to III (all p < 0.001). These findings, as detailed in Online Resource 2, indicate that APOC III represents a more severe, hypoxemia-prone phenotype, while APOC I reflects a milder POSA profile with minimal desaturation burden. HR did not differ significantly across groups.
Body position statisticsPositional respiratory patterns across APOC phenotypes are summarized in Table 4 and illustrated in Fig. 4. APOC I, the mildest phenotype, exhibited significantly lower pAHI 3% values across all sleep positions. For instance, supine pAHI 3% was 17.3 (IQR: 9.6–27.3) in APOC I, compared to 33.6 in APOC II and 72.0 in APOC III (p < 0.001). This gradient was consistent in prone and lateral positions: pAHI 3% in prone was 4.0, 17.1, and 39.4; in left lateral, 5.7, 18.5, and 41.2; and in right lateral, 4.0, 14.1, and 33.5, respectively (all p < 0.001). Notably, time spent in the supine position did not significantly differ between APOC groups (p = 0.12), indicating that differences in pAHI 3% are not attributable to sleep posture duration but rather to intrinsic positional vulnerability.
Table 4 Positional sleep characteristics and AHI by body position and sleep stage across APOC subgroupsFig. 4
Variation in pAHI 3% by Body Position Across APOC Phenotypes and OSA but non-POSA Subjects. This figure highlights the distinct positional dependency of pAHI 3% across APOC phenotypes, with APOC I and II exhibiting markedly higher indices in the supine position and lower values in non-supine positions, in contrast to the non-POSA group, which shows minimal postural variation
Regarding positional distribution, the supine position was consistently identified as the WSP across all phenotypes, particularly in APOC III (82.1%). Conversely, the BSP was more variable: in APOC I, 48.2% of patients had the right lateral decubitus as BSP, while in APOC III, right and left positions remained favorable in over 80% of cases combined. Figure 4 provides a graphical representation of pAHI 3% by body position. APOC I and II displayed marked postural dependency, with notably higher indices in the supine and lower values in non-supine positions. In contrast, the non-POSA group showed minimal variation across positions. Supine pAHI 3% exhibited the narrowest confidence intervals, underscoring its predominant influence on disease expression and phenotype classification.
Comments (0)