Medicine preparation and component analysis of QZTBD
QZTBD comprises nine traditional Chinese herbs, as detailed in Table S1. The formula was procured from Zhejiang Chinese Medical University Medical Pieces, Ltd. (Hangzhou, China). The chemical composition of the QZTBD aqueous extract was analyzed using a UHPLC-MS/MS system (Thermo Fisher Scientific) via an untargeted metabolomics approach. Samples were extracted with methanol/water (4:1, v/v) containing 10 μg/mL internal standard, followed by sonication, centrifugation, and filtration. Chromatographic separation was achieved on a Waters ACQUITY UPLC BEH C18 column (1.7 μm, 2.1 × 100 mm) with a mobile phase composed of 0.1% formic acid in water and 0.1% formic acid in acetonitrile. MS data were acquired in both positive and negative ionization modes and processed using the XCMS software. Detailed parameters and data analysis workflows are provided in Supplementary Methods.
Animals and treatment
Male Uox-KO mice (3–5 weeks old), characterized by stably elevated serum uric acid levels [15, 19], were used in this study. Mice were housed in a specific pathogen-free barrier facility at the Laboratory Animal Center of Zhejiang Chinese Medical University (12 h light/dark cycle, 20 ± 2 °C, 60 ± 5% humidity). All experimental protocols were approved by the Institutional Animal Care and Use Committee (IACUC) of Zhejiang Chinese Medical University (Approval No. IACUC-20210621-17; June 2021).
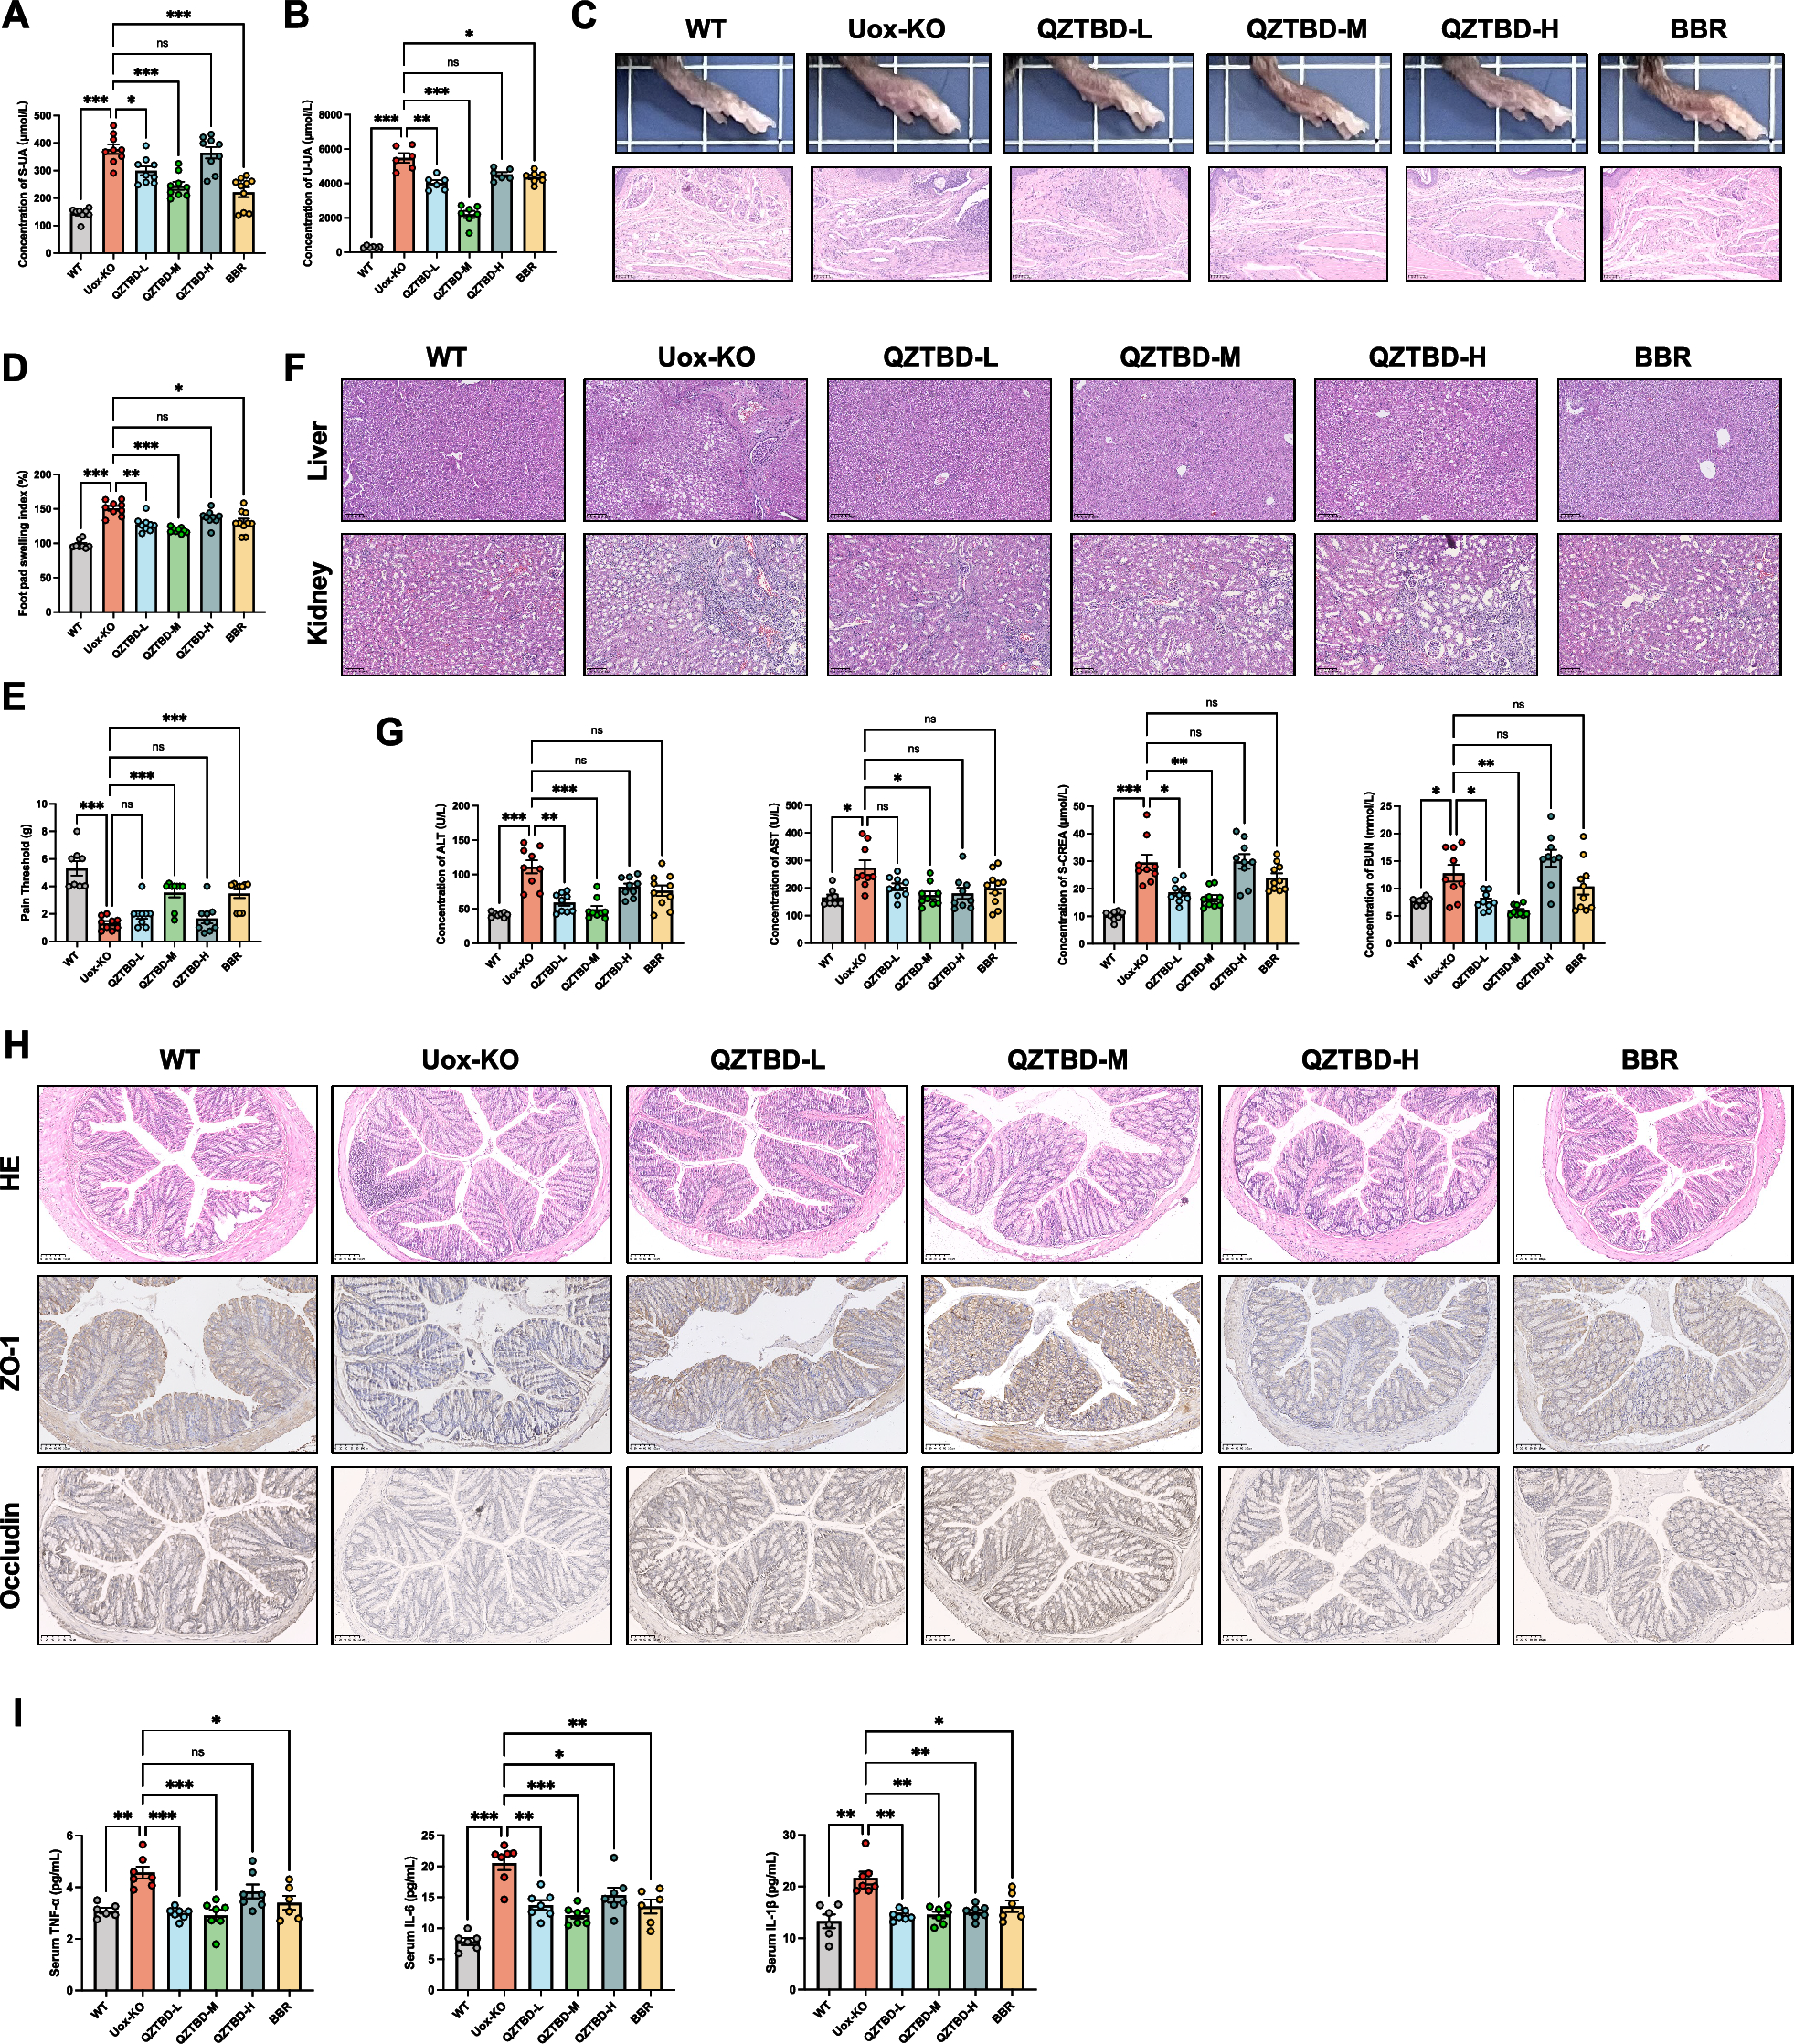
Uox-KO mice were randomly assigned into experimental groups, with wild-type (WT) mice as controls. The QZTBD group received QZTBD via oral gavage once per day for six weeks at low (QZTBD-L, 9.0 g/kg/d), medium (QZTBD-M, 18.0 g/kg/d), and high (QZTBD-H, 36.0 g/kg/d) doses. The benzbromarone (BBR) group was administered 6.5 mg/kg/d benzbromarone (50 mg/tablet, Batch: J20180056; Kunshan Longdeng Ruidi Pharmaceutical Co., Ltd.) for six weeks as a positive control. The butyric acid-producing bacteria (BPB) group was administered 109 CFU/mL butyric acid-producing bacteria suspension daily, and the butyrate group was given 500 mg/kg sodium butyrate (Sigma-Aldrich, USA) for six weeks. For glycolysis inhibition, 2-Deoxy-D-glucose (2-DG) dissolved in sterile phosphate-buffered saline (PBS) (pH 7.4) was intraperitoneally injected at a dose of 250 mg/kg every other day for 6 weeks. Vehicle control groups received equivalent volumes of sterile water through corresponding routes. Twenty-four hours before euthanasia, Uox-KO mice received intraplanar injection of 1 mg MSU crystals in 40 μL of PBS, while WT mice received PBS alone. The levels of uric acid (UA), alanine aminotransferase (ALT), aspartate aminotransferase (AST), blood urea nitrogen (BUN), creatinine (CREA) were determined using a Hitachi 3100 analyzer (Tokyo, Japan). Paw swelling index and mechanical pain threshold were evaluated as previously described [17, 18].
Cell culture and treatment
Primary bone marrow-derived macrophages (BMDMs) were isolated from the femurs and tibias of C57BL/6 J mice and cultured in RPMI-1640 medium (Thermo Fisher Scientific, USA) supplemented with 10% fetal bovine serum (FBS), 1% penicillin–streptomycin, and 25 ng/mL macrophage colony-stimulating factor (M-CSF). Cells were maintained for 7 days in a humidified 5% CO2 incubator at 37 °C and adherent cells were collected as BMDMs. For M1 polarization, M0 macrophages were treated with pharmacological interventions, including QZTBD-containing serum, butyrate (0.5 mM, 1.0 mM, or 1.5 mM) [20, 21], or 2-DG (1.5 mM), 24 h prior to harvest. 100 ng/mL lipopolysaccharide (LPS) and 50 ng/mL interferon-γ (IFN-γ) were added 6 h before harvest to induce polarization.
Fecal microbiota transplantation
Fecal microbiota transplantation (FMT) was carried out following the methodology described in the previous study [18]. Briefly, fresh fecal pellets from QZTBD-treated donor mice were promptly collected each morning post defecation. 200 mg fecal pellets were suspended in 1 mL sterile PBS and centrifuged at 800 rpm for 5 min to remove debris. The collected supernatant was centrifuged at 12,000 rpm for 5 min to pellet microbial biomass. The resulting microbial pellet was then resuspended in PBS and administered via oral gavage to recipient Uox-KO mice (200 µL/mouse) within 10 min of preparation. This procedure was repeated daily for six weeks, with recipients designated as the QZ-FMT group.
Analysis of QZTBD on gut microbiota activity
Fresh fecal microbiota samples from mice were collected and anaerobically cultured in MRS broth using an anaerobic chamber (80% N2, 10% H2, and 10% CO2) at 37 °C with 60% relative humidity. The microbiota was treated with different doses of QZTBD (0, 2.5, 5, and 10%) for 24 h. Microbial biomass was quantified spectrophotometrically at OD600, while butyrate kinase (Buk) and butyryl-CoA: acetyl-CoA transferase (But) gene expression levels were examined by RT-qPCR.
Histopathology and immunofluorescence
Paraffin-embedded samples were prepared as previously described [17] and sectioned into 5-µm-thick sections. Tissue sections were deparaffinized in xylene, rehydrated through a graded ethanol series, stained with H&E, and imaged using bright-field microscope. For macrophage phenotyping, immunofluorescence (IF) staining was performed on claw tissue sections. Antibodies directed against F4/80, iNOS, and CD206 were utilized, and an anti-fluorescence quenching sealer containing DAPI was employed (Table S2). Fluorescence images were acquired using a confocal scanning microscope and fluorescence intensity quantification was analyzed using the ImageJ software.
Pathway enrichment analysis of QZTBD
To ascertain the key signaling pathways associated with the active components of QZTBD, KEGG pathway enrichment analysis was carried out using the Metascape platform (http://metascape.org/). The results were subsequently subjected to a visual analysis using R 4.0.0. A significance level of P < 0.05 was established for the screening.
16S rRNA amplicon sequencing
Microbial genomic DNA was extracted from fecal samples utilizing the QIAamp DNA Microbiome Kit (Qiagen, Germany). The V3–V4 region of bacterial 16S rRNA was amplified and sequenced using the 2 × 250 bp paired-end reading on the Illumina NovaSeq PE250 platform. Raw sequencing data were demultiplexed, quality-filtered, and assembled. High-quality sequences were clustered into operational taxonomic units (OTUs) at a similarity threshold of 97% using UPARSE. All raw sequences were deposited in the Sequence Read Archive with individual sample accessions ranging from SAMN43357155 to SAMN43357181 and from SAMN31530587 to SAMN31530614.
Untargeted serum metabolomics analysis
Serum samples (50 µL) were extracted with methanol/acetonitrile (1:1, v/v) containing internal standards, vortexed, and filtered. Quality control (QC) samples were prepared by pooling equal aliquots of all filtrates. Metabolomic profiling was performed using UHPLC (Vanquish, Thermo) coupled to an Orbitrap Exploris 120 MS. Chromatographic separation was conducted with two complementary columns. The first was a BEH Amide column (2.1 × 50 mm, 1.7 µm), utilizing a mobile phase composed of ammonium acetate/ammonium hydroxide (pH 9.75) and acetonitrile. The second was a Phenomenex Kinetex C18 column (2.1 × 100 mm, 2.6 µm), with a mobile phase consisting of 0.01% acetic acid aqueous solution and a mixture of isopropanol and acetonitrile (1:1, v/v). MS data were acquired in IDA mode (ESI: ± 3.8/3.4 kV, 60,000 resolution). Data were processed via XCMS (R-based), and metabolites were identified using BiotreeDB (V3.0).
RT-qPCR
Total RNA was isolated from murine colon tissues and BMDMs using TRIzol reagent (Invitrogen, USA). cDNA was synthesized using the HiFiScript® cDNA Synthesis Kit (Cwbio, China). Fecal microbial RNA was extracted from the mouse fecal pellets and then converted to cDNA with the use of SuperScript™ IV VILO™ Master Mix (Thermo Fisher Scientific, USA). In addition, genus-specific qPCR primers were used to quantify the relative abundance of the representative butyrate-producing genera in QZ-FMT recipient mice. The results were normalized to 16S rRNA gene levels and calculated using 2−ΔΔCt method. Primer sequences are listed in Table S3.
Western blot analysis
Total protein was extracted from murine colon tissues and BMDMs using RIPA lysis buffer (Cat# R0020, Solarbio). Protein was quantified by BCA assay (Beyotime, # p0012). The extract was subjected to SDS-PAGE and subsequently electroblotted onto PVDF membranes. The proteins were probed with the specific primary antibodies (Table S4) and HRP-conjugated secondary antibody (Abcam, # ab205718, 1:5000). Protein signals were visualized with ECL system, and the gray value was quantified as a ratio to β-actin using ImageJ software.
Meta-analysis of GEO dataset
The GSE160170 microarray datasets of human gouty arthritis was retrieved from the public GEO database (http://www.ncbi.nlm.nih.gov/geo/) at the National Center for Biotechnology Information (NCBI). Differentially expressed genes between healthy controls and gouty arthritis patients were identified using GEO2R online tools. Absolute log2-fold change > 1 and adjusted P-value < 0.05 were set as the cutoff criteria.
Seahorse XF glycolysis stress assay
To evaluate the glycolytic capacity of BMDMs, the glycolysis stress test assay was performed using the Seahorse XF Glycolytic Rate Assay Kit (Agilent). Prior to the assay, BMDMs were seeded in XFp microplates at 20,000 cells/well and pre-treated with QZTBD-containing serum for 24 h under standard culture conditions. Extracellular acidification rate (ECAR) and oxygen consumption rate (OCR) were quantified using the Seahorse XFp Analyzer. A detailed and comprehensive account of the ECAR and OCR process can be found in the supplementary materials.
Flow cytometry
Single-cell suspensions from BMDMs, spleens, and intestines were prepared as previously described [15, 18]. Cells were incubated with Fc block (anti-mouse CD16/32) to reduce nonspecific binding, followed by staining with fluorochrome-conjugated antibodies against CD45, F4/80, CD86, and CD163 (Table S5). Stained cells were washed with PBS and analyzed on a CytoFLEX S flow cytometer (Beckman Coulter, USA). Data were analyzed with FlowJo software (10.4.0). M1 macrophages were gated as CD45+ F4/80+ CD86+ cells, while M2 macrophages were gated as CD45+ F4/80+ CD163+ cells.
Butyrate detection
Gas chromatography-mass spectrometry (GC-MS) was used for butyrate detection, and GPC-GC/MS-2010 (Shimadzu, Japan) with a Rtx-Wax capillary column (Restek, USA) was employed for analysis. Detailed protocols are provided in the Supplementary Materials.
Enzyme-linked immunosorbent assay
The levels of cytokines IL-1β, IL-6, IL-18, TNF-α, and IL-10 in serum, colon tissue homogenates, and the culture supernatant of BMDMs were quantified by ELISA kits (Lianke, China) in accordance with the manufacturer's instructions.
Preparation of butyric acid-producing bacteria
Butyric acid-producing bacterium (BPB, Clostridium butyricum) was incubated in MRS broth at 37 °C under 60% relative humidity for 24 h using a GeneScience E500 anaerobic chamber. Bacterial pellets were harvested by centrifugation and subjected to 3 washes with sterile PBS. The final biomass was resuspended in PBS to achieve a concentration of 109 CFU/mL.
Preparation of the QZTBD-containing serum
SD rats were used for the preparation QZTBD-containing serum (Approval No.: IACUC-20240219-15). A concentrated QZTBD solution (18.9 g/kg/d) was administered orally at a dose of 10.0 mL/kg for seven consecutive days. The control group was treated with 10.0 mL/kg saline to prepare blank serum. Blood samples were collected from the abdominal aorta and incubated at 37 °C for 30 min. Serum was separated by centrifugation at 3000 rpm and 4 °C for 15 min, heat-inactivated at 56 °C for 30 min, then filtered and sterilized through 0.22 μm microporous membranes.
Molecular docking analysis
For molecular docking analysis, the 2D structures of the components were retrieved from the PubChem database (https://pubchem.ncbi.nlm.nih.gov/). The 3D crystal structures of Buk (PDB code: AF-Q05619-F1) and But (PDB code: AF-A0A073KPY3-F1) were obtained from the Protein Data Bank. PyMOL 2.1 software was employed to remove ligands, perform dehydration, and add hydrogens to the target protein. The target protein and main components were converted to PDBQT format using AutoDock Tools 4.2.6. The center coordinates and dimensions of the docking box were defined based on the protein active site and the ligand binding region. Molecular docking was conducted utilizing AutoDock Vina 1.1.2 software, and the results were expressed as docking scores.
Statistical analysis
The data analysis was conducted using GraphPad Prism 9.0.2 software (GraphPad Software, USA), with data expressed as mean ± standard error of the mean (SEM). For comparisons involving multiple groups, one-way ANOVA followed by Tukey test was used to determine statistical significance. Spearman's correlation analysis was employed to investigate potential relationships between parameters. Each experiment was conducted with at least three replicates. No data points were excluded except in cases of technical failure. Statistical significance was defined as P < 0.05, with the following notation: *P < 0.05, **P < 0.01, ***P < 0.001, and ns (not significant).

Comments (0)