
Remember me
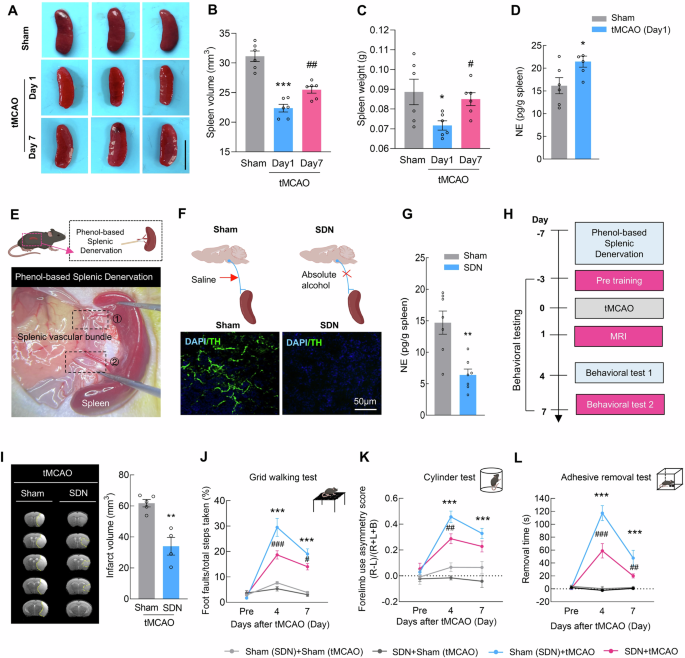
Splenic atrophy is an important feature of the stroke-induced systemic inflammatory response and immunomodulatory disorders and is characterized by a reduced organ size that occurs within the first few days after stroke [23]. Compared with those of the sham controls, the spleen volume and weight were significantly lower on day 1 after transient middle cerebral artery occlusion (tMCAO) and recovered on day 7 (Fig. 1A–C). Quantitative analysis revealed that the levels of NE in the spleen were significantly increased at 1 day post-stroke (Fig. 1D). Considering that the dominant nerves innervating the spleen are postganglionic fibers of the abdominal sympathetic nervous system, we employed a surgical denervation protocol to perform SDN in the spleen (Fig. 1E). Analysis of the tyrosine hydroxylase (TH) and NE levels in the spleen confirmed successful sympathetic nerve denervation (Fig. 1F, G).
Fig. 1
Sympathetic denervation of the spleen reduces brain injury after ischemia‒reperfusion. A Spleen images of the sham and tMCAO models during the early (day 1) and late (day 7) stages. The scale bar represents 1 cm. B Spleen volume in the sham and tMCAO models during the early (day 1) and late (day 7) stages. n = 6/group. C Spleen weight in the sham and tMCAO models during the early (day 1) and late (day 7) stages. n = 6/group. D ELISA-based measurement of splenic norepinephrine (NE) levels at 24 h post tMCAO. n = 6/group. E Schematic illustration of the splenic sympathetic denervation (SDN) experiment. F Representative images of spleen sections from sham-operated or denervated mice 1 week after surgery. Green, tyrosine hydroxylase (TH) staining; blue, DAPI. Scale bar = 50 μm. G. NE concentrations in splenic tissue from sham-operated and denervated mice. n = 7/group. H Schematic of tMCAO, infarction examination, and behavioral tests in SDN mice. I Representative T2-weighted MR images of the tMCAO (sham) and tMCAO (SDN) groups 1 day after tMCAO, followed by analysis of the infarct volume. The dashed line denotes the infarct area. n = 5 in the tMCAO (Sham) group, n = 4 in the tMCAO (SDN) group. Functional recovery in SDN mice was assessed by the grid walking test (J), cylinder test (K), and adhesive removal test (L) at baseline and on days 4 and 7 after tMCAO. n = 6/group. The data are presented as the means ± SEMs. *P < 0.05; **P < 0.01; ***P < 0.001; #P < 0.05; ##P < 0.01; ###P < 0.001
Next, we examined the effect of SDN on brain damage after stroke (Figs. 1H and S1A, B). Cerebral blood flow analysis indicated that SDN did not affect brain blood flow during tMCAO modeling (Fig. S1C, D). MRI analysis revealed that the infarct volume was significantly reduced in tMCAO mice that received SDN surgery (Fig. 1I). For the grid-walking task, SDN significantly decreased the rate of foot faults in comparison with that in mice that did not undergo SDN surgery on day 4 and 7 after tMCAO model induction (Fig. 1J). Mice that were subjected to SDN surgery showed significantly reduced bias in the cylinder test on day 4 and 7 after tMCAO model induction (Fig. 1K). A significant recovery effect was also observed in the adhesive removal test, reflected by the decreased removal time after SDN surgery compared with that in the sham (SDN) group on day 4 and 7 after tMCAO model induction (Fig. 1L). These results suggest that SDN may effectively reduce brain injury caused by tMCAO, highlighting its potential as a therapeutic intervention after stroke.
Cell subset-specific analysis identifies homeostatic and stroke-associated CD8+GZMK+ T cellsThe postganglionic fibers of the abdominal sympathetic nervous system that innervate the spleen primarily run along the splenic artery, with the surrounding area consisting mainly of lymphoid sheaths (T-cell zones) [24]. Thus, we assessed the effects of SDN on T cells and found that SDN surgery reversed the decrease in T-cell frequency in tMCAO mice (Fig. 2A). These results indicate that SDN can alter the immune status of T cells after stroke. To validate these findings in clinical patients, we established a cohort comprising 60 AIS patients who underwent recanalization therapy and 60 non-stroke controls. Flow cytometric analysis of PBMCs revealed that in AIS patients, the proportion of T cells among PBMCs was significantly lower than that in non-stroke controls (Fig. 2B and Table S1).
Fig. 2
Cell subset-specific analysis identifies homeostatic and stroke-associated GZMK+ CD8+ T cells. A Proportions of T cells in peripheral PBMCs after SDN in sham and tMCAO mice. B Proportions of T cells in non-stroke controls and AIS patients. n = 60/group. C UMAP visualization showing 7 transcriptionally distinct T-cell subsets. D Proportions of GZMK+ T cells in non-stroke controls and AIS patients. n = 60/group. E Proportions of GZMK+ T cells in AIS patients before treatment, on day 1, and on day 7 after treatment. n = 60/group. F Spearman correlation between GZMK+ T-cell proportions and National Institutes of Health Stroke Scale (NIHSS) scores (pre-treatment). G Spearman correlation between GZMK+ T-cell proportions and NIHSS scores (day 7 post-treatment). H Proportions of GZMK+ T cells in patients with good outcomes (mRS 0–2) versus poor outcomes (mRS 3–6) post-treatment; n = 30 in the good outcome group and n = 30 in the poor outcome group. I Representative images showing immunostaining for CD3 (green) and GZMK (red) in the brains of AIS patients. J Gating strategy for determining the abundance of CD4+ GZMK+ T cells and CD8+ GZMK+ T cells via flow cytometry. K Proportions of CD8+ GZMK+ T cells in non-stroke controls and AIS patients. n = 60/group. L Proportions of CD8+ GZMK+ T cells in AIS patients before treatment, on day 1, and on day 7 after treatment. n = 60/group. M Spearman correlation between CD8+ GZMK+ T-cell proportions and National Institutes of Health Stroke Scale (NIHSS) scores (pre-treatment). N Spearman correlation between CD8+ GZMK+ T-cell proportions and NIHSS scores (day 7 post-treatment). O Proportions of CD8+ GZMK+ T cells in patients with good outcomes (mRS 0–2) versus poor outcomes (mRS 3–6) post-treatment; n = 30 in the good outcome group and n = 30 in the poor outcome group. The data are presented as the means ± SEMs. *P < 0.05; ***P < 0.001
To further clarify the relationship between T-cell immunity after stroke and clinical characteristics, we generated a scRNA-seq library from 3 AIS patients before and after stroke (day 1 and day 7) who received mechanical thrombectomy combined with IV recombinant tissue plasminogen activator (rt-PA) thrombolysis treatment in PBMCs, along with 3 controls matched for sex and age (Figs. S2, 3, S4A, and Table S2). Unbiased, graph-based clustering identified four major cell populations: T cells, B cells, myeloid cells, and NK cells (Fig. S4B–D). We captured T cells and subclustered them into seven subsets according to previously defined marker genes, encompassing well-defined subsets—CD4+ naive T cells (CD4, SELL, TCF7, and LEF1) [25], CD8+ naive T cells (CD8, SELL, TCF7, and LEF1) [25], proliferating T cells (MKI67, TYMS, and PCLAF) [26, 27], GZMK+ T cells (GZMK, CCR5, and CXCR6) [26, 28], central memory T (TCM) cells (AQP3, CPR183, and IL7R) [29,30,31], Treg cells (FOXP3, IKZF2, and IL2RA) [32], and cytotoxic T cells (CTLs) (GZMB, GNLY, and FGFBP2) [26, 33]—each characterized by unique signature genes and expression profiles (Figs. 2C, S5A, B and S6A–C). Flow cytometry analysis revealed increased counts of GZMK+ T cells and CTLs and downstream CD4+ naive T cells, TCM cells, and Tregs in the PBMCs of AIS patients (Figs. 2D, S7, and S8A). The frequencies of naive CD4+ T cells, TCM cells, Treg cells, GZMK+ T cells, and CTLs were changed on day 1 and 7 after reperfusion therapy (Figs. 2E and S8B). However, only the GZMK+ T-cell frequency was positively correlated with the National Institutes of Health Stroke Scale (NIHSS) score (r = 0.331, P = 0.010) in AIS patients before reperfusion therapy (Figs. 2F and S8C) and negatively correlated with the Barthel Index (BI) score (pre-treatment) (r = -0.304, P = 0.018) (Fig. S9A), suggesting that the GZMK+ T-cell frequency is associated with patient clinical severity.
Moreover, on day 7 post-treatment, although the frequency of GZMK+ T cells in AIS patients significantly recovered along with their symptoms, GZMK+ T cells remained positively correlated with the NIHSS score (r = 0.280, P = 0.030) and negatively correlated with the BI score (r = −0.468, P < 0.001) (Figs. 2G and S9B). We further verified whether the proportions of GZMK+ T cells were associated with stroke outcome. A Mann‒Whitney U test revealed a significant difference in GZMK+ T-cell frequencies on day 7 post-treatment between patients who eventually achieved good outcomes (mRS 0–2) and those with poor outcomes (mRS 3–6) (Fig. 2H). Importantly, immunofluorescence staining revealed infiltration of GZMK+ T cells into the peri-infarct area of the brain of AIS patients (Fig. 2I), suggesting that these cells may directly regulate CNS pathology by infiltrating the brain parenchyma.
GZMK+ T cells can be subdivided into CD4+ and CD8+ subsets. Flow cytometry analysis revealed that before treatment, the proportions of both CD4+ GZMK+ and CD8+ GZMK+ T cells were greater in the PBMCs of AIS patients than in those of non-stroke controls (Figs. 2J, K and S10A). After reperfusion, the proportions of CD8+ GZMK+ T cells, but not those of CD4+ GZMK+ T cells, were significantly lower on days 1 and 7 than they were before reperfusion (Figs. 2L and S10B). CD8+ GZMK+ T cells were positively correlated with the NIHSS score and negatively correlated with the BI before and after reperfusion therapy on day 7 (Figs. 2M, N and S10C, D), whereas CD4+ GZMK+ T cells were not correlated with the severity of AIS (Fig. S10E–H). To further compare the value of these two types of cells for prognostic assessment in AIS patients, we compared their proportions in AIS patients with good outcomes (mRS 0–2) to those with poor outcomes (mRS 3–6). A greater proportion of CD8+ GZMK+ T cells, but not CD4+ GZMK+ T cells, was observed in AIS patients with poor outcomes on day 7 post-treatment (Figs. 2O and S10I). These analyses underscore the distinctive characteristics of different GZMK+ T-cell subsets, emphasizing that CD8+ GZMK+ T cells, rather than CD4+ GZMK+ T cells, are associated with ischemic stroke and reperfusion.
CCR7-specific CD8+ GZMK+ T cells are associated with clinical symptoms in AIS patientsWe next focused on CD8+ GZMK+ T cells to understand the specific T-cell response to ischemic injury and reperfusion treatment. Upon unsupervised reclustering, CD8+ GZMK+ T cells were divided into four distinct subsets: CD8+GZMK+CX3CR1+ T cells (C01), CD8+GZMK+CX3CR1−CD27− T cells (C02), CD8+GZMK+CX3CR1−CD27+CCR7− T cells (C03), and CD8+GZMK+CX3CR1−CD27+CCR7+ T cells (C04) (Fig. 3A–C). Flow cytometry analysis revealed increased counts of C02, C03, and C04 CD8+ GZMK+ T cells and unchanged C01 CD8+ GZMK+ T cells in the PBMCs of AIS patients (Figs. 3D, E and S11A–C). However, on day 1 and 7 after AIS patients received reperfusion therapy, there were no significant changes in the frequencies of the C01 and C02 subsets, whereas the frequencies of the C03 and C04 subsets significantly decreased (Figs. 3F and S11D–F). On the basis of the analysis of the four CD8+ GZMK+ T subsets as well as the NIHSS and BI scores before and after treatment, we identified significant positive correlations between C04 subset frequencies and NIHSS scores in AIS patients both before (r = 0.523, P < 0.001) and after treatment (r = 0.402, P = 0.001) (Fig. 3G, H). Conversely, negative correlations were observed between the frequencies of the C04 subset and BI scores both pre- (r = −0.439, P < 0.001) and post-treatment (r = −0.476, P < 0.001) (Fig. 3I, J). The C01, C02, and C03 subsets did not correlate with either the NIHSS score or BI score in AIS patients before or after treatment (Fig. S12A–D). Additionally, on day 7 post-treatment, the proportions of CD8+ GZMK+ C04 T cells among total T cells were significantly different between AIS patients who eventually achieved good outcomes (mRS 0–2) and those with poor outcomes (Fig. 3K), revealing that CD8+ GZMK+ C04 T cells were associated with stroke outcome. Interestingly, the levels of proinflammatory cytokines (TNF and IFN-γ) in CD8+ GZMK+ C04 T cells were significantly greater in AIS patients than in controls (Fig. 3L‒M). Therefore, CD8+ GZMK+ C04 T cells, which we named Tsa cells, attracted our attention in our subsequent studies.
Fig. 3
CCR7-specific CD8+ GZMK+ T cells are associated with clinical symptoms in AIS patients. A UMAP visualization showing four transcriptionally distinct CD8+ GZMK+ T-cell subsets. B Dot plot showing the expression of the five selected genes in each subtype. C Feature plots showing the gene expression of representative markers across four subsets. D Gating strategy for determining the abundance of four CD8+ GZMK+ T-cell sub-populations via flow cytometry. E Proportions of CD8+ GZMK+ C04 T cells in non-stroke controls and AIS patients. n = 60/group. F Proportions of CD8+ GZMK+ C04 T cells in AIS patients before treatment, on day 1, and on day 7 after treatment. n = 60/group. G Spearman correlation between CD8+ GZMK+ C04 T-cell proportions and National Institutes of Health Stroke Scale (NIHSS) scores (pre-treatment). H Spearman correlation between CD8+ GZMK+ C04 T-cell proportions and NIHSS scores (day 7 post-treatment). I Spearman correlation between CD8+ GZMK+ C04 T-cell proportions and BI scores (pre-treatment). J Spearman correlation between CD8+ GZMK+ C04 T-cell proportions and BI scores (day 7 post-treatment). K Proportions of CD8+ GZMK+ C04 T cells in patients with good outcomes (mRS 0–2) versus poor outcomes (mRS 3–6) before treatment; n = 30 in the good outcome group and n = 30 in the poor outcome group. L Quantification of TNF in non-stroke controls and AIS patients. n = 60/group. M Quantification of IFN-γ in non-stroke controls and AIS patients. n = 60/group. The data are presented as the means ± SEMs. **P < 0.01; ***P < 0.001
Adrenergic innervation promotes splenic generation of Tsa cells after reperfusion in stroke model miceThe spleen actively participates in cellular immunity and regulates the frequency of T-cell subsets in the peripheral blood [34]. In response to external or internal stimuli, immune cells become activated and differentiate into populations of effector cells with multiple functions. To track the source of Tsa cells, we performed differentiation tracing of CD8+ naive T cells, CD8+ TCM cells, and CD8+ TEM cells in the spleen, blood, and brain in tMCAO stroke model mice via flow cytometry. As crucial secondary lymphoid organs, the spleen functions in the recirculation and residency of T cells. In the spleen, CD8+ naive T cells and CD8+ TCM cells were significantly decreased, whereas CD8+ TEM cells and Tsa cells were increased after reperfusion in tMCAO mice (Fig. S13A). In peripheral PBMCs, CD8+ TCM, total CD8+ TEM, and Tsa cells were significantly increased after reperfusion, but the frequency of CD8+ naive T cells was decreased (Fig. S13B). We next examined the infiltration of these cells in the stroke brain. As shown in Fig. S13C, the majority of infiltrating CD8+ T cells consisted of total TEM and Tsa cells, both of which were significantly increased in the peri-infarct region of tMCAO mice. During this process, Tsa cells undergo a marked proliferative phase, rapidly migrating toward the peri-infarct area of the brain. Taken together, our findings revealed that the trend of changes in Tsa cells remained consistent, peaking at 24 h and subsequently plateauing from 24–72 h.
The major neurogenic signal influencing T-cell differentiation is catecholamine via adrenergic innervation. The dominant nerves innervating the spleen are postganglionic fibers of the abdominal sympathetic nervous system. Thus, we conducted SDN in the spleen. On day 7 after SDN, the mice were subjected to sham or tMCAO surgery. We found that SDN markedly suppressed the reperfusion-induced increase in Tsa cells in the spleen, peripheral PBMCs, and brain (Fig. 4A), indicating that the expansion of Tsa cells was driven by the splenic sympathetic nervous system. Additionally, we analyzed the profiles of different receptors via scRNA-seq and revealed the predominant expression of ADRB2 (β2-adrenergic receptor) (Fig. S14A). ADRB2 was highly expressed in these cells, as validated by sorting Tsa cells via qPCR (Fig. S14B). Importantly, pharmacological blockade with propranolol significantly attenuated Tsa cell generation (Fig. 4B). These findings collectively demonstrate that stroke triggers sympathetic neurons to release NE in the spleen, which preferentially signals through ADRB2 on Tsa cells to drive their mobilization.
Fig. 4
Adrenergic innervation promotes splenic generation of Tsa cells after reperfusion in stroke mice. A Proportions of Tsa cells in the spleen, blood, and brain after SDN in sham and tMCAO mice. The proportions of Tsa cells were determined by flow cytometry 24 h after reperfusion. n = 6/group. B Proportions of Tsa cells in the spleen, blood, and brain 24 h after tMCAO in the vehicle and propranolol groups. C Isolation and adoptive transfer strategy for Tsa cells from WT and Gzmk Cas9-KO mice. D Modified neurological severity score of Rag1em1Cd/Gpt mice that received Tsa cells isolated from WT mice and those that received Tsa cells isolated from Gzmk Cas9-KO mice at 24 h after stroke. n = 11/group. E Infarct volume of Rag1 em1Cd/Gpt mice that received Tsa cells isolated from WT mice and those that received Tsa cells isolated from Gzmk Cas9-KO mice at 24 h after stroke. n = 5/group. F, G The levels of the inflammatory factors TNF-α and IFN-γ in the peri-infarct area of Rag1 em1Cd/Gpt mice that received Tsa cells isolated from WT mice and the group that received Tsa cells isolated from Gzmk Cas9-KO mice at 24 h after stroke. n = 6/group. H, I In vitro endothelial barrier permeability assay using Tsa cells from WT and Gzmk-KO mice. n = 3/group. The data are presented as the means ± SEMs. *P < 0.05; **P < 0.01; ***P < 0.001; ###P < 0.001
To characterize Tsa cells further, we performed weighted gene coexpression network analysis (WGCNA) combined with GO enrichment and KEGG analyses to conduct an in-depth exploration of Tsa cell characteristics (Fig. S15). GO analysis revealed that Tsa cells exhibit functional modules associated with T-cell activation and differentiation, including “T-cell activation”, “T-cell differentiation”, and “Regulation of immune system process” (Fig. S16A). Additionally, through KEGG analysis of each module, we determined that the M3 module, which is highly associated with Tsa cells, is linked to the activation of the NF-κB signaling pathway, a central mediator of inflammatory responses (Fig. S16B).
Tsa cells are a subset of CD8+ T cells characterized by GZMK expression. To investigate the role of Tsa cells in stroke, we utilized Gzmk Cas9-KO and WT mice. After sorting Tsa cells on the basis of the respective markers, we adoptively transferred them into the tMCAO model Rag1em1Cd/Gpt mice (Fig. 4C). As shown in Fig. 4D, E, Rag1em1Cd/Gpt mice that received “Tsa cells” from Gzmk Cas9-KO mice presented improved neurological deficit scores and decreased infarct volumes compared with those of the group that received Tsa cells isolated from WT mice. To explore the underlying mechanism, we measured the secretion of TNF-α and IFN-γ in sorted Tsa and Gzmk KO-Tsa cells. Compared with Tsa cells, Gzmk KO-Tsa cells exhibited a reduced secretory capacity for inflammatory cytokines (Fig. 4F, G). To further validate these findings, we conducted an in vitro experiment using a Transwell system. Mouse endothelial cells were seeded in the upper chamber, while Tsa cells or Gzmk KO-Tsa cells were cocultured in the lower chamber (Fig. 4H). Compared with Tsa cells, Gzmk KO-Tsa cells demonstrated a statistically significant reduction in their ability to disrupt endothelial cell permeability, as evidenced by diminished fluorescence leakage, indicating their impaired capacity to compromise the blood‒brain barrier (Fig. 4I).
Identification of the stroke-associated endothelial cell subset that mediates Tsa cell infiltrationThe recruitment of T lymphocytes into the brain parenchyma requires chemotactic cues [35]. To identify stroke-associated parenchymal cell types that may mediate Tsa cell infiltration into ischemic brains, we employed scRNA-seq in brain tissue obtained from the peri-infarct region of the stroked mouse brain. This process generated a cell-by-gene expression matrix, and dimensionality reduction was executed via UMAP and graph-based clustering, revealing a total of 15 major cell types (Fig. 5A). Dimensionality reduction revealed substantial phenotypic disparities between stroke and sham mice, and we identified each cell type on the basis of specific cell markers: astrocytes (Cldn10 and Aqp4), oligodendrocyte precursor cells (OPCs) (Pdgfra and Nnat), oligodendrocytes (Ptgds and Plp1), neurons (Syt1 and Nrg3), endothelial cells (Ly6c1 and Cldn5), pericytes (Kcnj8 and Abcc9), vascular smooth muscle cells (VSMCs) (Tagln and Acta2), fibroblast-like cells (FLCs) (Col1a1 and Col3a1), microglia (Tmem119 and Siglech), macrophages (Ms4a7 and Pf4), monocytes (Ccr2 and Plac8), dendritic cells (DCs) (H2-Aa and Itgax), neutrophils (S100a8 and S100a9), natural killer (NK) and T cells (Cd3e and Cd3g), and B cells (Ly6d and Cd79a) (Fig. 5A, B).
Fig. 5
Identification of the stroke-associated endothelial cell subset that mediates Tsa cell infiltration. A UMAP of the 15 major cell populations identified in the peri-infarct cortex in the stroke group and the corresponding regions in the sham group. Left: Integration of data from the sham and stroke groups. Top middle: the sham group. Bottom middle: The stroke group. Right: Stacked bar graphs showing the proportions of different cells in the sham and stroke groups. B Cell type annotation was performed on the basis of the expression of well-established marker genes. The color of the dots indicates the expression level. The dot size represents the proportion of cells expressing the indicated markers. C Feature plot of Ccl19 expression in all cells. D Schematic of endothelial cells, microglia, astrocytes, and neurons isolated from the brains of tMCAO stroke model mice. E Relative expression of Ccl19 in the sorted cells as determined by qPCR in the sham and tMCAO mice. n = 3 samples for each group; each sample was pooled from 3 animals. F UMAP of the 10 cell populations identified by endothelial cell clustering. Left: Integration of data from the sham and stroke groups. Top right: the sham group. Bottom right: The stroke group. G Dot plot showing the expression of Ccl19 in endothelial cell subsets. H Bar graph showing the percentages of the various endothelial cell subtypes identified in (F) in both the sham and stroke groups. Dot plot showing the expression of Ccl19 in the endo-7 subset in both the sham and stroke groups. I Relative expression of CCL19 in the brains of non-stroke controls and AIS patients, as determined by qPCR. n = 6/group. J CCL19 expression in the brains of non-stroke controls and AIS patients was measured via western blotting. n = 6/group. The data are presented as the means ± SEMs. *P < 0.05; **P < 0.01; ***P < 0.001
Given that CCR7, a migration marker, is highly expressed in Tsa cells, we next analyzed the expression patterns of its ligands CCL19 and CCL21 across various cell types via scRNA-seq. We found that Ccl19, but not Ccl21, was selectively expressed in endothelial cells in our scRNA-seq data (Fig. 5C). Flow cytometry combined with qPCR analysis confirmed the increased expression of Ccl19 in endothelial cells after stroke compared with that in the sham group (Fig. 5D, E). Intriguingly, we found that only a portion of endothelial cells expressed Ccl19, indicating subtype-specific expression of Ccl19 in endothelial cells. We thus selected endothelial cells and reclustered them into ten subsets: Endo-1 to Endo-10 (Fig. 5F). Notably, we found that the proportion of Endo-7, which highly expresses the chemokine Ccl19, was significantly increased in the peri-infarct areas of stroke mice (Fig. 5G, H). Compared with that in the sham group, Ccl19 was highly expressed only in the Endo-7 subset from the stroke group. Furthermore, we collected somatosensory cortex tissues from AIS patients at the Chinese Brain Bank Center (CBBC) (Wuhan, China). The demographic and clinical characteristics of the AIS patients and non-stroke controls are presented in Table S3. CCL19 was elevated in the samples from patients with AIS compared with those from non-stroke controls, as determined by qPCR and western blot analysis (Fig. 5I, J).
Additionally, to elucidate whether Tsa exhibits tissue-specific features related to organ infiltration, we utilized data from the Tabula sapiens Consortium—the most comprehensive human multiorgan single-cell transcriptomic atlas to date [36]. Our analysis revealed that in addition to being expressed in a specific subset of endothelial cells post-stroke, CCL19 exhibited low baseline expression predominantly in stromal cells under normal conditions (Fig. S17A, B). In contrast, CCL21 is expressed primarily in endothelial cells, with higher levels observed in tissues and organs, including the trachea, muscle, vasculature, and lung (Fig. S17C). To identify accumulation patterns beyond the brain, we further analyzed the enrichment of Tsa cells in various peripheral organs post-stroke via flow cytometry. Our findings indicated that Tsa cells accumulated in the lung but not in the heart or liver (Fig. S18). This tissue-specific accumulation pattern of Tsa cells suggests a potential organ-specific role for these cells in the post-stroke immune response, highlighting the complexity of systemic immune reactions following cerebral ischemia.
CCL19-CCR7 coordinates endothelial cell-Tsa cell cross-talkWe next investigated whether CCL19-CCR7 mediated the infiltration of Tsa cells into the brain parenchyma after stroke. Thus, AAV-TIE2-siRNA-Ccl19 was intravenously injected into pretrained mice to specifically downregulate Ccl19 in endothelial cells, which were then subjected to tMCAO on day 21 after AAV injection (Fig. 6A). We confirmed by flow cytometry that injection of AAV-TIE2-siRNA-Ccl19 significantly reduced the expression of Ccl19 in endothelial cells after 3 weeks (Fig. 6B). Next, we assessed the infiltration of Tsa cells from the ischemic brain hemisphere on day 1 after reperfusion and found that the injection of AAV-TIE2-siRNA-Ccl19 significantly reduced the infiltration of Tsa cells into the brain parenchyma (Fig. 6C). Additionally, both the accumulation of the inflammatory factors TNF-α and IFN-γ in the peri-infarct area (Fig. 6D) and the infarct size (Fig. 6E) were significantly lower in the AAV-TIE2-siRNA-Ccl19 group than in the AAV-TIE2-siRNA-NC group.
Fig. 6
CCL19-CCR7 coordinates endothelial cell-Tsa cell cross-talk. A Schematic diagram of Ccl19 lentiviral construction, AAV injection, tMCAO, flow cytometry, infarction examination, ELISA, neurological deficit assessment, and behavioral studies. B Endothelial cells were sorted from the brain tissues of C57BL/6J mice after AAV-TIE2-siRNA-Ccl19 injection. The relative expression of Ccl19 in the sorted cells was determined by qPCR. n = 6/group. C Flow cytometry analysis of the proportion of Tsa cells in the peri-infarct area of stroke mice with downregulated Ccl19. D The levels of the inflammatory factors TNF-α and IFN-γ in the peri-infarct area of tMCAO + AAV-TIE2-siRNA-NC– and tMCAO+AAV-TIE2-siRNA-Ccl19–injected mice were measured via ELISA 24 h after stroke. n = 6/group. E Representative TTC-stained sections from tMCAO+AAV-TIE2-siRNA-NC– and tMCAO+AAV-TIE2-siRNA-Ccl19–injected mice at 24 h after stroke, followed by analysis of infarct volume. n = 10/group. F Neurological deficit scores of AAV-TIE2-siRNA-NC– and AAV-TIE2-siRNA-Ccl19–injected mice 24 h after stroke. n = 10/group. Effects of Ccl19 knockdown on behavioral recovery at different time points after stroke, as measured by the grid walking test (G), cylinder test (H), and adhesive removal test (I). n = 10/group. The data are presented as the means ± SEMs. **P < 0.01; ***P < 0.001; #P < 0.05; ##P < 0.01; ###P < 0.001
Subsequently, neurological deficit scores were assessed on day 1, and behavioral testing was performed on day 4–28. Compared with those in the AAV-TIE2-siRNA-NC group, mice treated with AAV-TIE2-siRNA-Ccl19 exhibited significant improvements in neurological deficit scores (Fig. 6F) and improved performance, including a reduced number of foot faults in the grid-walking test on day 4, 7, and 14 after stroke (Fig. 6G). The cylinder test and adhesive removal test also revealed that, compared with the AAV-TIE2-siRNA-NC group, the AAV-TIE2-siRNA-Ccl19 group exhibited a therapeutic benefit (Fig. 6H, I). These results suggest the therapeutic potential of treating ischemia‒reperfusion injury via direct intervention to reduce the chemotactic recruitment of CCR7-expressing Tsa cells.
A CCR7 peptide designed to disrupt the CCL19‒CCR7 axis reduces ischemia‒reperfusion injuryFinally, we designed a peptide targeting CCR7 to block the interaction between CCL19 and CCR7 (Fig. 7A–C), aiming to investigate its effect on Tsa cell infiltration into the brain parenchyma. Upon identifying potential peptide fragments, we screened two candidates suitable for experimental investigation: the CCR7 peptide 28–33 and the CCR7 peptide 29–35 (Figs. 7D and S19A, B). Binding site predictions for these peptides with CCR7 (Fig. 7E) suggested their potential to inhibit the interaction between CCR7 and CCL19. These two peptides were administered via tail vein injection at different dosages (5, 15, and 45 mg/kg) to tMCAO mice at 0.5 h after reperfusion. Compared with those in the vehicle group, the infarct volumes were significantly lower in the CCR7 peptide 28-33-treated group, with the maximal response at a dose of 15 mg/kg at 24 h after administration (Figs. 7F and S19C, D). However, CCR7 peptide 29–35 treatment did not significantly affect the infarct volume. Thus, 15 mg/kg CCR7 peptide 28–33 was selected for subsequent experimental interventions. Compared with vehicle treatment, CCR7 peptide 28–33 treatment substantially reduced the levels of TNF-α and IFN-γ, but not those of IL-6 or IL-1β, in the brains of the tMCAO model mice (Figs. 7G, H and S20A, B). Neurological deficit scores were significantly lower in CCR7 peptide 28-33-treated mice than in vehicle-treated mice at 24 h after reperfusion (Fig. 7I). Next, we investigated the effects of the CCR7 peptide 28–33 on sensorimotor function in mice. Compared with those in the vehicle group, the performance of the animals administered CCR7 peptides 28–33 improved, with fewer foot faults in the grid-walking test on day 4 and 7 after reperfusion (Fig. 7J). Similar results were recorded with the cylinder test, where animals injected with the CCR7 peptide 28–33 showed reduced bias on day 4 and 7
Comments (0)