
Remember me
The overview is shown in Fig. 1. In this retrospective single-center study, a deep learning-based detection model was developed using CTs of appendicitis patients between January 2011 and December 2020. The model’s prediction was graded with a 5-point Likert scale by two board-certified radiologists using 100 appendicitis and 100 control CTs taken after January 2021.
Fig. 1
Overview of the study. The Likert scale of 3 or higher was regarded as a true-positive prediction
Approval for this study was obtained from the internal Ethics Committee of our institution (reference number: 60-24-0146). Written informed consent was waived due to the retrospective design of the study based on preexisting images. This manuscript was written in accordance with the Checklist for Artificial Intelligence in Medical Imaging [12].
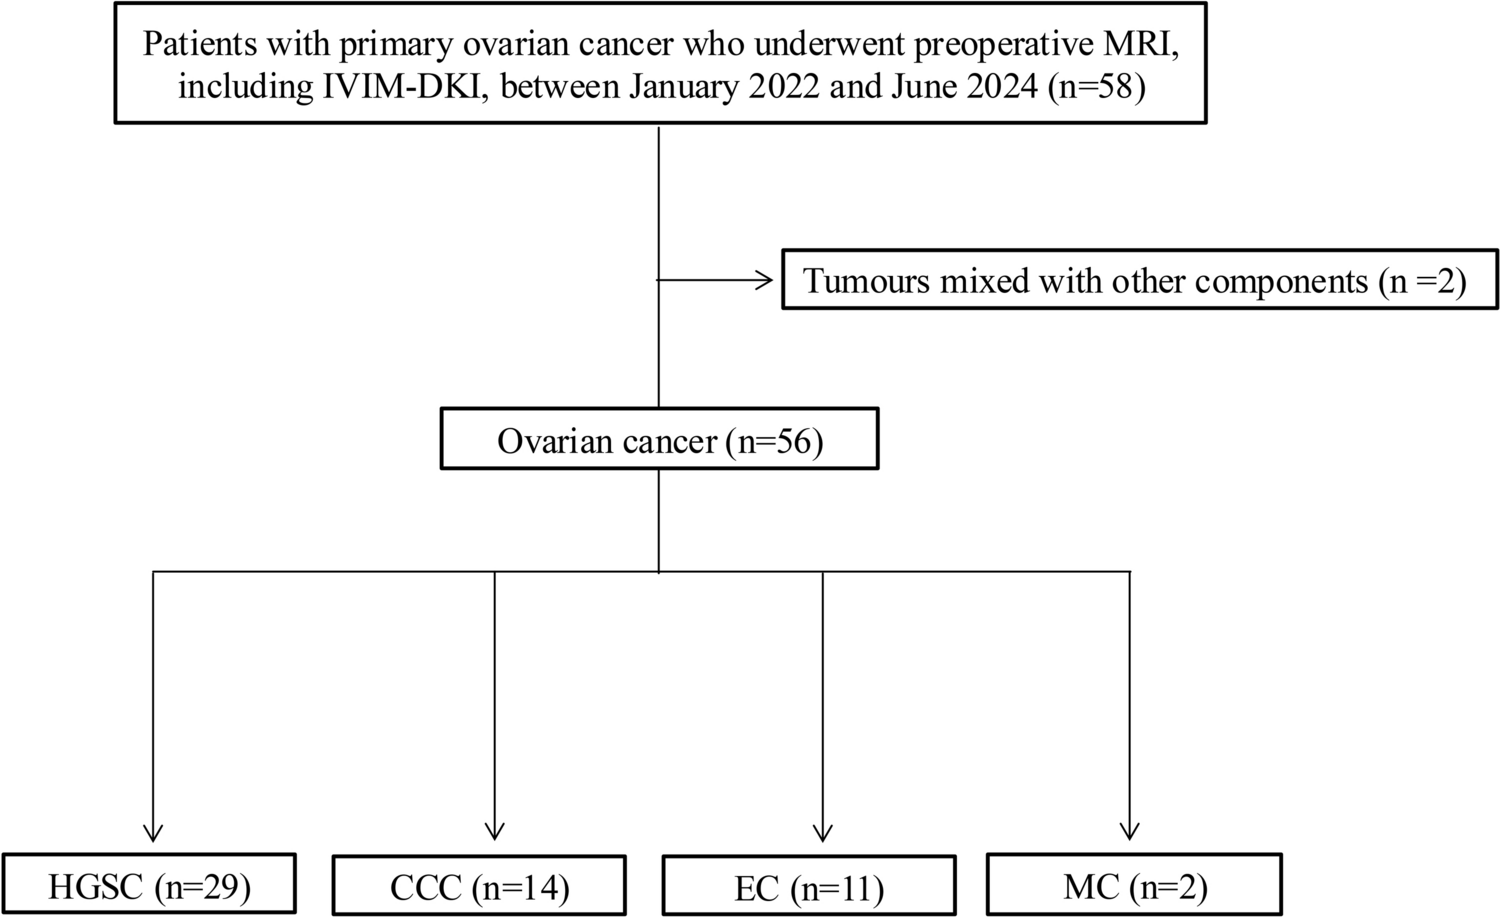
DatasetFor the training and validation datasets, we retrospectively collected CTs of patients with acute appendicitis obtained at Nagoya City University Hospital between 1/1/2011 and 12/31/2020. Of the 567 eligible cases, 517 were randomly allocated to the training dataset. The remaining 50 cases were allocated to the validation dataset, combined with 50 control cases without appendicitis. These control cases were collected by reviewing consecutive CTs performed for acute abdomen before 12/31/2020, in reverse chronological order, until 50 eligible cases were obtained. For the test dataset, 100 CTs of appendicitis cases and 100 CTs of non-appendicitis cases with acute abdomen were consecutively collected after 1/1/2021. The diagnosis of appendicitis was confirmed on both radiology reports and electronic medical records. The exclusion criteria were patient age under 20 years, duplicate patients (the earliest scan was retained), perforated appendicitis, unclear appendicitis location, or appendix tumor pathologically identified after surgery.
Regarding the sample size for test dataset, we set a type I error rate of 5% (α = 0.05) and an acceptable absolute error of ± 5%. Assuming a recall of approximately 80% based on the previous literature [13], the sample size calculation indicated n = 62 [14, 15]. Thus, the number of appendicitis cases in the test dataset was set at 100 to exceed this threshold.
Imaging protocolsAll CTs included in this study were unenhanced, 5-mm-thick axial CTs. They were acquired using three different scanners: SOMATOM Definition Flash and SOMATOM Force (Siemens, Erlangen, Germany), and Aquilion ONE (Canon Medical Systems, Otawara, Japan). The imaging parameters were as follows: 120 kVp tube voltage, 100–800 mA tube current (adjusted via automatic exposure control), 0.6–1.2 helical pitch, 0.25–0.5 s rotation time, 512 × 512 pixel matrix. The CT dose index volume ranged from 6.8 to 29.1 mGy, and dose length product ranged from 264 to 1540 mGy·cm. The multi-slice images were cropped for the abdominopelvic section. CT reconstruction was performed using a vendor-specific soft-tissue kernel with a window level of 50 Hounsfield units (HU) and a window width of 400 HU.
To ensure patient privacy and comply with ethical standards, all CT data were fully de-identified in accordance with the Health Insurance Portability and Accountability Act privacy rule [16]. Patient identifiers, including names, dates of birth, and medical record numbers, were removed from the digital imaging and communications in medicine files.
AnnotationFor the appendicitis CTs in the training and validation datasets, a resident (Y.K. with 3 years of experience in diagnostic radiology) manually annotated the appendix with a 3D bounding box. While the appendix is a tubular structure with various shapes, the bounding box was designated to encompass the entire volume of the appendix from the appendiceal base to the distal portion. In addition, difficult cases with unclear appendicitis locations were reviewed in consultation with a board-certified radiologist (T.T. with 8 years of experience in diagnostic radiology). Normal appendices in the control CTs were not annotated.
Model developmentDeep learning was conducted using the cloud-based AI development service “SYNAPSE Creative Space” (Fujifilm Corporation). As shown in Fig. 2, the pipeline was based on the Faster R-CNN architecture [17]. The details of the deep learning process are explained in the next paragraph.
Fig. 2
Pipeline of the deep learning model. Conv: convolution, BN: batch normalization, ROI: region of interest
As described in the Imaging Protocol section, the obtained CT image in this study consisted of anisotropic voxels, with a z-axis voxel length of 5 mm, an x, y-axis voxel length equal to the field-of-view divided by 512 (typically 0.6–0.8 mm per pixel), and the attenuation value ranged between -225 and 175 HU. These CT images were resampled to 2-mm isotropic voxel volumes using bilinear interpolation preserving the aspect ratio, and the attenuation value [ – 225, 175] was linearly rescaled to a range [0, 1]. Subsequently, the resampled volumes were randomly cropped to [160 × 160 × 160] (= 320-mm cube), the default input size required by the SYNAPSE Creative Space. During training, the feature extractor downsampled each input volume [160 × 160 × 160] to a [40 × 40 × 40] feature map, which was passed to the region proposal network (RPN) and ROI pooling layers (Fig. 2). The RPN proposed candidate regions, and ROI pooling was applied to extract fixed-size [7 × 7 × 7] feature volumes. These were then passed to the region classifier, which used a shared fully connected head for both object classification (classifier) and bounding box regression (regressor). During post-processing, bounding boxes with side lengths ≥ 4 mm, aspect ratios < 10, and confidence scores ≥ 0.3 were retained. For the loss function, cross-entropy loss was applied to the classifier, and smooth L1 loss to the regressor. The batch size was set to 4. Training was performed using the momentum optimizer with a learning rate of 0.0025. Computation was carried out on Nvidia Tesla T4 GPUs (16 GB) and AMD EPYC 7V12 (Rome) CPUs (56 GB) for up to 60 h. The best-performing model was selected based on the harmonic mean of precision and recall (F1 score).
Model evaluationTwo board-certified radiologists (T.Y. and K.H. with 11 and 14 years of experience in diagnostic radiology, respectively) who were not involved in the model’s development process were recruited to evaluate the model’s performance. They reviewed all the CTs in the test dataset and visually assessed the model’s predictions using a 5-point Likert scale (0–4) as follows:
0.No detection.
1.False detection: the AI detects other structures.
2.Poor detection: the AI detects only a limited part of the lesion (approximately less than 50%) or identifies a normal appendix in control patients.
3.Fair detection: the AI prediction is satisfactory enough to locate the lesion but misses peripheral portions or includes too much surrounding tissue.
4.Good detection: the AI appropriately locates the lesion.
As the primary outcomes, we evaluated the model’s precision and recall using the following formulae:
$$\text = \frac = \frac}}$$
$$\text = \frac = \frac}}$$
These metrics are preferred terms in the machine learning field, corresponding to precision = positive predictive value (PPV), and recall = sensitivity, respectively, in the field of diagnostic radiology. TP represents true positives, FP false positives, and FN false negatives. TPs were defined as model predictions where both raters assigned a score of 3 or higher. Otherwise, the model’s predictions were deemed FP. Also, FP rate per patient and the causes of FP predictions were assessed.
Supplemental analysisThe inter-rater variance of the Likert scale was assessed using the weighted kappa statistic [18]. For the appendicitis cases, the former radiologist (T.Y.) also evaluated the following imaging feature rubrics: intra-abdominal fat (minimal, medium, abundant), periappendiceal fat-stranding (slight, moderate, significant) (see Fig. 3), presence of an appendicolith (yes or no), and the appendix diameter (mm, measured as the maximum short axis). The intra-abdominal fat was evaluated because it may be related to the visibility of the appendix. The grading of fat-stranding was adapted and modified from the literature [19]. The effect of these rubrics on recall (= sensitivity) was assessed using binary logistic regression.
Fig. 3
Examples of imaging feature rubrics and their definitions. White arrows indicate the location of appendicitis
Statistical analysisFor descriptive statistics, continuous variables were compared using the Mann–Whitney U test or the Kruskal–Wallis test (for comparing more than two groups), and categorical variables were compared using the Fisher’s exact test. The inter-rater variance was interpreted according to the criteria by Landis and Koch [20], where κ-values of 0.00–0.20 indicate slight agreement, 0.21–0.40 fair agreement, 0.41–0.60 moderate agreement, 0.61–0.80 substantial agreement, and 0.81–1.00 almost perfect agreement. The p values for predictors in the binary logistic regression analysis were calculated using the Wald tests. A two-sided p value of ≤ 0.05 was considered to indicate statistical significance. All statistical analyses were performed with the open-source statistics package R version 4.4.2 [21].
Comments (0)