
Remember me
Thirty-six patients with BMD were included in the natural history study starting in 2014. Two participants were excluded one did not consent to serum sampling and one completed only a single visit for which serum sample was not available. The remaining 34 participants completed 123 study visits. Serum samples were missing or of insufficient quantity for analysis for 32 visits, resulting in 90 samples with a variable number of visits per participant: a single visit (4), two (6), three (23) or four (1) visits. Clinical data was missing on one occasion, resulting in 89 visits with both clinical data and an available serum sample that were included in the correlation with functional tests. For the longitudinal analysis, an additional sample from the 2011 study was available for 17 participants, taken 4.7 years (SD 0.9) prior to the first 2014 study visit, resulting in a total of 107 samples. Thirty-seven participants were ambulant at the first sample, one had lost ambulation between the visit for the 2011 study and the visit for the 2014 natural history study, and another three lost ambulation during the 2014 study.
Forty-eight samples of 19 DMD patients were collected. The number of samples per participant varied; one sample (5), two samples (5), three samples (6), four samples (1) or 5 samples (2). The mean follow-up in participants with multiple samples was 3.4 years (SD.2.1; range 1.0-6.9). Fifteen were non-ambulant at baseline. All four participants who were ambulant at baseline lost ambulation during follow-up. Eighteen participants were treated with an intermittent corticosteroid regime at the time of samples. One participant had been treated with corticosteroids in the past for short periods, but had not taken corticosteroids in the 6 months prior to the first sample. The baseline characteristics are shown in Table 1.
Table 1 Baseline characteristicsStudy design and strategies for data preprocessing of DIA dataDIA mass spectrometry is a powerful tool for proteomic analysis, and its popularity has increased over the past years as more sophisticated algorithms have been developed to combat the challenges of peptide interference in compositional MS2 precursor spectra [30]. In this study, we used DIA MS to analyze 154 serum samples (Fig. 1A) with the aim of studying longitudinal differences between Becker muscular dystrophy (BMD) patients and Duchenne muscular dystrophy (DMD) patients and investigating potential biomarkers of dystrophin expression and functional outcome in BMD. A total of 250 unique proteins were identified from a Prosit spectral library of 2064 protein sequences.
Fig. 1
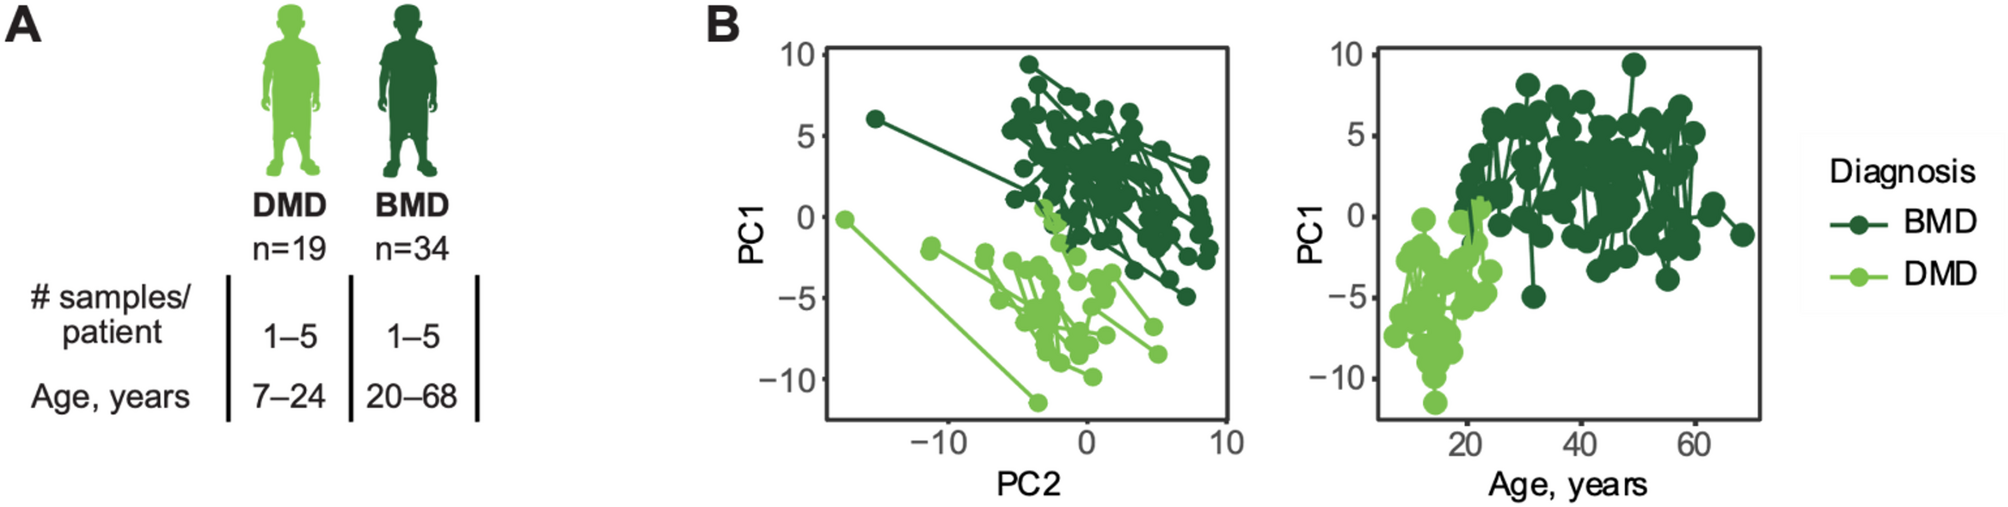
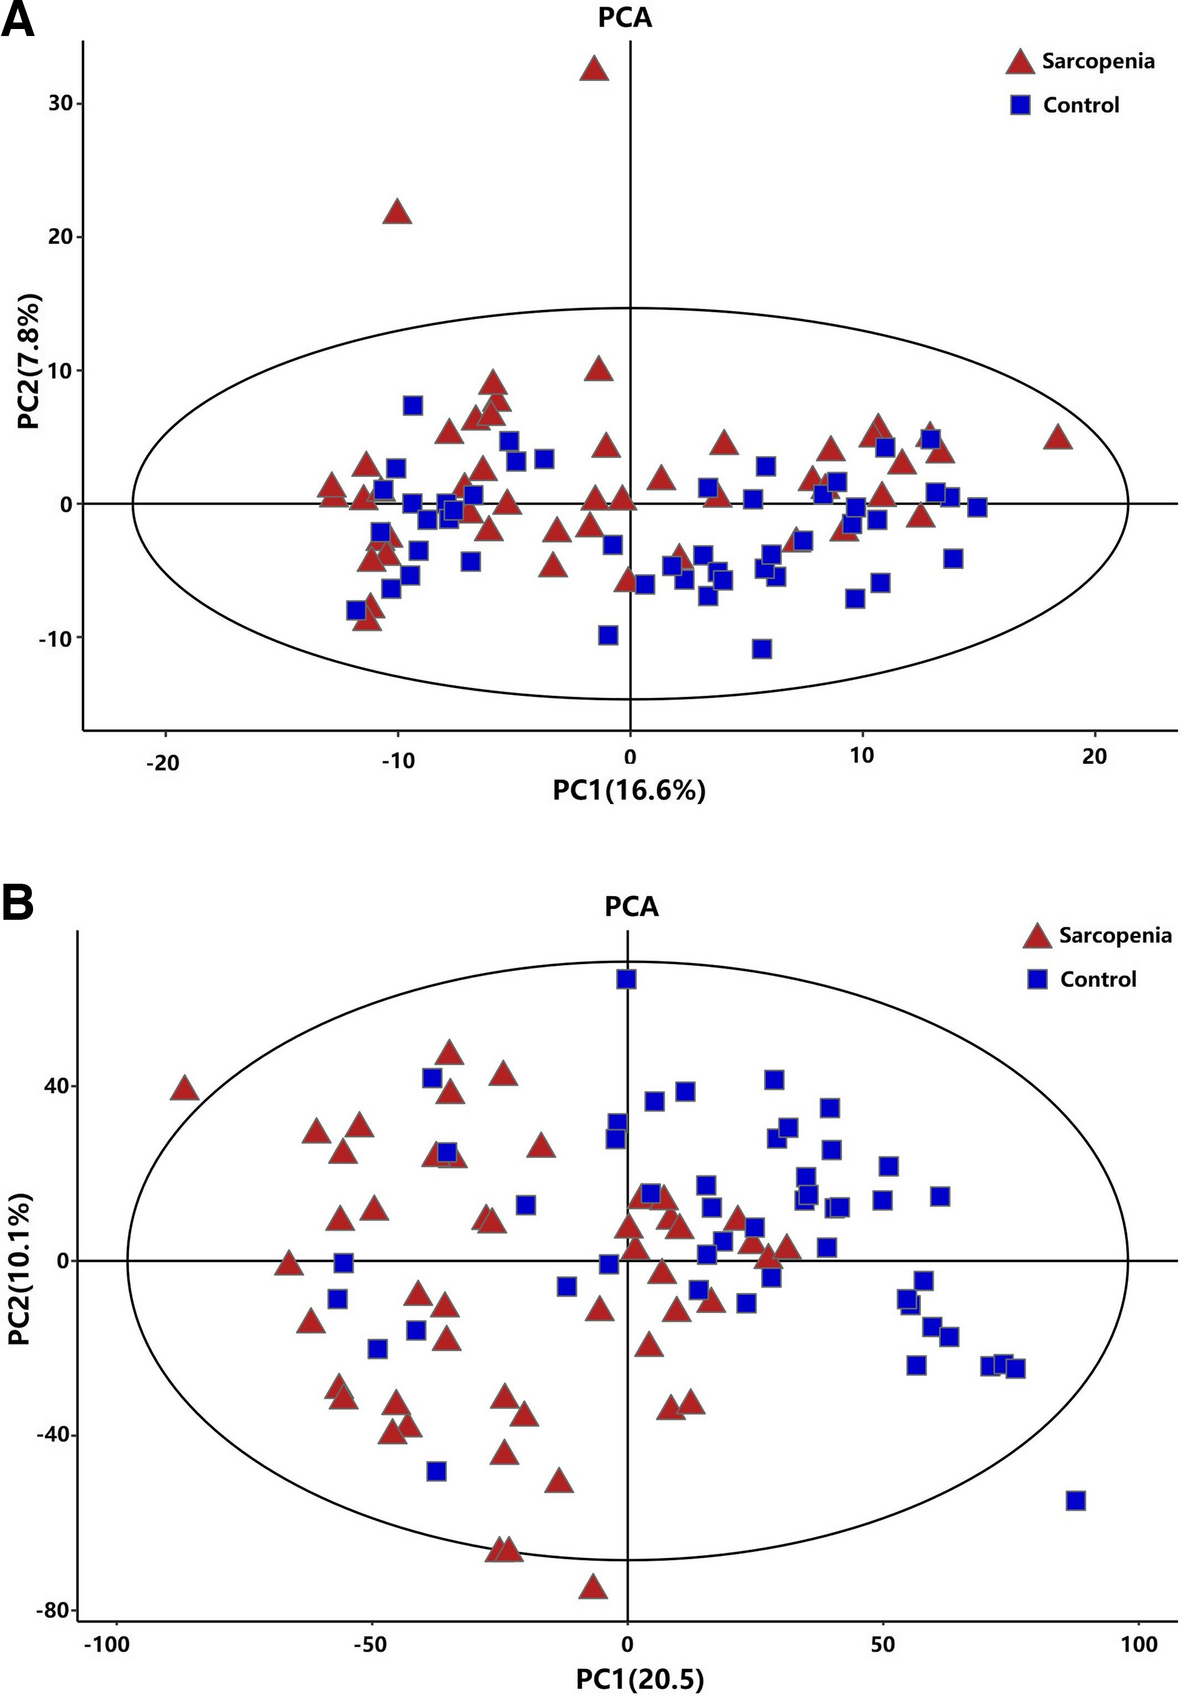
A Study design. B Principal component analysis on protein levels (left) separates DMD patients and BMD patients in first component. The first principal component (PC1) correlated with patient age (right). Each dot represents a sample and samples from the same patient are connected with a line. Light green indicates samples from DMD patients whereas dark green indicates samples from BMD patients
To reduce the effects of technical variations, six normalization methods [26], Total Ion Current (TIC), Median normalisation (Median), Probabilistic Quotient Normalisation (PQN), Median Absolute Deviation (MAD), Quantille normalisation (Quantile) and Bridge normalisation (BRDG) were evaluated (Fig. S2). Probabilistic quotient normalization (PQN) [31] was found to best reduce within-plate and between-plate coefficient of variation (CV) (Fig. S2A-B), whereas principal component analysis (PCA) of quality control samples revealed that only total ion current (TIC) normalisation and within batch bridge normalisation (BRDG-WB) could reduce batch effects between sample replicates (Fig. S2C). PCA analysis of the whole cohort revealed that, while non-normalised data separated DMD and BMD patients in the third component, both median normalisation and PQN moved this separation to first or second component (Fig. S2D). PQN was originally developed for reducing variation from sample dilutions in NMR data [31] and has been used in both affinity proteomics and metabolomics for the same purpose [8, 26]. In metabolomics, PQN is preceded by the TIC normalisation [26]. Since our data contained proteins displaying extreme outlier behaviors (Fig. S3), likely due to keratin contamination, we reasoned that preceding PQN with a median or BRDG-WB normalisation would be more robust to protein outliers than the TIC normalisation. A combination of BRDG-WB and PQN was found to reduce both the batch effect and within plate variation and was therefore selected as the normalization method for all downstream analyses. As a quality control, the same investigation of normalisation methods was performed at peptide level, with comparable results (Fig. S4).
Several proteins show different age trajectories between DMD and BMDPrincipal component analysis could almost completely separate DMD and BMD patients (Fig. 1B). Linear mixed effects models were used to assess whether differences between groups and age had a comparable role on the protein trajectories in DMD and BMD patients, i.e. detect changes in how fast a protein abundance in serum increased or declined with patient age. A total of 29 proteins were found to be correlated with age in DMD patients (Fig. 2A, Table S3) whereas two proteins correlated with age in BMD patients (Fig. 2A, Table S4), of which one protein, PKM, was associated with age in both DMD patients and BMD patients. While age is a good predictor of disease progression in DMD patients [8], it is less so for BMD, where progression is more heterogenous and less age dependent according to functional scales. Hence, we sought to investigate whether protein trajectories changed over time (up to seven years of follow-up) in DMD patients or BMD patients regardless of patient age and progression state at enrolment. Linear mixed effects models using time from the first collected sample as a fixed effect, showed that much fewer proteins changed over the course of the study compared to proteins that changed with patient age in DMD (Fig. 2C, Table S5). Four proteins changed over time in BMD (Table S6). These proteins showed significant associations only in BMD patients.
We then assessed whether the protein trajectories were comparable across DMD and BMD patients and identified a set of 21 proteins (Fig. 2B; Table 2) with altered age trajectory. We define an altered age trajectory as a significant change in the rate of decline or increase of protein abundance with age in DMD compared to BMD patients, βDMD: Age. A few proteins with altered age trajectories between DMD and BMD are shown in Fig. 2C. PKM, was associated with age in both DMD and BMD patients, but showed a steeper age trajectory in DMD patients. Using a previously developed and published absolute quantitative panel of heavy labelled protein epitope signature tags (PrESTs) [32], we confirmed the age trajectories of FGG and LDHB (Fig. 2D).
Fig. 2
Proteins significantly correlated with age or time from first sample in DMD and BMD, separately, using linear mixed effects models with either age or time from first sample as fixed effect and patient as random effect. One protein (PKM) correlated with age in both DMD patients and BMD patients. B Volcano plots (left) for proteins that change in either intercept (βDMD) or trajectory slope (βDMD: Age) between DMD and BMD patients as assessed through a linear mixed effect model with age and diagnosis as fixed effects and patient as random effect. The Venn diagram (right) shows overlap between proteins that differ between DMD patients and BMD patients, with respect to both intercept and age trajectory. C Spaghetti plots for some proteins with changed age trajectory between DMD and BMD. Each dot represents a sample, and samples from the same patient are connected. D FGG and LDHB were absolute quantified and trajectories are confirmed using SRM-MS
Table 2 Proteins with different age-trajectory between DMD patients and BMD patients. Significant FDR-values are marked with an * and in grey. The overlap between proteins that differ between DMD patients and BMD patients, with respect to both intercept and age trajectory, are listed in bold fontProteins related to functional outcome were identified in BMD patientsWe then sought to determine whether any relationship exists between motor function and longitudinal protein signatures in patients with BMD. Five motor function performance metrics were investigated, 10-meter walk/run test velocity (10MWRTv), rise from floor (RFFv) velocity, climb/descend four stairs (4-SCv/4-SDv) velocity, and North Star Ambulatory Assessment (NSAA) score. A linear mixed effects model, with patient as random effect and one of each motor function performance metric as a fixed effect, revealed ten proteins, N-acetylmuramoyl-L-alanine amidase (PGLYRP2), gelsolin (GSN), tenascin-X (TNXB), serum amyloid P-component (APCS), complement C3 (C3), complement factor I (CFI), hemopexin (HPX), C4b-binding protein beta chain (C4BPB), plasminogen-like protein B (PLGLB1/ PLGLB2), and tetranectin (CLEC3B) which correlate with NSAA score in BMD. C4BPB and PGLYRP2 were also correlated with RFF (Table 2). Seven out of these ten proteins (C4BPB, HPX, CFI, C3, APCS, GSN, and PGLYRP2) are involved in the immune response.
A2M trajectory changes with level of dystrophin expression in the TA of BMD patientsAs several dystrophin restoring therapies are currently in clinical trials today, with both microdystrophin therapies and exon skipping therapies having gained accelerated FDA approval in recent years, we sought to investigate whether any of the observed protein trajectories were affected by dystrophin expression in BMD patients. Among the 34 BMD patients included in the present study, dystrophin expression in the TA was measured in12 patients, with expression ranging between 18% and 86% of that in healthy control skeletal muscle [14]. We identified, only alpha-2-macroglobulin (A2M) as being associated with dystrophin expression with significant FDR-values. A2M decreased faster over both time and age in patients with low dystrophin expression compared to patients with high expression of dystrophin (Table 3 and Fig. S5). This observation was in agreement with the age-related decline of A2M in DMD patients (Table 4), who either lack dystrophin expression in their muscles or display expression of only a few percent compared to healthy tissue. Interestingly, A2M did not decrease with age or time alone in the BMD patients (Table S3-S6).
Table 3 Proteins correlated with functional tests (ft) in BMD patients. Analysis was performed using a linear mixed effects model with the functional test (ft) as fixed effect and patient ID as random effect. Significant FDR-values are marked with an * and in greyTable 4 Proteins correlated with dystrophin expression in BMD patients when accounting for either time or age. Analysis was performed using a linear mixed effects model with either time from first visit in years (time) or patient age (age), dystrophin expression in TA (dys%) as a fraction of expression in healthy tissue and their combination (time: dys % or age: dys %) as fixed effects and patient ID as random effect. Significant FDR-values are marked with an * and in grey
Comments (0)