
Remember me
Weight gain as the primary effect of leptin deficiency was measured weekly from 9 to 21 weeks of age. Both ob/ob male and female mice gained significantly more weight than their age-matched control mice (wild-type, wt) (Supplementary Fig. 1A), confirming the leptin deficiency obesogenic effect.
Although most obese mouse strains develop type 2 diabetes mellitus, ob/ob mice on the C57BL/6 J background exhibit moderate and transient hyperglycemia, which is noticeable for a brief period between 8 and 12 weeks of age [42, 43]. Consistent with previous studies and regardless of sex, Lepob/ob and wt mice showed no differences in blood glucose levels at 20 weeks of age (Supplementary Fig. 1 B).
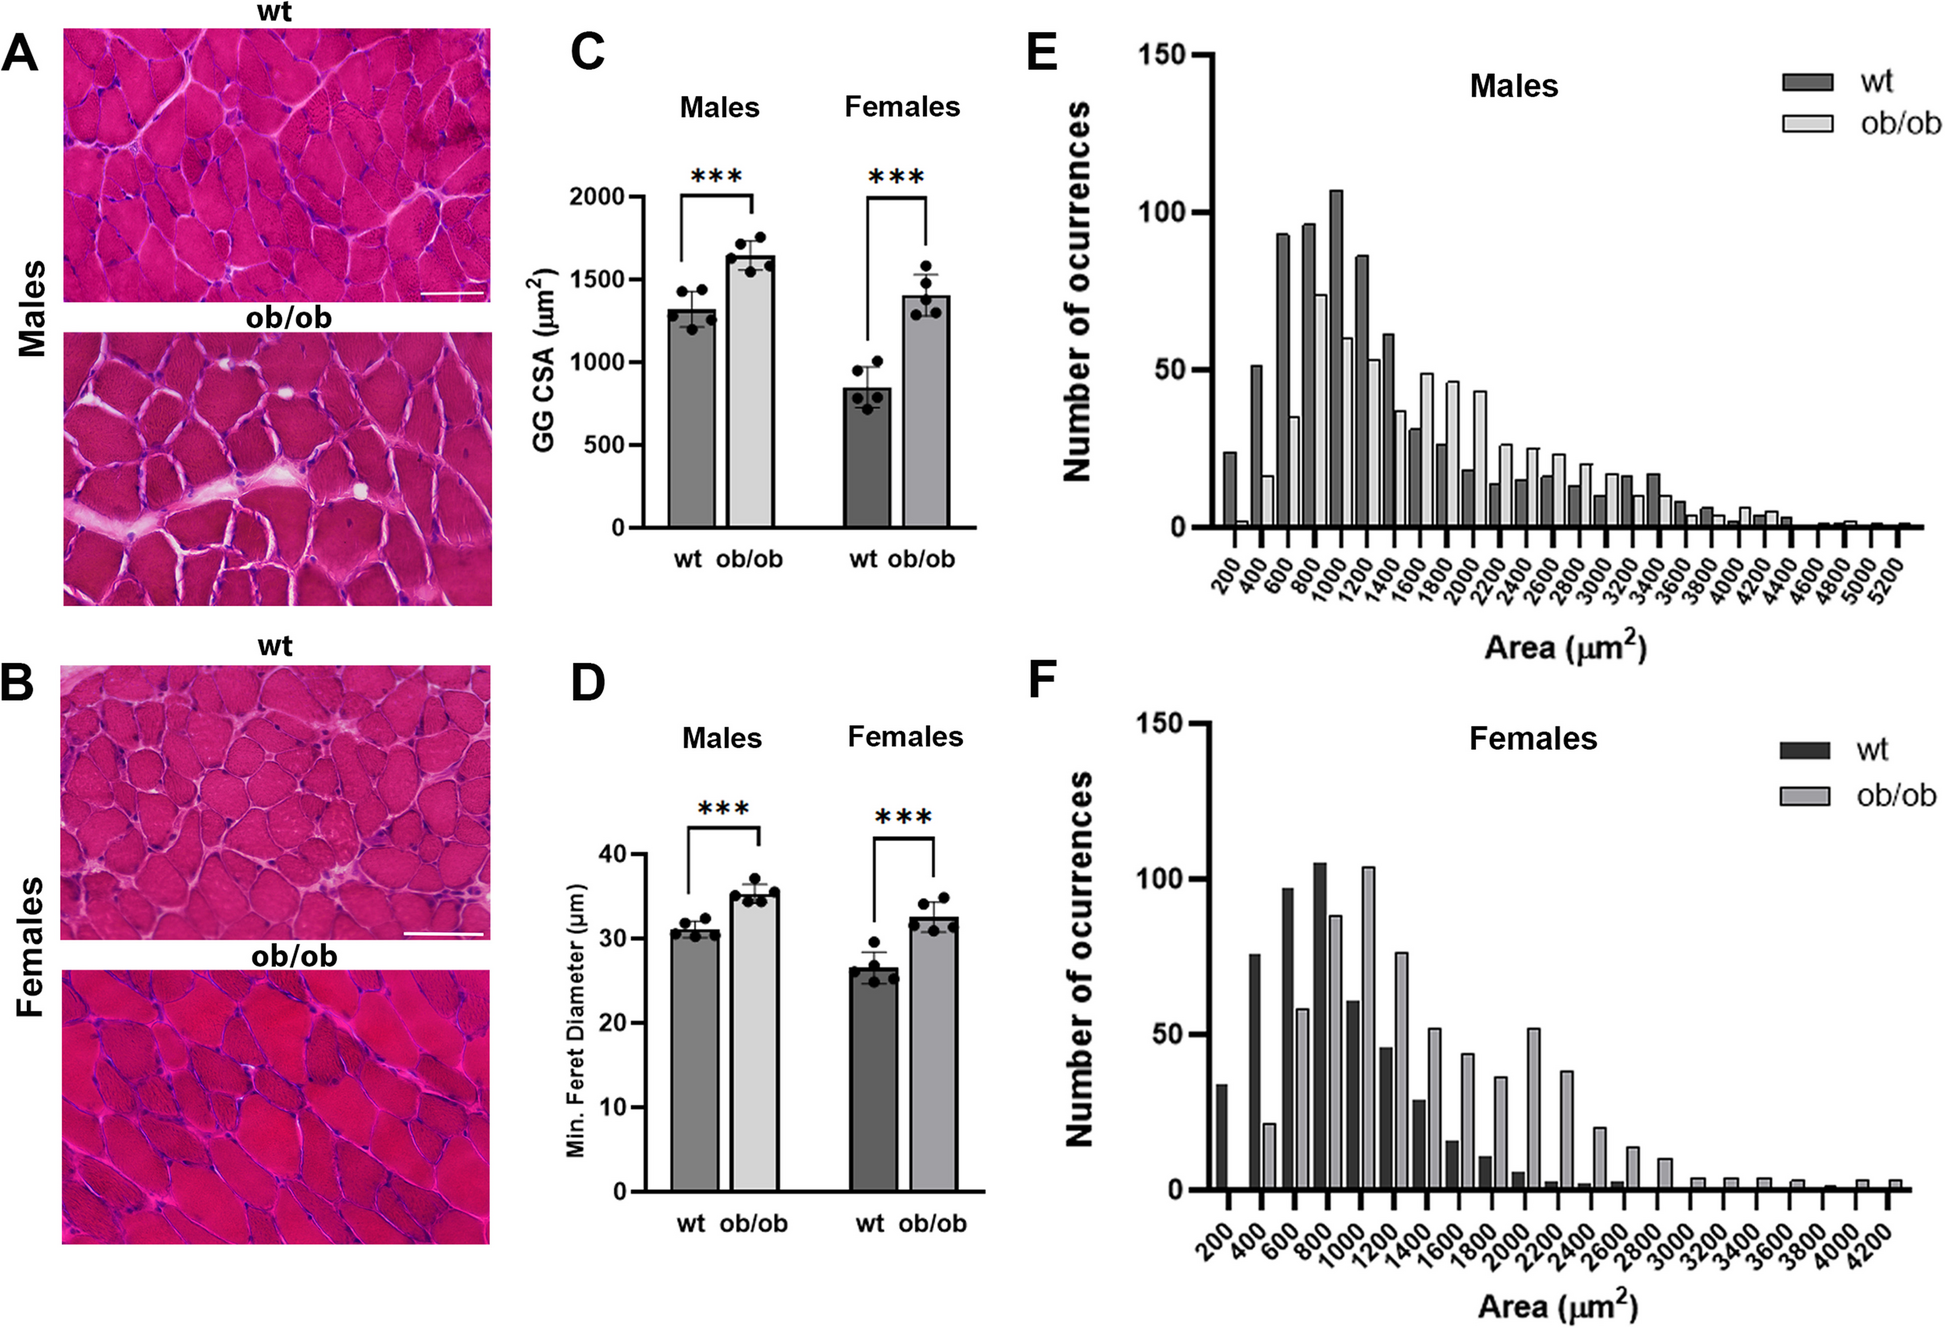
Histopathologic features of Lepob/ob GG muscleLepob/ob male mice experience recurring hypopneas and decreased oxygen levels during sleep, resembling obstructive sleep apnea in humans [37]. To assess the influence of obesity on the GG muscle from male and female mice, 20-week-old wt and Lepob/ob mice were euthanized, and GG muscles were extracted and processed for cryosection. Next, GG muscles were stained with hematoxylin and eosin (H&E) staining (Fig. 1 A, B) to assess the cross-sectional area and the percentage of central nuclei. To determine the muscle fiber cross-sectional size, we used two different geometrical parameters: the cross-sectional area and the minimal Feret’s diameter, which is a parameter that disregards experimental mistakes like the sectioning angle orientation [44]. We analyzed the H&E-stained frozen sections of the GG muscles, and we found that in wt males, the myofiber cross-sectional areas were smaller than in the Lepob/ob mice; wt: 1320 ± 108 μm2, N = 5 mice; Lepob/ob: 1645 ± 88 μm2, N = 5 mice, p = 0.0008 (Fig. 1 C). Similarly, Lepob/ob females exhibited larger cross-sectional areas than wt females (wt: 848 ± 123 μm2, N = 5 mice; Lepob/ob: 1404 ± 124 μm2, N = 5 mice, p = 0.0001) (Fig. 1 C). In the minimum Feret diameter quantification, wt male mice showed a smaller diameter than Lepob/ob males (wt: 31 ± 0.95 μm, N = 5 mice; Lepob/ob: 35.3 ± 1.1 μm, N = 5 mice, p = 0.0002) (Fig. 1 D). Similarly, Lepob/ob females exhibited greater minimum Feret diameter than wt females (wt: 26.5 ± 1.8 μm, N = 5 mice; Lepob/ob: 32.5 ± 1.7 μm, N = 5 mice, p = 0.0008) (Fig. 1 D). To evaluate variations in the myofiber population, histograms of individual myofiber areas divided into 200 μm2 size bins were created. The frequency histogram analysis showed significant differences in area distribution between the two groups of males (Fig. 1 E, p < 0.0001) and between the two groups of females (Fig. 1 F, p < 0.0001).
Fig. 1
GG muscle in Lepob/ob mice. A, B Representative cross-sectional images of the GG muscle from 20-week-old wild-type (wt) and Lepob/ob male mice (A) and female mice (B) are shown. Images were taken at × 20 magnification. C Muscle fiber cross-sectional area (CSA) was quantified from the Hematoxylin and Eosin (H&E) staining for each group. Lepob/ob male and female mice exhibited an increased CSA compared to wild-type mice. D Quantification of the minimal Feret’s diameter of GG muscles in Lepob/ob and wild-type male and female mice. E Frequency histograms showing GG muscle fiber size (cross-sectional area) in wild-type and Lepob/ob male mice. F Frequency histograms showing GG muscle fiber size in wild-type and Lepob/ob female mice. Values are expressed as means ± S.D. Data were collected from 5 mice per group, with more than 600 fibers analyzed in each group. (C, D: Mann–Whitney U test, ***p < 0.001; E, F: Welch's test, p < 0.0001). Scale bar = 50 µm
Male Lepob/ob mice exhibited muscle pathology compared to controls. We observed an elevated percentage of centrally nucleated myofibers indicative of muscle regeneration in the Lepob/ob mice (12.6 ± 3%, N = 4 mice) compared to wt males (1.1 ± 0.85%, N = 4 mice), p = 0.0004 (Fig. 2 A, C). Lepob/ob males also revealed a larger endomysium area (defined as the collagen-rich extracellular matrix surrounding individual muscle fibers) compared to wt mice (Figs. 1 A and 2 A, E and Supplementary Fig. 2), but no significant differences were observed in GG muscle fibers from wt and Lepob/ob females, as their fibers were densely arranged as expected in healthy muscles (Supplementary Fig. 2). No significant differences were found in the percentage of fibers with central nuclei in female mice (wt: 0.87 ± 0.12%, N = 4 mice; Lepob/ob: 1.3 ± 0.5%, N = 4 mice, p = 0.11 (Fig. 2 D). In addition, Lepob/ob males exhibited scattered necrosis, myofiber size variation, pale myofibers invaded by cells, opaque fibers with dark cytoplasm, and split muscle fibers as a relatively symmetrical divide along the length of the muscle fiber (Fig. 2 E and Supplementary Fig. 2) that may indicate injury and regeneration but can also be a normal response to intense loading and muscle growth [45]. No histological defects were found in Lepob/ob female mice compared to control females at 20 weeks of age.
Fig. 2
Male Lepob/ob mice exhibited muscle pathology compared to controls. A Left: Representative images of H&E-stained GG muscles from 20-week-old wild-type and Lepob/ob male mice. Central nuclei are observed in several muscle fibers of Lepob/ob male mice. Scale bar = 50 µm. Right: Transmission electron micrographs of GG muscle showing a centralized nucleus in Lepob/ob male mice. Scale bar = 5 µm. B Representative images of H&E-stained GG muscles from 20-week-old wild-type and Lepob/ob female mice. Images were taken at × 20 magnification. C Histogram showing the percentage of centrally nucleated muscle fibers in male mice (Mann–Whitney U test, ***p < 0.001). D Histogram showing the percentage of centrally nucleated muscle fibers in female mice (Mann–Whitney U test, p = 0.11). E Histological abnormalities of GG muscles from Lepob/ob male mice. Black asterisks indicate necrosis in pale muscle fibers, some of them invaded by small cells. Black arrows show muscle fiber splitting. Images were taken at × 40 magnification. Scale bar = 50 µm. F NADH-TR staining intensity in wild-type and Lepob/ob male mice. Representative images were taken at × 20 magnification in GG muscles. Scale bar = 50 µm. G Percentages of light-stained (type II) and dark-stained (type I) myofibers in the GG muscles from wild-type and Lepob/ob male mice. Values are shown as means ± SD. (Mann–Whitney U test, *p < 0.05) (H) Histograms show cross-sectional areas of type I and II muscle fibers. Wild-type male mice exhibited smaller cross-sectional areas of both type I and type II muscle fibers compared to Lepob/ob male mice. Values are expressed as means ± SD (Mann–Whitney U test,*p < 0.05, ****p < 0.0001). I NADH-TR staining intensity in wild-type and Lepob/ob female mice. Images were taken at × 20 magnification. Scale bar = 50 µm. J Percentages of light-stained (type II) and dark-stained (type I) myofibers in the GG muscles from wild-type and Lepob/ob female mice. Values are shown as means ± SD (Mann–Whitney U test, ns = non-significant). K Histograms show cross-sectional areas of type I and II muscle fibers. Wild-type female mice exhibited smaller cross-sectional areas of both type I and type II muscle fibers compared to Lepob/ob female mice. Values are shown as means ± SD, Mann–Whitney U test, ****p < 0.0001. Data were collected from four mice per group, with more than 500 fibers analyzed in each group
The proportion of different muscle fiber types can alter in response to diverse causes such as exercise, mitochondrial dynamics, aging, or genetics [46,47,48,49,50]. We used NADH staining as a marker for type I and type II fibers to analyze modifications in muscle fibers among the distinct groups. We found significant differences in the percentage of type I fibers between wild-type males and Lepob/ob male mice (wt: 45.4 ± 3.9% SD, N = 4 mice; Lepob/ob: 39.24 ± 1.7% SD, N = 4 mice, p = 0.03) or in the percentage of type II fibers (wt: 54.6 ± 3.9% SD, N = 4 mice; Lepob/ob: 60.76 ± 1.7% SD, N = 4 mice, p = 0.03) (Fig. 2 F, G). To evaluate whether any fiber type was more susceptible to either atrophy or hypertrophy in leptin-deficient males, we measured the cross-sectional areas of type I and II myofibers from each group of mice and found that wt mice exhibited smaller cross-sectional areas of type I fibers than Lepob/ob males (wt: 968 ± 56 μm2, N = 4 mice; Lepob/ob: 1516 ± 82 μm2, N = 4 mice, p < 0.0001) and also smaller cross-sectional areas of type II fibers compared to Lepob/ob males (wt: 2690 ± 117 μm2, N = 4 mice; Lepob/ob: 3084 ± 208 μm2, N = 4 mice, p = 0.02, Fig. 2 H) consistent with the overall larger cross-sectional area of muscle fibers exhibited by Lepob/ob males (Fig. 1 C, E).
Lepob/ob females and wt female mice did not show differences in the percentage of type I fibers (wt: 45 ± 0.82% SD, N = 4 mice; Lepob/ob: 47 ± 1.7% SD, N = 4 mice, p = 0.49) or the percentage of type II fibers (wt: 55 ± 1.7% SD, N = 4 mice; Lepob/ob: 53 ± 2% SD, N = 4 mice, p = 0.49) (Fig. 2 I, J). As male mice, wild-type females showed smaller cross-sectional areas than Lepob/ob females in both type I fibers (wt: 767 ± 75 μm2, N = 4 mice; Lepob/ob: 1185 ± 27 μm2, N = 4 mice, p < 0.0001) and type II fibers (wt: 1354 ± 107 μm2, N = 4 mice; Lepob/ob: 2262 ± 158 μm2, N = 4 mice, p < 0.0001) (Fig. 2 K).
These results suggest that leptin-deficient male mice exhibit significant pathological alterations in GG muscles compared to age-matched wt and Lepob/ob female mice.
Ultrastructural changes in GG muscles of Lep ob/ob miceBecause Lepob/ob male mice showed muscle pathology unlike Lepob/ob females and control mice, we further investigated the muscle fiber ultrastructure of leptin-deficient males. To this end, GG muscles from Lepob/ob and age-matched control males were dissected, processed, and imaged in the transmission electron microscope (Fig. 3 and Supplementary Fig. 3). Ultrastructure analysis revealed a large amount of intramyocellular lipid droplets in the Lepob/ob muscles (Fig. 3 b) and excessive accumulation of subsarcolemmal mitochondria (Fig. 3 d, e) compared to wild-type GG muscles (Fig. 3 a, c). Mitochondria associated with lipid droplets (peridroplet mitochondria) were more abundant in Lepob/ob GG than in age-matched controls (Fig. 3 f–h). In addition to the accumulation of subsarcolemmal mitochondria, excess intermyofibrillar mitochondria accumulation was found in GG of Lepob/ob males (Fig. 3 i). Furthermore, GG muscles of Lepob/ob males showed abnormal mitochondria displaying alterations in cristae morphology (Fig. 3 k, i). In contrast, wild-type males exhibited regular mitochondria with an undamaged inner membrane and extensive cristae (Fig. 3 j).
Fig. 3
Transmission electron microscopy (TEM) findings in the GG muscle of male mice. a Representative TEM micrograph of a cross-section of GG muscle from a wild-type male mouse. b Representative TEM micrograph of a cross-section of GG muscle from a Lepob/ob male mouse. Black arrows indicate mitochondria associated with lipid droplets, while the white arrow indicates subsarcolemmal mitochondria. c TEM micrograph of a cross-section of GG muscle from a wild-type male mouse, showing both subsarcolemmal (white arrow) and intermyofibrillar mitochondria, with no peridroplet mitochondria (black arrow). d Increased accumulation of subsarcolemmal (white arrow) mitochondria in GG muscle from a Lepob/ob male mouse. The intermyofibrillar mitochondria are associated with lipids (indicated by the boxed region). e Myonucleus (N) and subsarcolemmal mitochondria in a Lepob/ob male mouse. Note the irregularities in the myonuclear membrane, including a discontinuous nuclear envelope, invaginations, and high chromatin density. f A cross-section of GG muscle from a wild-type male mouse showing a normal nucleus (N) with normal chromatin density and nuclear envelope. g Peridroplet mitochondria (M) from the boxed region in d. h Intermyofibrillar mitochondria (M) in the GG muscle from a wild-type mouse. i Mitochondrial accumulation (MA) in the GG muscle of a Lepob/ob male mouse. j Intermyofibrillar mitochondria (M) in the GG muscle of a wild-type mouse showing normal cristae structure. k Mitochondria (M) in the GG muscle of a Lepob/ob male mouse exhibit abnormal cristae, characterized by excessive spacing and fragmentation. l An organelle resembling a giant mitochondrion is observed in the GG muscle of a Lepob/ob male mouse. (LD: lipid droplet). Original magnification: a and b, 1200x; c-f, 2900x; g-i, 6800x; j-l, 13000x
Neuromuscular junction of GG muscles of Lep ob/ob miceWe next assessed whether the pathological changes in muscle tissue influenced the structural integrity of the neuromuscular synapse, a crucial component of muscle physiology. To analyze the morphology of the neuromuscular junctions (NMJs), fixed GG muscles of males and females from both groups were bathed with BTX-Alexa488 (green) to label postsynaptic AChRs. Then, the NMJs were imaged with a confocal microscope. High-resolution images from the confocal microscope revealed that several neuromuscular synapses of leptin-deficient male mice exhibited areas devoid of AChRs that appeared as perforations in the synaptic branches compared to the densely distributed receptors at the NMJs of leptin-deficient females and wild-type mice (Fig. 4 A and Supplementary Fig. 4). We quantified the incidence of the holes/perforations, and the perforation size and we found that leptin-deficient males exhibited a significantly higher percentage of perforated NMJs than wt male mice (wt: 21 ± 7% SD, N = 4 mice, 86 NMJs analyzed; Lepob/ob: 47 ± 12% SD, N = 6 mice, 90 NMJs analyzed, p = 0.02) (Fig. 4 B). In contrast, wt and Lepob/ob females showed a similar percentage of synaptic perforations (wt: 14.6 ± 2% SD, N = 5 mice, 70 NMJs analyzed; Lepob/ob: 15.5 ± 5% SD, N = 4 mice, 80 NMJs analyzed, p = 0.72) (Fig. 4 D). The average area of the perforations in wt males was 0.75 ± 0.2 and found that wt mice exhibited smaller cross-sectional areas μm2 SD, and Lepob/ob males was 3 ± 0.47 μm2 SD, p = 0.009 (Fig. 4 C). Wt and Lepob/ob females showed no significant differences in the perforation areas (wt: 0.70 ± 0.26 μm2 SD; Lepob/ob: 0.87 ± 0.11 μm2 SD, p = 0.28) (Fig. 4 E).
Fig. 4
NMJs in Lepob/ob male mice exhibited larger perforations compared to those in control mice. A Confocal images show examples of NMJs from the GG muscle of wild-type male mice (left panel), wild-type female mice (middle panel), and Lepob/ob female mice (right panel). The lower panels display confocal images of the GG muscle from Lepob/ob male mice. White arrows indicate perforations within the NMJs where AChRs are missing. B A graph illustrating the increased percentage of NMJs with perforations in Lepob/ob male mice compared to wild-type mice. C A graph illustrating the area of synaptic perforations. D A graph illustrating the percentage of NMJs with perforations in wild-type and Lepob/ob female mice. E A graph illustrating the area of synaptic perforations. Values are shown as means ± SD, Mann–Whitney U test,*p < 0.05, **p < 0.01, ns = non-significant. Data were collected from at least four mice per group, with more than 70 NMJs analyzed in each group. Scale bar = 10 µm
These results indicate that NMJs from Lepob/ob males undergo partial synaptic disassembly, characterized by areas of low receptor density or a void of receptors, appearing as perforations. These areas are significantly more numerous and pronounced compared to age-matched controls and leptin-deficient females.
One characteristic of the mammalian NMJ is the clustering and maintenance of AChRs at high density in the postsynaptic membrane [51,52,53,54,55]. To examine whether the perforations found in the leptin-deficient NMJs altered the overall density of the AChRs at the synapse, we examined GG muscles exposed to a saturating dose of BTX-Alexa488 to label all postsynaptic AChRs. The NMJs were imaged, and the fluorescence intensity of tagged AChRs was assessed and expressed as a percentage of the fluorescence of the wild-type synapses. We found that the density of postsynaptic AChRs in the GG muscle of Lepob/ob males decreased by ~ 28% (72 ± 6.6%, n = 165 NMJs, N = 5 mice) compared to control males (100 ± 4%, n = 196 NMJs, N = 5 mice), p = 0.0067 (Fig. 5 A). We did not observe any significant differences between the AChR density of Lepob/ob females and their age-matched controls (wt: 100 ± 8.7%, n = 106 NMJs, N = 5 mice; Lepob/ob: 96.7 ± 5.3%, n = 127 NMJs, N = 5 mice, p = 0.5) (Fig. 5 C). Next, we investigated if alterations in the NMJ area are associated with a reduction in the density of AChRs in Lepob/ob males. As shown in Fig. 5 B, there were no significant differences in the synaptic area between wild-type and Lepob/ob male mice (wt: 692 ± 40 μm2 SD, n = 196 NMJs, N = 5 mice; Lepob/ob: 678 ± 53 μm2 SD, n = 165 NMJs, N = 5 mice, p = 0.65) or between wild-type females and Lepob/ob female mice (wt: 620 ± 36 μm2 SD, n = 111 NMJs, N = 5 mice; Lepob/ob: 655 ± 23 μm2 SD, n = 136 NMJs, N = 5 mice, p = 0.1) (Fig. 5 D). These results indicate that the density of nicotinic AChRs at the NMJs of GG muscle is altered in Lepob/ob male mice, even if the overall size of the endplate remains unaffected, suggesting that the number of postsynaptic AChRs declines in Lepob/ob males but not in Lepob/ob females.
Fig. 5
The density and turnover rate of postsynaptic AChRs are significantly altered in Lepob/ob male mice. A GG muscles were labeled with a saturating dose of α-BTX-AlexaFluor 488, imaged, and the fluorescence intensity of tagged AChRs was assessed as a percentage of the fluorescence of wild-type synapses. The graph summarizes the quantification of fluorescent data from NMJs of wild-type and Lepob/ob male mice. Values are shown as means ± SD. B The graph summarizes the synaptic areas from NMJs of wild-type and Lepob/ob male mice. Values are shown as means ± SD. C The graph summarizes the quantification of fluorescent data from NMJs of wild-type and Lepob/ob female mice. Values are shown as means ± SD. D The graph summarizes the synaptic areas from NMJs of wild-type and Lepob/ob female mice. Values are shown as means ± SD. Data were collected from five mice per group, with more than 100 NMJs analyzed in each group. E Representative fluorescent images from the inverted fluorescence microscope show NMJs labeled with spectrally distinct BTX, displaying “Old AChRs” (green) and “New AChRs” (red) in GG muscles of wild-type and Lepob/ob male mice. F Quantification of postsynaptic AChR turnover. Values are shown as means ± SD. Mann–Whitney U test, **p < 0.01, ns = non-significant. Data were collected from five mice per group. Scale bar = 10 µm
The significant remodeling observed in the GG muscle of leptin-deficient males, including a reduced density of AChRs, synaptic perforations, and fragmentation of AChR clusters, might suggest an increased rate of AChR turnover. We next examined the dynamics of postsynaptic AChRs in Lepob/ob and wt males. To measure AChR turnover, we injected BTX-Alexa488 (green, 0.4 μg/g) to label pre-existing AChRs, and 48 h later, BTX-Alexa549 (red, 0.4 μg/g) to label new receptors before euthanizing the mice 8 h later. Muscles were dissected for whole-mount sections, imaged under the inverted fluorescence microscope, and processed in ImageJ software to determine the relative distribution of fluorescence intensities for BTX-AF488 ("old receptors") and BTX-AF594 ("newly inserted receptors"). Compared to controls with low AChR turnover, Lepob/ob males showed higher AChR turnover (wt: 0.18 ± 0.015 SD, n = 50 NMJs, N = 5 mice; Lepob/ob: 0.5 ± 0.14 SD, n = 57 NMJs, N = 5 mice, p = 0.007) (Fig. 5 E, F). These results suggest that the stability of postsynaptic AChRs in the GG muscle is altered in Lepob/ob male mice.
Considering the abnormalities observed at the NMJ in the GG of Lepob/ob males, we examined the ultrastructural organization of the NMJ using TEM to gain a more detailed understanding of the extent of these defects at the subcellular level. GG muscles from Lepob/ob and age-matched control males were dissected, processed, and imaged in the TEM (Fig. 6). Qualitative analysis of the NMJs revealed structural abnormalities in Lepob/ob male compared to wt male mice. Lepob/ob male exhibited NMJ characterized by shallow junctional folds with a smaller number of synaptic cleft openings (Fig. 6 d-f). These overly simplified junctional folds corresponds with a reduced density of AChRs, suggesting that impaired post-synaptic architecture may limit receptor clustering [56].
Fig. 6
Transmission electron microscopy images of GG NMJs from wild-type and Lepob/ob male mice. a Representative TEM micrograph of an NMJ from a wild-type male mouse showing numerous, well-structured junctional folds. b The same NMJ as in (a), magnified. c A different NMJ from a wild-type male mouse. The junctional folds are distinctly observable in the postsynaptic compartment. d Representative TEM micrograph of an NMJ from a Lepob/ob male mouse. e–f Higher magnification images of the boxed region shown in (d) reveal less numerous and shallower junctional folds than those in wild-type NMJs. JF, junctional folds; M, mitochondrion; V, synaptic vesicles; NT, nerve terminal; MN, myonucleus. Original magnification. a, 4800x; b and c, 18500x; d, 6800x; e and f, 18500x
Given the instability of AChRs in the NMJs of leptin-deficient male mice, it was plausible that the motor nerve terminals above these sites could also be compromised. Since Schwann cells ensure proper synaptic function by continually remodeling nerve terminals throughout the lifetime of the synapse [57], we speculated whether this presynaptic component might also be affected. To explore the presynaptic apparatus, fixed GG muscles from both leptin-deficient and control mice were incubated with an antibody against neurofilament to stain axons, an antibody against nerve terminals, and an antibody against Schwann cells alongside BTX-Alexa594 to label acetylcholine receptors (AChRs). A thorough analysis of the NMJs using a confocal microscope revealed healthy axons and nerve terminals, with the expected precise alignment between the presynaptic and postsynaptic apparatus in the NMJs of both wild-type male and female mice, as well as leptin-deficient females (Fig. 7 A-C). In contrast, the GG muscle of leptin-deficient males showed numerous postsynaptic sites that were partially occupied by axon branches, leaving some AChR sites without innervation and seemingly undergoing elimination (Fig. 7 E–G). Quantification of the percentage of partially innervated NMJs, where AChR-rich postsynaptic sites were only partially occupied by axon terminals, showed that 11% of synapses were partially innervated in wt male mice, compared to 46% in Lepob/ob male mice (N = 3–4 mice per group; p < 0.0001, Two-Way ANOVA) (Fig. 7 I). A qualitative assessment revealed additional NMJ abnormalities in Lepob/ob male mice: several NMJs had nerve sprouts extending from the nerve terminals beyond the postsynaptic region (Fig. 7 E) or were innervated by more than one axon (Fig. 7 E, F). Some axons appeared swollen, and thinning of terminal axons was also noted in certain NMJs (Fig. 7 D). In cases of fragmented synapses, the terminal axons appeared varicose, resembling aging NMJs (Fig. 7 D, H). Additionally, glial cell sprouting was observed, with Schwann cells extending processes beyond the endplate (Fig. 7 G).
Fig. 7
The presynaptic apparatus is altered in Lepob/ob male mice. A-H Representative confocal images of NMJs in GG muscles of wild-type and Lepob/ob mice. The nerve, terminal Schwann cells, and postsynaptic receptors are labeled. A NMJ of wild-type male mouse. B NMJ of wild-type female mouse. C NMJ of Lepob/ob female mouse. Panels A-C show synapses with single innervation, where the nerve terminal entirely overlaps the postsynaptic AChRs, and the Schwann cell covers the endplate. D-H Representative confocal images of NMJs in GG muscles of Lepob/ob male mice. D Confocal image showing two neuromuscular junctions (NMJs). In the left NMJ, postsynaptic acetylcholine receptors (AChRs) are unevenly distributed, showing signs of partial synaptic disassembly, with clusters of receptors detached from the NMJ. Red arrows indicate axonal thinning. The right NMJ is innervated by a varicose nerve terminal. E NMJs showing dual innervation (white arrow), axonal sprouting (blue arrowheads), and partial denervation (white arrowheads). Note the insufficient coverage of the endplate by Schwann cells. F NMJ showing dual innervation (white arrow), with two axon terminals innervating different synaptic regions (yellow arrowheads), partial denervation (white arrowheads), and partial coverage of the endplate by Schwann cells. G NMJ showing partial denervation (white arrowhead) and terminal Schwann cell sprouting (blue arrows). H The axon terminal reaches the synaptic site and forms two branches (yellow arrowheads). Scale bar = 10 µm. I Quantification of partially innervated NMJs revealed a fourfold increase in Lepob/ob male mice compared to wild-type male mice. Data were analyzed using a two-way ANOVA, F (1, 8) = 60.89, p < 0.0001; N = 3–4 mice per group
Neuromuscular Junction of other muscles of Lep ob/ob MiceTo determine whether the NMJ abnormalities observed in the GG muscle are muscle-specific or indicative of a broader neuromuscular phenotype in leptin-deficient obesity, we extended our analysis to two anatomically and functionally distinct muscles: the sternomastoid (ST) and diaphragm (DIA) muscles. These muscles were selected for analysis because they differ in anatomical location and functional roles, yet both are relevant to respiratory and upper airway control. The DIA is the primary muscle responsible for breathing, while ST muscle is an accessory muscle of respiration. Like the GG, the ST is predominantly composed of fast-twitch fibers, and its superficial location makes it amenable to dissection and analysis. Twenty-week-old wt and Lepob/ob mice were euthanized, and ST muscles were extracted, cryosectioned, and stained with H&E to assess the cross-sectional area (Fig. 8 A, B). No differences were found in myofiber cross-sectional areas between wt and Lepob/ob male mice (wt: 1333 ± 146 μm2, N = 4 mice; Lepob/ob: 1366 ± 96 μm2, N = 4 mice, p = 0.12). In contrast, Lepob/ob female mice exhibited a larger cross-sectional area than wt female mice (wt: 1320 ± 52 μm2, N = 4 mice; Lepob/ob: 1499 ± 132 μm2, N = 4 mice, p = 0.045). In the minimum Feret diameter quantification, wt male mice showed no differences in diameter compared to Lepob/ob males (wt: 34 ± 1.74 μm, N = 4 mice; Lepob/ob: 34.43 ± 1.1 μm, N = 4 mice, p = 0.9) (Fig. 8 B). In contrast, Lepob/ob females exhibited greater minimum Feret diameter than wt females (wt: 33.17 ± 1.4 μm, N = 4 mice; Lepob/ob: 38.55 ± 2.63 μm, N = 4 mice, p = 0.012) (Fig. 8 B). No histopathological abnormalities were found in either wt or Lepob/ob male or female mice, as their muscle fibers were densely arranged and lacked central nuclei or split muscle fibers.
Fig. 8
Sternomastoid (ST) and diaphragm (DIA) muscles in Lepob/ob mice. A Representative cross-sectional images of the ST muscle from 20-week-old wild-type and Lepob/ob male mice (left), and 20-week-old wild-type and Lepob/ob female mice (right) are shown at × 20 magnification. Scale bar = 50 µm. B Quantification of muscle fiber cross-sectional area (CSA) and minimal Feret’s diameter from H&E-stained ST muscle sections for each group. C Representative NMJ confocal images in the ST muscle from wild-type and Lepob/ob male mice. D Quantification of NMJ fluorescent intensity (left) and synaptic area (right) in ST muscle from wild-type and Lepob/ob male mice. Values are presented as mean ± SD. E Representative NMJ confocal images from the ST muscle of wild-type and Lepob/ob female mice. F Quantification of NMJ fluorescent intensity (left) and synaptic area (right) in the ST muscle of wild-type and Lepob/ob female mice. Values are presented as mean ± SD. G Representative NMJ confocal images from the DIA muscle of wild-type and Lepob/ob male mice. H Quantification of NMJ fluorescent intensity (left) and synaptic area (right) in DIA muscle of wild-type and Lepob/ob male mice. Values are presented as mean ± SD. I Representative NMJ confocal images from the DIA muscle of wild-type and Lepob/ob female mice. J Quantification of NMJ fluorescent intensity (left) and synaptic area (right) in DIA muscle of wild-type and Lepob/ob female mice. Values are presented as mean ± SD. Statistical significance was assessed using the Mann–Whitney U test (*p < 0.05; ns = not significant). Data were collected from at least four mice per group. Scale bar = 10 µm
To analyze the NMJs of ST muscles, we fixed ST muscles from four groups of mice and labeled the postsynaptic AChRs with BTX-Alexa488. The NMJs were then imaged using a confocal microscope. High-resolution images revealed no differences in NMJ morphology or AChR distribution between wt and Lepob/ob male mice (Fig. 8 C), or between wt and Lepob/ob female mice (Fig. 8 E). Notably, AChRs were highly concentrated in the synaptic gutters, and no synaptic disassembly was observed, unlike the disrupted NMJ architecture previously found in the GG muscle of Lepob/ob male mice.
To analyze the density of the AChRs at the synapse, we labeled ST muscles with a saturating dose of BTX-Alexa488 to label all postsynaptic AChRs. The NMJs were imaged using the Nikon Eclipse Ti2-E inverted fluorescence microscope, and the fluorescence intensity of labeled AChRs was measured and expressed as a percentage of the fluorescence of the wild-type synapses. We found no differences in the density of postsynaptic AChRs in the ST muscle of male mice (wt: 100 ± 5%, n = 70 NMJs, N = 5 mice; Lepob/ob:103.4 ± 5.3%, n = 76 NMJs, N = 5 mice, p = 0.57) or female mice (wt: 100 ± 4.9%, n = 83 NMJs, N = 5 mice; Lepob/ob: 99.5 ± 8.8%, n = 84 NMJs, N = 5 mice, p = 0.95) (Fig. 8 D, F). As shown in Fig. 8 D, there were no significant differences in the synaptic area between wt and Lepob/ob male mice (wt: 865 ± 115 μm2 SD, n = 70 NMJs, N = 5 mice; Lepob/ob: 867 ± 142 μm2 SD, n = 76 NMJs, N = 5 mice, p = 0.98) or between wild-type females and Lepob/ob female mice (wt: 865 ± 66 μm2 SD, n = 83 NMJs, N = 5 mice; Lepob/ob: 826 ± 64 μm2 SD, n = 84 NMJs, N = 5 mice, p = 0.37) (Fig. 8 F).
The same analysis described above was performed on the DIA muscle, revealing a pattern similar to that observed in the ST muscle. Histological analysis of the DIA muscle showed no histopathological abnormalities in either wt or Lepob/ob male and female mice, indicating normal muscle morphology across all groups (Supplementary Fig. 5 A, B). Analysis of cross-sectional areas revealed significant differences in both male and female mice. In males, values were: 1095 ± 126 μm2 for wt mice and 1614 ± 99 μm2 for Lepob/ob mice (N
Comments (0)