Rat colony establishment, animal care and use
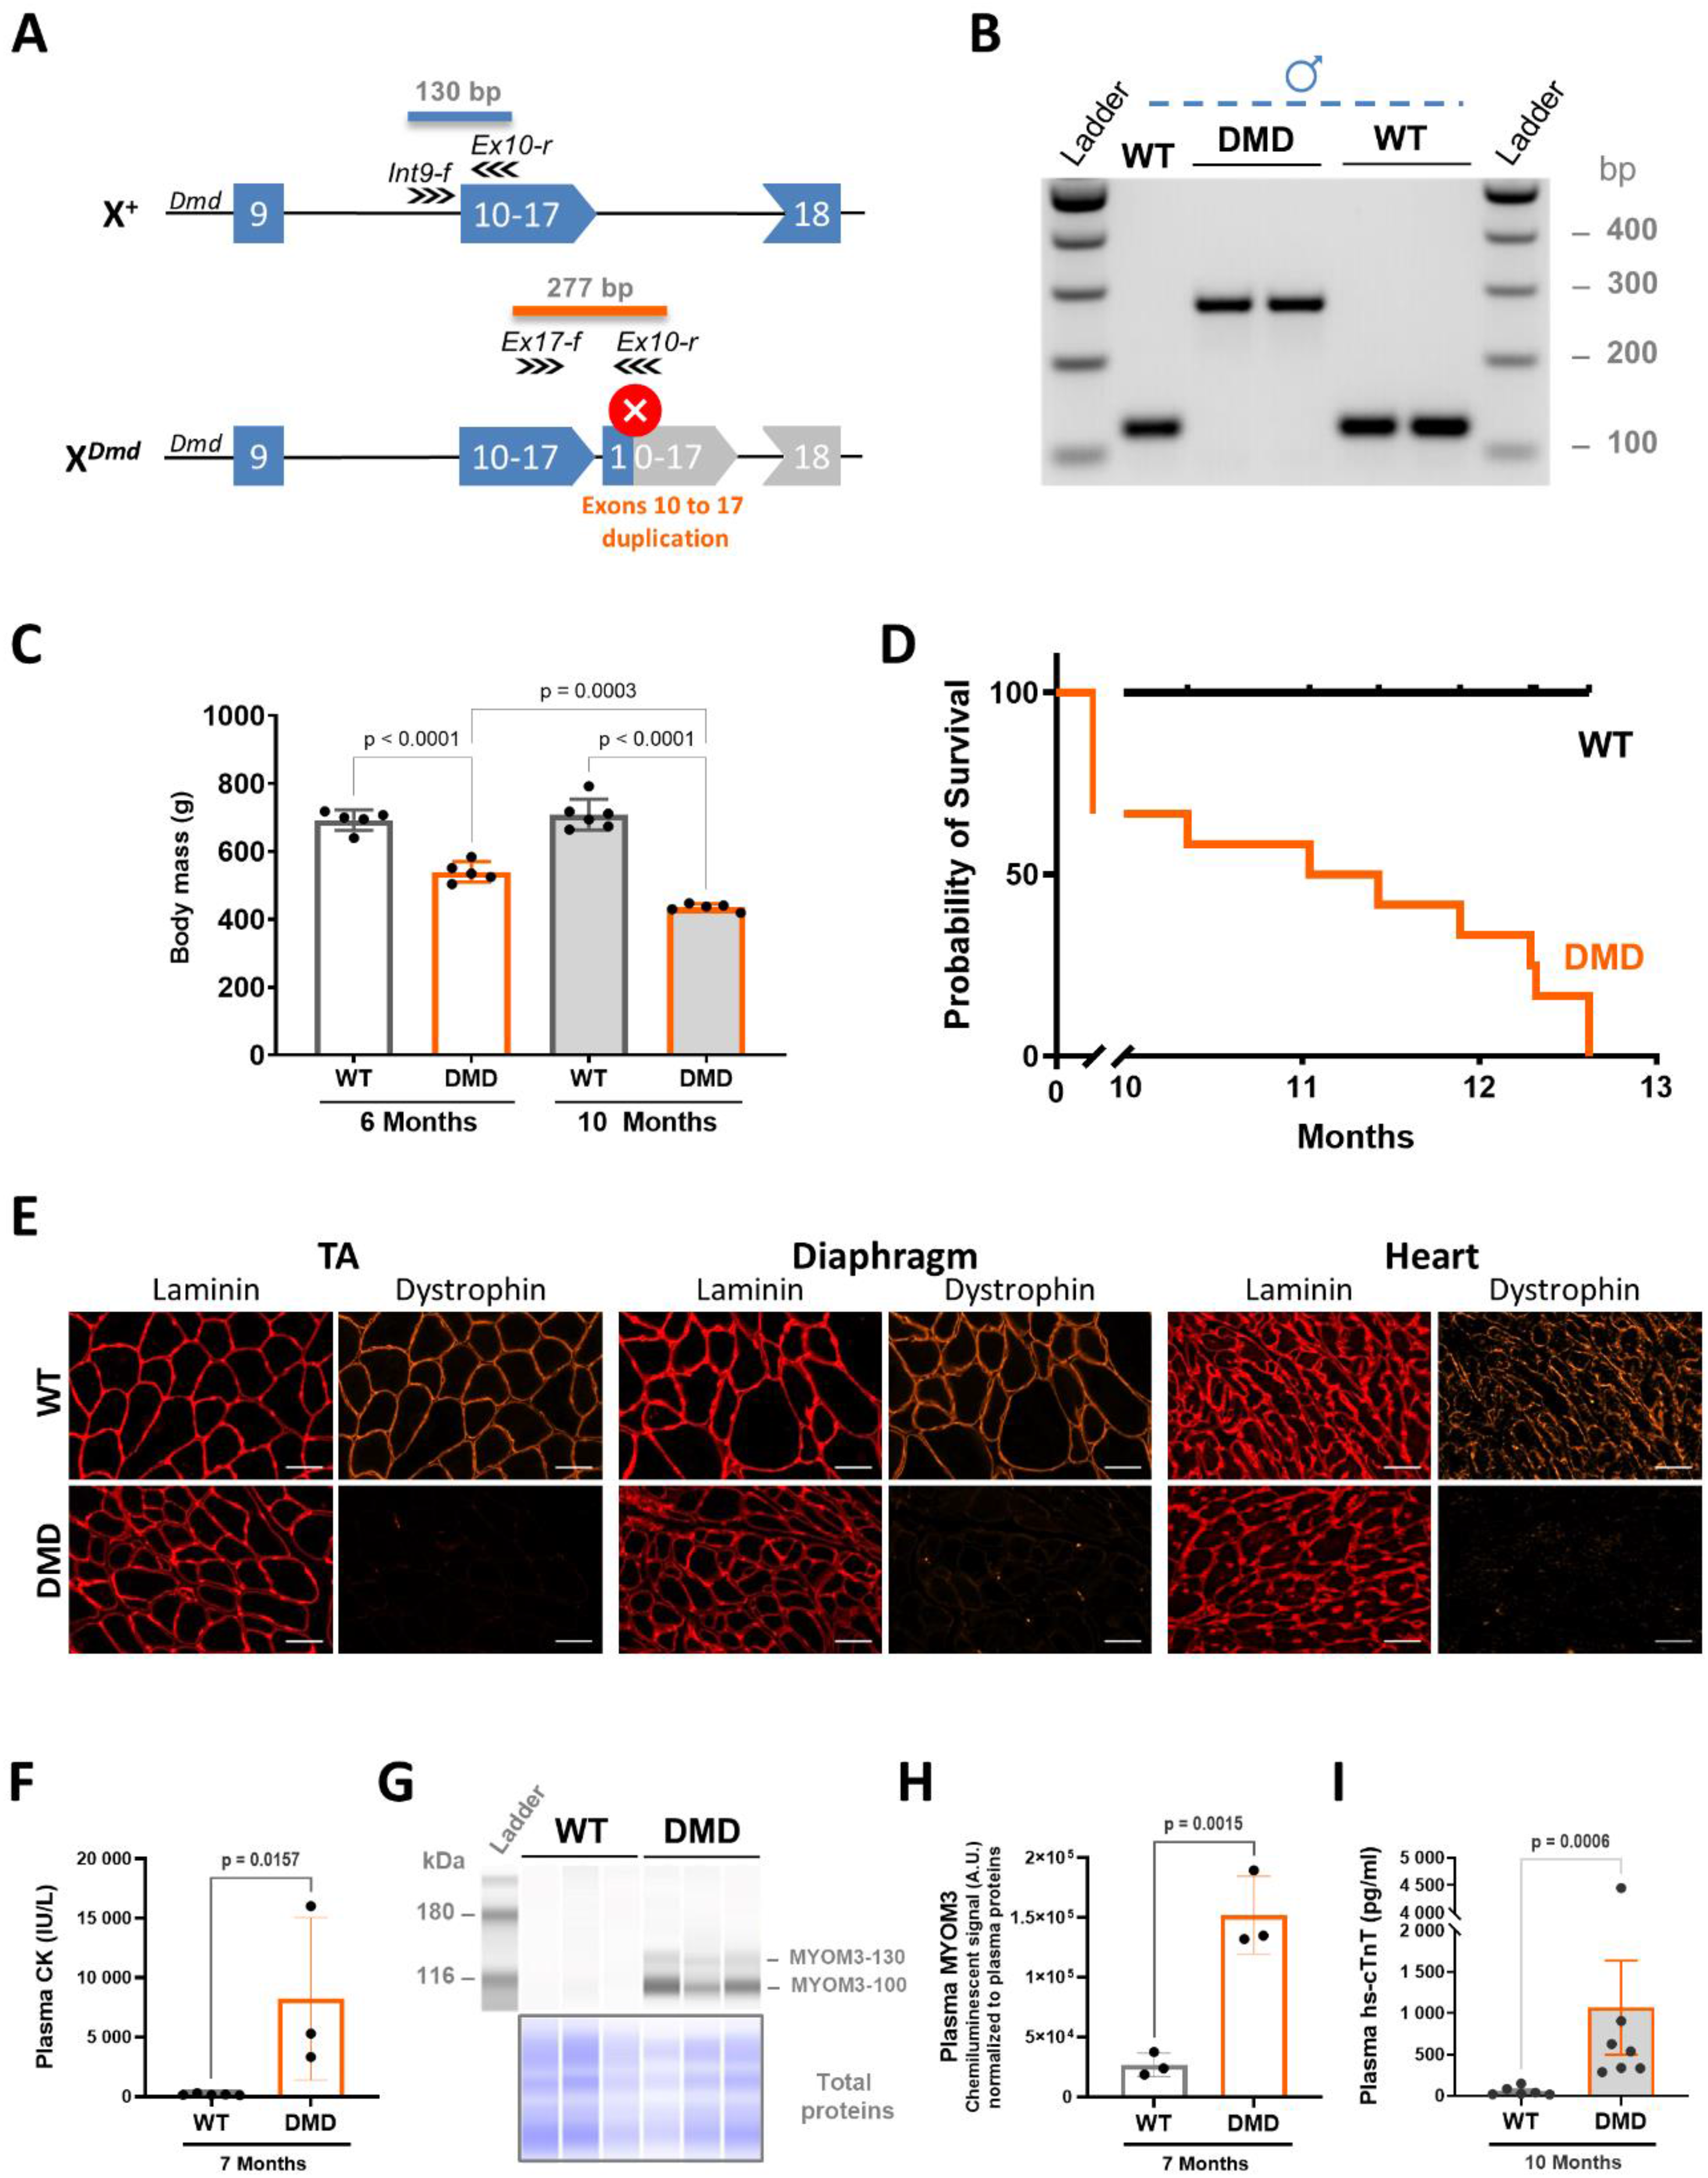
The R-DMD-dup10-17 rat model was generated by producing a duplication of exons 10 to 17 of the Dystrophin (Dmd) gene. Rat exonic and intronic sequences were selected (ENSRNOG00000035692.6) and CRISPOR algorithm [15] was used to identify guide RNA sequences (sgRNAs) for CRISPR mediated genome editing. A ~ 125 kb sequence encompassing exons 10 to 17 was duplicated using two 5’ sgRNAs in intron 9 at > 41 kb from exon 10: ATAAACCCAATGAACCATGC and TATATTCCTGCATGGTTCAT, combined with two 3’ sgRNAs in intron 17 at > 15.5 kb from exon 17: GAAGGAGCATTGGGGCATTA and ATAATGCTGGGAAGGAGCAT. The sgRNA number refers to the MIT specificity score (http://crispor.tefor.net/crispor.py). After duplication, splicing from splice donor of exon 17 to splice acceptor of the duplicated exon 10 was expected to produce an out-of-frame mutation leading to a premature stop codon in the duplicated exon 10. Fertilised oocytes from the Sprague Dawley strain (RjHan: SD provided by Janvier Labs, France) were electroporated with RNP dual RNA (6 µM Cas9 protein, and 8 µM of each sgRNA). Electroporated fertilised oocytes were reimplanted in foster females to obtain animals that were screened by junction genotyping. The duplication junction and two copies of the wildtype 10–17 region were confirmed in the F0-12235 male founder rat. Genotyping was performed on DNA extracted from ear biopsies. PCR mix was prepared with Phusion Taq buffer (Invitrogen), 0.25 mM dNTP, 0.6 µM of the common Ex10-r reverse primer 5’-ATAAGTATTAGGCCATTGTTCAAGG-3’ and 0.3 µM of each of the Int9-f forward primer 5’-ACCCAATGAACCATGCAGGA-3’ for amplifying the wild-type (WT) allele and the Ex17-f primer 5’-TGTTGCTCATTCACTATATGTATGG-3’ for amplifying the R-DMDdup10-17 (DMD) allele, 0.03 U/µl Phusion Taq and around 150 ng of DNA. The PCR was performed with the following program: initial denaturation at 95 °C for 3 min, 33 cycles with denaturation step at 94 °C for 15 s, annealing at 56 °C for 45 s and extension at 72 °C for 10 s, ending with a unique final extension at 72 °C for 3 min. Duplication of exons 10 to 17 (277 bp) was detected on a 2% agarose gel.
Rats were housed in a pathogen-free facility with 12 h light/dark cycles in accordance with the 2021/63/EU European Directive. Only male rats were used for the experiments. Both wild-type and DMD rats were born from the same litters. All the procedures including animal handling were validated by the local ethic committee and approved by the French ministry of Research (APAFIS#44858-2023091920248268). The general condition of the rats was checked daily to record the onset of physical deterioration, which usually occurred around 10 months of age. Limits points were established and constantly evaluated by daily observing the animals individually, including weekends and public holidays. Should the limit points be exceeded, corrective action was taken, and in the event of no benefit (irreversible progression of the disease), we proceeded to compassionate euthanasia of the animals.
Functional assessment of animalsGrip test
Forelimb grip strength was assessed using a grip strength meter (BIO-GS3, Bioseb). Animals were positioned to grasp the T-bar with their forelimbs, then pulled backwards until they released the grip. A total of five repetitions were recorded, with a minimum of 10 min of rest in the rearing cage between two consecutive trials. The maximal force of each rat was corrected for individual TL3 following the methodology described above, while the force maintenance index (FMI) was calculated as the average of the last three measurements expressed as a percentage of the maximal force.
In vivo muscle electrophysiology
An in vivo muscle contraction test was performed using the 1300 A 3-in‐1 Whole Animal System (Aurora Scientific, Aurora, ON, Canada) and analysed using the dynamic muscle control/analysis (DMC/DMA) high‐throughput software suite provided by the manufacturer. Rats were weighed and placed under moderate anaesthesia with a mixture of 0.03 mg/kg Bupaq (Virbac), 0.2 mg/kg Sedator (Dechra) and 50 mg/kg Ketamine 1000 (Virbac) administered subcutaneously. After 30 min, the animals were placed dorsally on the device with foot and knee secured. The tibialis anterior (TA) was stimulated subcutaneously with 0.1 ms supramaximal square-wave pulses at increasing frequencies (10, 20, 30, 40, 50, 60, 80, 100, 120, 140 Hz) to establish the force-frequency relationship. Maximal isometric tetanic force was determined by plateauing the force-frequency relationship. The maximal force was corrected by the TA mass. Next, TA muscle fatigue was assessed by repeated tetanic contractions of 0.1 ms duration and 120 Hz frequency. A total of 20 contractions were performed and the force maintenance index was calculated as the last contraction value, expressed as a percentage of the maximal force measured.
Spontaneous locomotion test
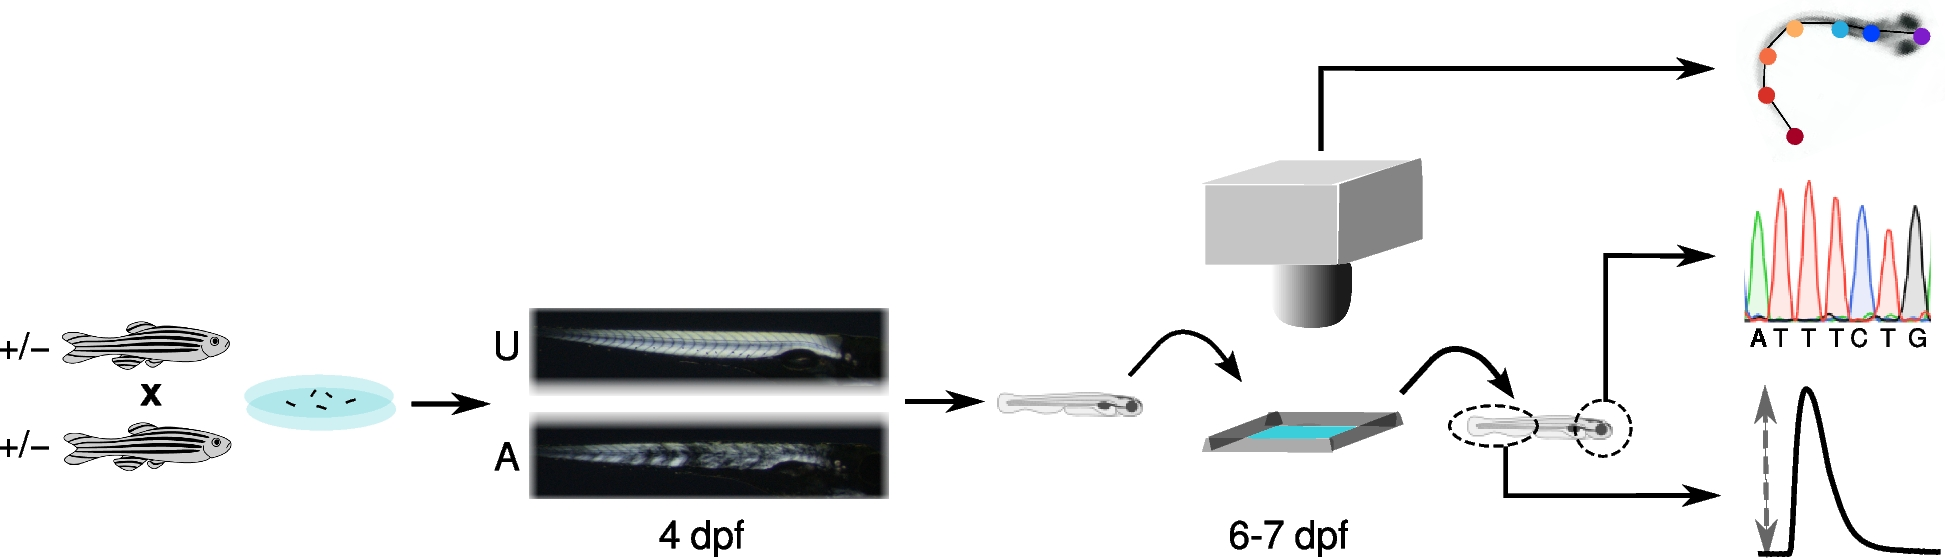
Spontaneous locomotion of R-DMDdup10-17 rats and their healthy wild-type littermates was assessed using a 6,000 cm2 observation roofless exercise cage, equipped with a camera filming from the top of the cage. This cage provided a spacious environment for spontaneous exploration, containing various features such as water and food dispensers, a shelter, an elevated mezzanine (mezza) and a ladder from the floor to the mezzanine. An automated artificial intelligence-based video monitoring software (EthoVision XT, Noldus, the Netherlands) was then used to assess rats’ locomotion and routine behavioral parameters. The system extracted metrics including the time spent in specific zones, the distance travelled, the average ground speed, and the number of successful climbs to the mezzanine (center point of the rat reaching the mezzanine).
Whole-body plethysmography
Respiratory capacities were evaluated using a whole-body plethysmograph (Emka Technology) on awake, unsedated animals. Each rat was placed in a calibrated cylindrical chamber at room temperature (RT). After 10 min of acclimatization, data were recorded for at least 15 min and analysed with the IOX software. Peak inspiratory (PIF) and expiratory (PEF) flow represented the maximal negative and positive recorded value.
Electrocardiography (ECG) analyses
Electrocardiograms were recorded on awake, unsedated rats using telemetry with skin patches and a battery-powered sensor worn in a jacket (rodent PACK, Emka Technologies). Two electrodes were placed on shaved and depilated skin, one dorsally in the cranial interscapular region and the other ventrally, in the region of the xiphoid appendix. The skin patches and vest were left on the animals for a 10-min habituation period into the rearing cage. Then, recording began for 10 to 20 min, corresponding to around 6,000 cardiac cycles. Data were analysed by the “Averaged beats analysis” plugin of the ECGavg software (v2), codeveloped with Emka [16]. To exclude the putative interference of the sympathetic nervous system hyperactivation during the acute phase of the stress response, we selected for each rat cycles between the lowest heart rate and up to 10% higher, which corresponded to the resting heart activity. The isoelectric line was defined as the TP segment; the end of the S wave was defined as the intersection between the trace and the isoelectric line, or in the case of a notched T wave (DMD rats), as the point of return to horizontal (J point). The corrected QTpeak value (QTpc) was calculated using the following modified Bazett’s formula: QTpc = QTpeak/(RR/f)1/2, derived from a previous study [17], with f equal to the mean RR interval calculated for each rat.
Blood biomarkersPlasma collection
All rats were anesthetised with the mixture described in the “In vivo muscle electrophysiology” section. After 30 min of induction, blood samples were taken from the retro-orbital sinus and collected in tubes containing lithium heparinate. Plasma was obtained by centrifuging tubes at 3000 rcf for 15 min at 4 °C, and was then aliquoted for immediate use or storage at -80 °C.
Quantification of plasma biomarkers (CK, MYOM3 and hs-cTnT)
CK plasma concentration was obtained with the Catalyst DX analyzer (IDEXX), following the manufacturer’s recommendations. If necessary, sera were diluted in NaCl, first 1/3, then 1/6, and 1/10 for the highest values. MYOM3 plasma concentration was obtained with the SimpleProtein Jess analyzer (BioTechne) using the regular 12–230 kDa kit, the polyclonal anti-MYOM3 antibody (ProteinTech #17692-1-AP, 1:2000) and the anti-rabbit HRP (ProteinSimple). Plasma were loaded at dilution 1:50 and the separation voltage was 375 V. All MYOM3 signal intensities were normalised to the individual total protein load, which was determined via Total Protein RePlex assay as per the manufacturer’s instructions. The high-sensitivity cardiac troponin T (hs-cTnT) plasma concentration was obtained with the hs-cTnT assay run on a Roche cobas 8000 analyser® E801, following the manufacturer’s recommendations.
Histological analysesMuscle collection, freezing and storage
After blood collection, anaesthetised rats were then killed by exposure to carbon dioxide on a standardised cycle of 3 min to reach 40%, then a further 2 min to 70% carbon dioxide and a 10-min holding period in a 48 L CO2 chamber (Minerve). Muscles (Tibialis anterior, Extensor digitorum longus, Gastrocnemius, Soleus, diaphragm and heart) were dissected and harvested for histology. Each muscle was sealed in Tragacanth gum (Sigma Adrich) placed on a piece of cork and frozen in isopentane maintained at -140 °C by liquid nitrogen before being stored in a freezer at -80 °C until use. Transverse cryosections were obtained using a cryostat (Leica) and used for histological analysis and immunofluorescence.
Haematoxylin-eosin staining and pathological index quantification
Cryosections were stained with 0.1% Mayers hematoxylin (Sigma Aldrich) for 10 min, then counterstained with 0.5% eosin (Sigma Aldrich). After washing with distilled water, the sections were dehydrated in 50%, 70%, 95% and then 100% ethanol, before being incubated in xylene and mounted in Canada balsam. Photographs were taken using a ZEISS Axioscan 7 microscope, and images were analysed by Visilog (V6.4, Noesis). The pathological index was calculated as the proportion of events not corresponding to normal shape fibres as previously described [18].
Sirius red staining and fibrosis quantification
Frozen tissue sections were fixed for 30 min in 0.4% PFA. After washing with distilled water, sections were incubated with Sirius Red (Sigma Aldrich) for 10 min and counterstained in fast green for 4 min at RT. After a second wash with distilled water, the sections were dehydrated in 50%, 70%, 95% and then 100% ethanol, before being incubated in xylene and mounted in Canada balsam. Photographs were taken using ZEISS Axioscan 7, and images were quantified by Visilog (V6.4, Noesis) as relative area of fibrosis.
Immunofluorescence labelling of frozen sections and imaging
Cryosections were dried for at least 30 min, then rapidly rehydrated in PBS before being blocked in 10% BSA (Bovine Serum Albumin) for 45 min at RT. Slides were then incubated with primary antibodies raised against laminin (Sigma Aldrich, L9393) and dystrophin (Leica, NCL-DYS1). All antibodies were diluted in 0.1% BSA and incubated overnight at 4 °C. Slides were then exposed to Alexa Fluor secondary antibodies for 1 h at RT, rinsed, stained with Hoechst (Sigma Aldrich), and mounted with Fluoromount-G Mounting Medium (Invitrogen). Images were acquired using a fluorescence microscope (ZEISS Axioscan 7).
Data analysisCorrection of inter-individual variability caused by growth disparities
Because DMD is a dystrophic myopathy whose progression is accompanied by massive muscle atrophy, the classical correction of values for inter-individual variations in growth rate by the body weight (BW), which depends mainly on the total mass of striated muscles, cannot be applied. Instead, we used an optimised version of the methodology initially developed by Hagdorn et al. for cardiovascular disease, who proposed using the cubic value of tibia length (TL3) as a reference for bone growth [19]. This tibia length is cubed to comply with the mathematical principle that mass reflects a volume rather than a linear dimension. We applied this method to our data and first demonstrated in WT rats of our Sprague Dawley line that correction solely by TL³ yielded homogeneous (statistically unsignificant) TA muscle mass values, irrespective of individual growth (Fig. S1A). By contrast, correction by the total body mass or the uncubed tibia length failed to eliminate these discrepancies (Fig. S1A), underlining the robustness of a biologically and mathematically appropriate correction. The accuracy of this correction has also been extended by taking the example of the testis, an organ whose morphology is visibly unaffected by the dystrophic phenotype (Fig. S1B). The standard correction of testis mass by total body mass shows that it was abusively increased in DMD rats (Fig. S1C). In contrast, correction by the TL3 value abolished this over-correction and confirmed the absence of any significant difference between DMD rats and their WT littermates (Fig. S1D).
Thus, organ weight data or strength values were corrected on tibia length (TL3), using correction parameters that we had previously calculated in WT animals for each variable, allowing to calculate linear regression between TL3 and the corresponding variable. This normalization was then completed to obtain a post-correction of the scale that considered the growth of the animals in the longitudinal study. The final formula was the following:
$$\:Individual\:corrected\:variable=\:$$
$$\eqalign \over } \times \cr ( - X - intercept\;of\;corrector\; + \;subgroup\;median\;of\;corrector) \cr} $$
X-intercept was calculated from linear regression between the corrector and the considered variable to correct. Corrector was set as TL3. Subgroup was defined by the different time points where animals had been analysed (i.e. at 6 months and 10 months). To keep the last argument a constant for the specified time point, the median was calculated for the pooled rats, whatever their status (WT or DMD).
Statistical analyses
All experiments were analysed using GraphPad Prism v9 or v10. Depending on the results of the Shapiro-Wilk test assessing the normality of the data distribution, we used parametric or non-parametric tests for comparisons. With exceptions specifically mentioned in Figure legends, all the non-parametric data were analysed using the Kruskal-Wallis test followed by Dunn’s post-hoc, and parametric data were analysed using an ordinary one-way ANOVA followed by Sidak’s post-hoc to specifically compare data obtained at 6 months (WT vs. DMD), 10 months (WT vs. DMD) and the DMD progression (10 months vs. 6 months). Graph data are presented as mean and standard deviation, with each point representing a single biological repeat. All significant differences are shown in the graph as two-tailed p-values, with critical alpha set at 0.05.

Comments (0)