Human samples
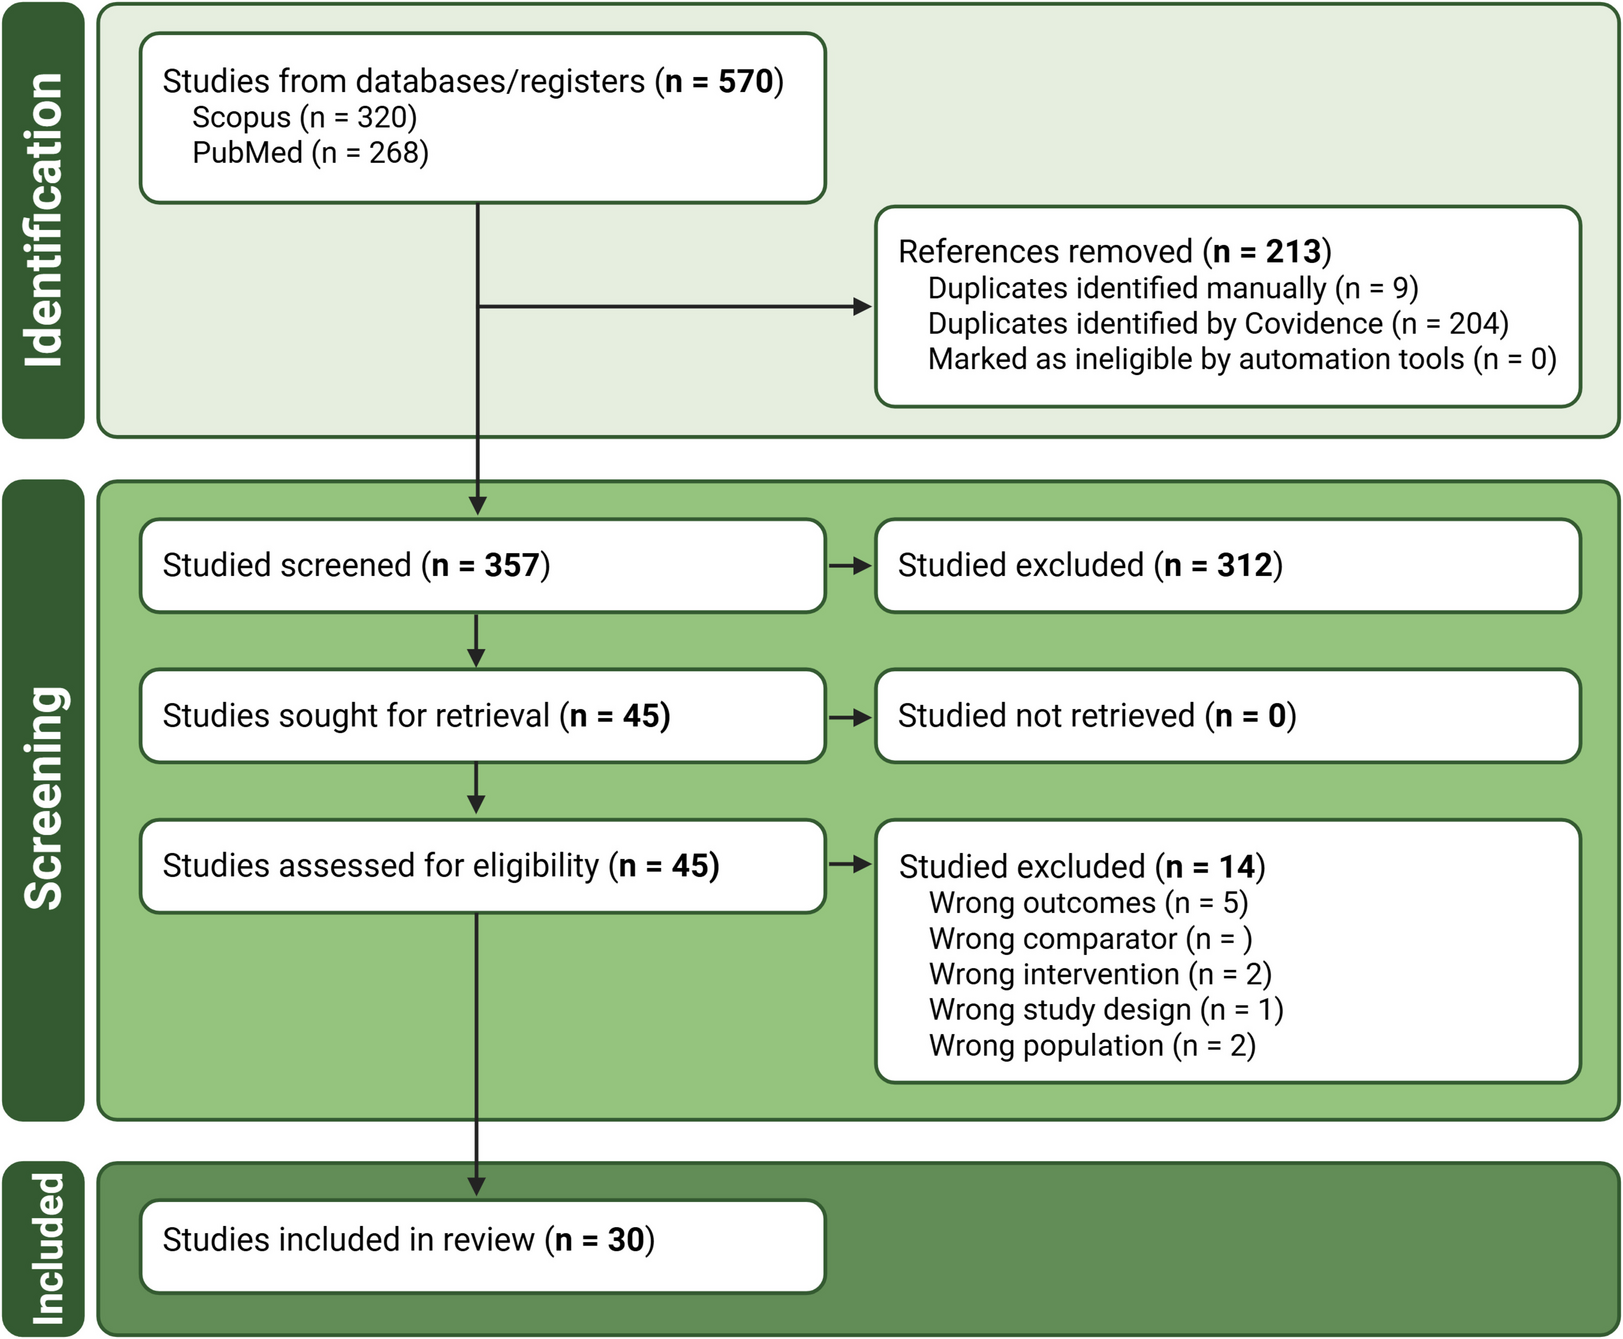
Stool samples were collected from 30 individuals, including 15 POAG patients and 15 healthy controls. The two groups were matched in terms of age, gender, BMI, geographic location (all from the middle-lower Yangtze Plain in China), ethnicity and diet (traditional Chinese diet, primarily consuming refined grains). Serum samples were collected from POAG and age-/sex- matched cataract patients (offer ethical feasibility while exhibiting distinct pathological mechanisms from glaucoma). This project was approved by the Medical Ethnics Committee of Shanghai Ninth People’s hospital, Shanghai Jiao Tong University School of Medicine (No. SH9H-2021-T184-2). All participants provided written informed consent, and the protocol followed the principles of the Declaration of Helsinki. The diagnostic criteria for POAG are as follows: (1) IOP > 21mmHg in the affected eye at the initial diagnosis; (2) Excavation of optic disc: progressive increase of C/D ratio, C/D ratio > 0.5, or asymmetry of C/D ratio in eyes (≥ 0.2); (3) Visual field (MD value) changes: Characteristic glaucoma visual field defects consistent with ocular fundus examination; (4) open angles: Shaffer grade 3 and above. The following conditions will be excluded: (1) Use any of the following drugs: proton pump inhibitors, antidepressants, metformin, insulin, glucocorticoids, etc.; (2) Use of systemic (oral, intravenous, etc.) or ocular topical (eye drops, ointments, etc.) antibiotics within the past 4 weeks; (3) Suffering from digestive diseases such as inflammatory bowel disease, irritable bowel syndrome, chronic diarrhea, chronic constipation, etc.; (4) History of gastrointestinal surgery; (5) Suffering from any of the following diseases: high blood pressure, diabetes, heart disease, liver disease, kidney disease, malignant tumor, etc.; (6) Patients with other eye diseases (such as diabetic retinopathy, uveitis and other diseases); (7) Pregnant women and patients with major underlying diseases (liver and kidney failure, malignant tumors, etc.). BMI (height/weight2) and dietary habits of all participants were also collected.
Fecal DNA extraction
Each participant was provided with a fecal collection kit to collect about 2 g of fresh morning stool samples. These samples were immediately stored at -80 °C until further processing. Total genomic DNA was extracted by QIAamp DNA stool mini kit. The quality of DNA was checked on a 1.2% agarose gel. Blank extraction controls using sterile water instead of fecal samples were processed alongside experimental samples in every extraction batch.
16 S rRNA sequencing and analysis
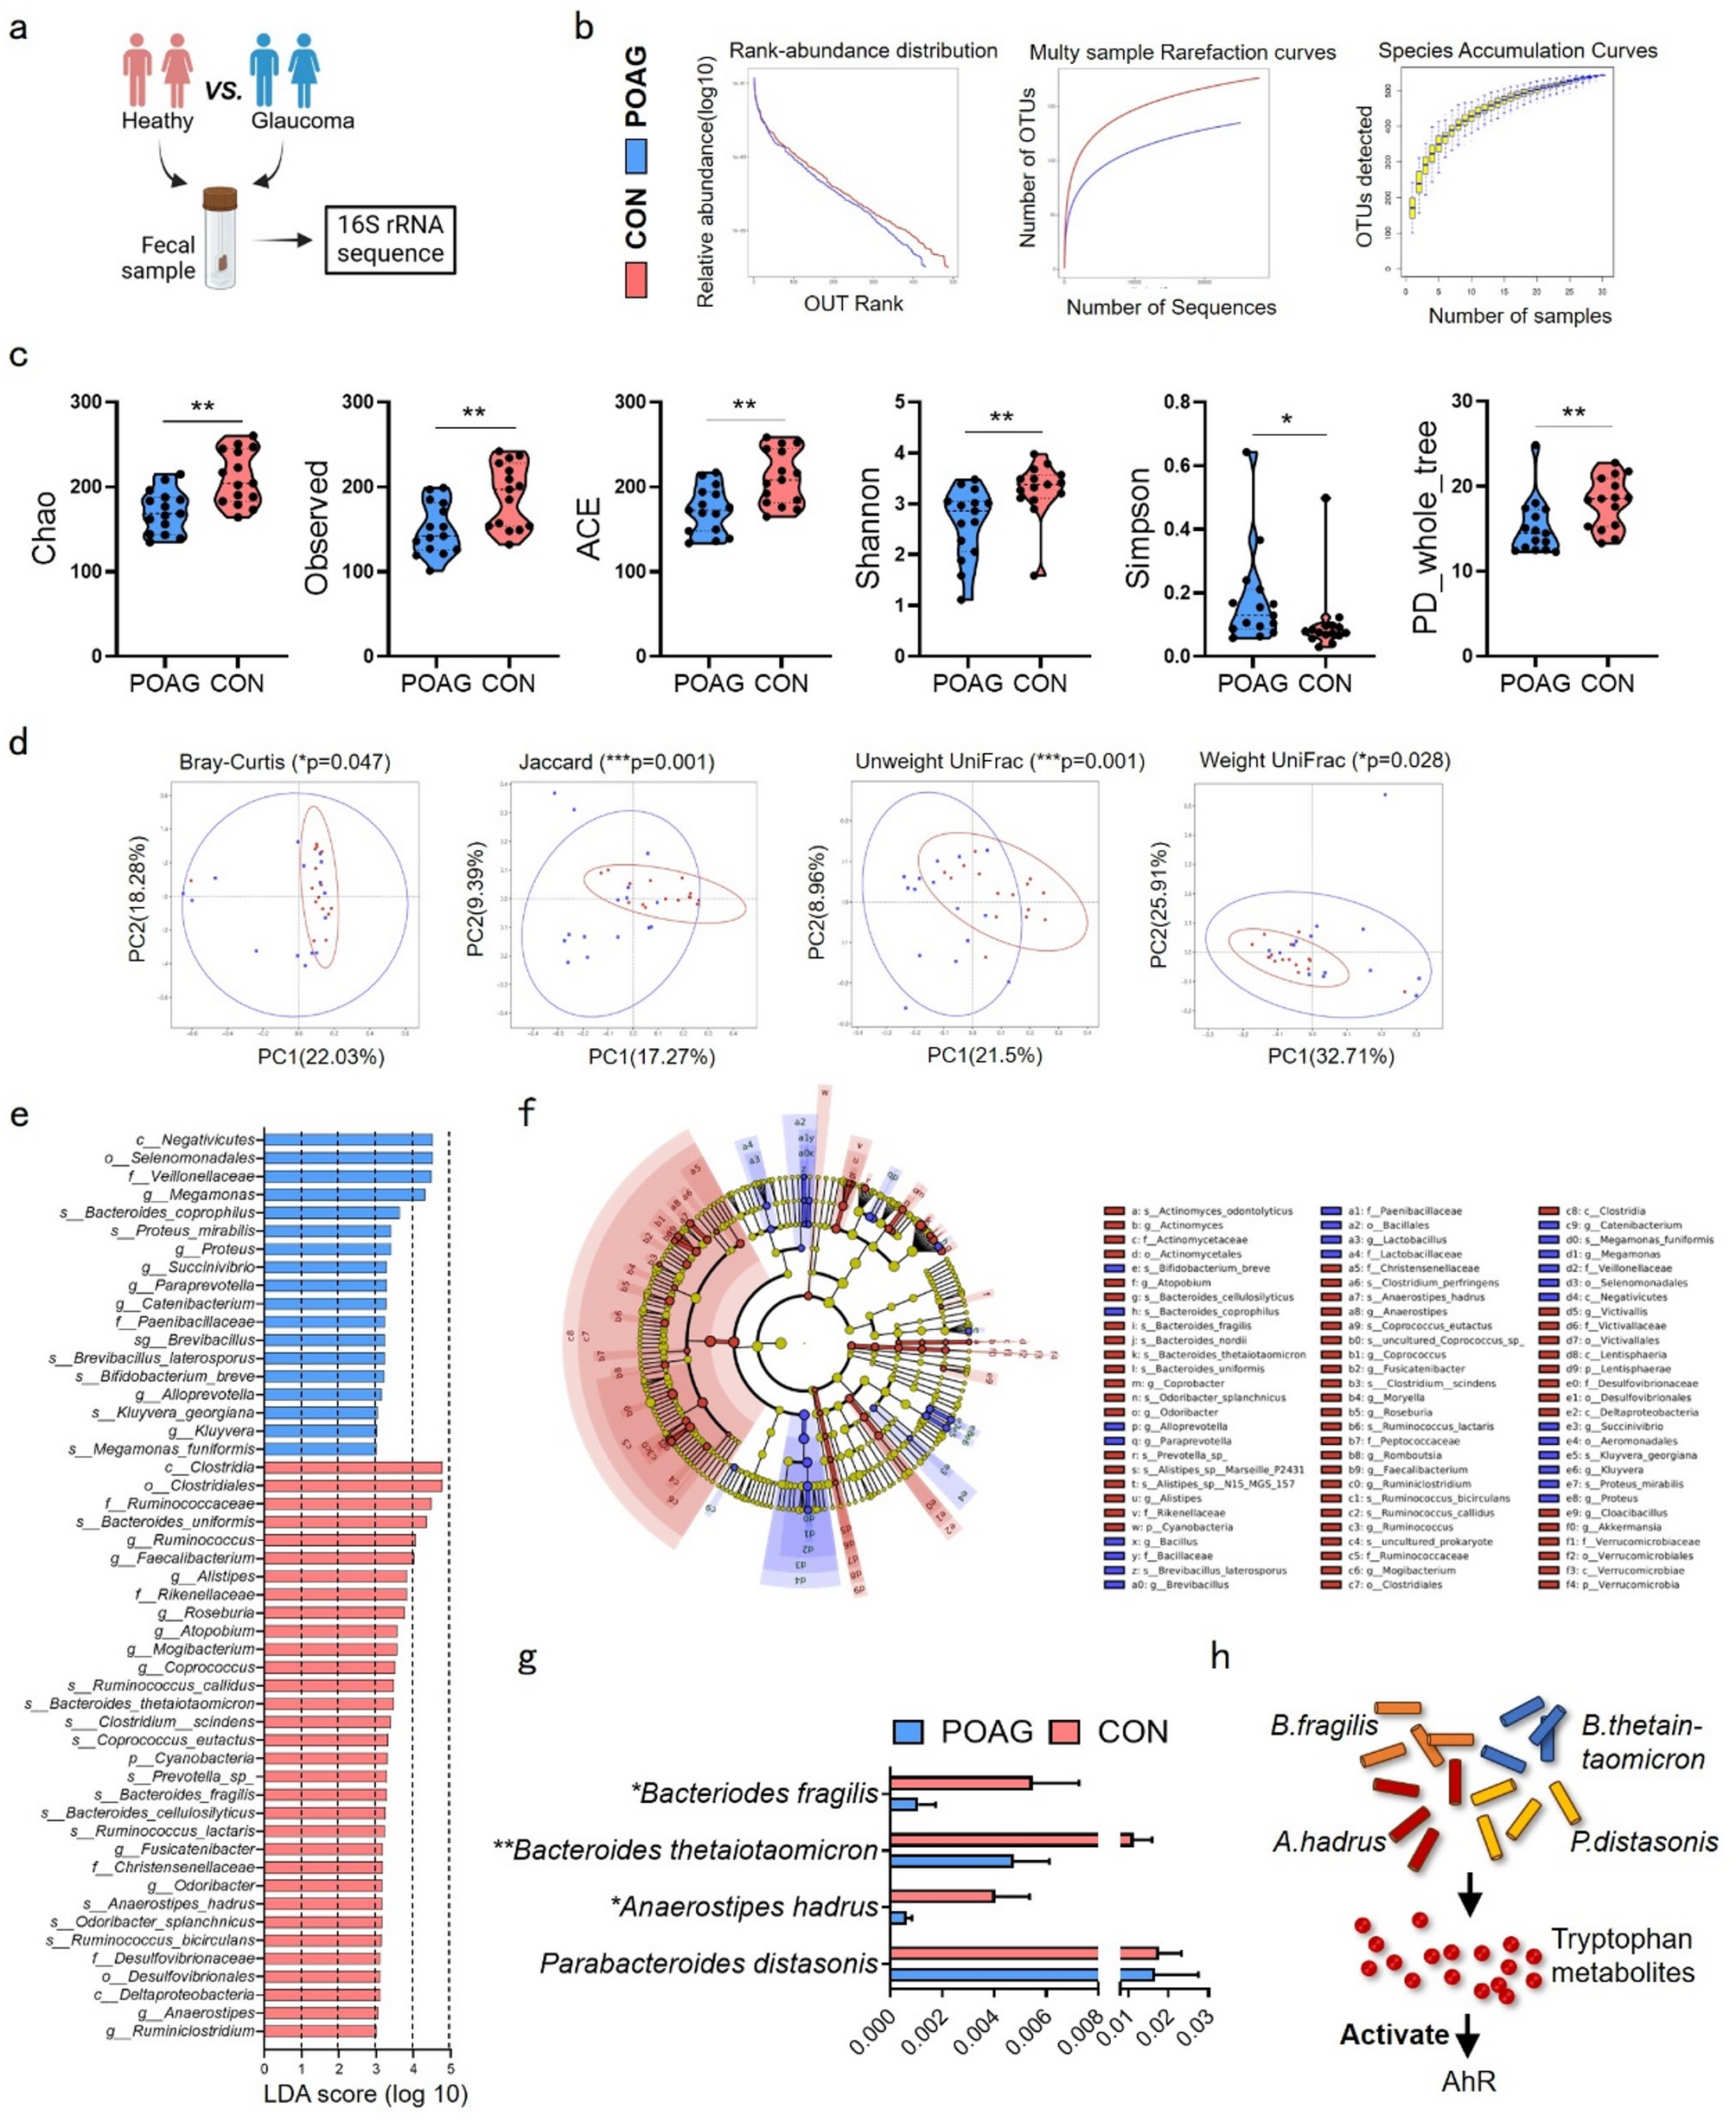
Bidirectional sequencing was performed according to illumina’s high-throughput sequencing requirements, and the V3-V4 region and fusion primer with a “5 ‘connector -barcode- sequencing primer - specific primer − 3’” were designed. The specific primers were 357F 5’-ACTCCTACGGRAGGCAGCAG-3’; 806R 5’-GGACTACHVGGGTWTCTAAT-3’. A two-step PCR amplification method was used to construct the library. First, the target fragment was amplified by specific primers, the target fragment was recovered by AxyPrepDNA gel recovery kit (AXYGEN), and the recovered product was quantified by FTC-3000TM real-time PCR instrument. The recovered products were then used as templates for secondary PCR amplification.
The multi-sample parallel sequencing method was used and barcode sequence containing sample source information was introduced to distinguish samples. The original sequence is divided according to Barcode information, and the complete barcode label sequence is considered as a valid sequence. Trimmomatic(version:0.38) software was used for sequence quality control, and cutadapt(version:1.16) software was used for sequencing connectors and primers. FLASH (version:1.2.11) software was used to splice pairs of reads into a sequence according to the overlap between PEreads. The minimum overlap length was 10 bp, and the maximum mismatch ratio allowed in the overlap area of the splicing sequence was 0.2. Flash (Version 1.2.11) and mothur (version:1.39.5) were used for sequence optimization after merge. The CleanTags processed above were OTU clustered, and then OTU species were classified by OTU annotation. USEARCH software was used to cluster the merged sequences into OTU. All sequences were classified into OTU, and the OTU at 97% similarity level was analyzed for biological information, including OTU analysis based on sequence similarity clustering, species taxonomic analysis, α diversity analysis, β diversity analysis, and inter-group difference analysis. For microbiomes sequencing data, GraphPad Prizm and R (3.6.0) were performed for analysis. Kolmogorov-Smirnov test was used for normal distribution. Non-parametric tests were used to analyze the demographic data of POAG patients and healthy controls. For data without normal distribution, Mann-Whitney test was used. The differences in the abundance of various microbiomes between the two groups were elevated by non-parametric Wilcox. Benjamini-Hochberg false discovery rate (FDR) adjust < 0.25 was defined as statistically significant cutoff.
Mice and MB-induced ocular hypertension model
All mice experiments were approved by the Committee of Animal Care of the Shanghai 9th People’s Hospital Affiliated to Shanghai Jiaotong University School of Medicine (Approval no. SH9H-2022-A16-2) and performed in accordance with the institutional protocol guidelines and the Association for Research in Vision and Ophthalmology. 6–8 weeks old C57BL/6 mice were purchased from Jiesijie (Shanghai, China) and maintained under standard environmental temperature (21 ± 1 °C) with 14 h light and 10 h dark cycle. The experimental glaucomatous model was established by MB according to the previously reported method [56]. Briefly, the mice were anesthetized with zolitil/dexmedetomidine mixture, and 2 µl (about concentration of 5.0 × 106 MB/ml) MB (diameter of 15 μm, Invitrogen) were pushed into the anterior chamber of the mice with a 30G needle (Fig. 2b). The control group received sham surgery (without microbead injection). IOP was measured at Days 1, 3, 7, 14, 21, and 28 post-injection using Icare TonoLab (Icare Finland Oy, Finland) (Fig. 2c). Measurements were performed at 9:00 AM under isoflurane anesthesia, with five consecutive readings averaged per eye.
B. fragilis colonization
Mice were randomized into four groups: Control, MB, B. fragilis-colonized, and MB + B. fragilis. Before colonization, B. fragilis-treated groups received a 14-day antibiotic cocktail, including ampicillin (sigma) 1 g/L, metronidazole (Apexbio) 1 g/L, neomycin (Apexbio) 1 g/L and vancomycin (sigma) 0.5 g/L, in drinking water followed by a 2-day washout [57]. On Day 16, mice received daily oral gavage with 108 CFU/mL of B. fragilis ATCC25285 (non-toxigenic strain [58]) in 0.2 mL PBS or PBS vehicle. After 14 days, the MB-induced ocular hypertension modeling was performed, with thrice-weekly gavage maintenance until endpoint.
Drug application
For in vivo studies, IAA (20 mg/kg, sigma), CH223191 (10 mg/kg, Abmole, TX, USA), D-ribose (3.2 g/kg, sigma) or PDTC (100 mg/kg, Abmole, TX, USA) dissolved in same vehicle (5% DMSO in PBS) were injected intraperitoneally at the same time with MB induction and were administered daily subsequently. Mice in the control group received sham and vehicle. In vitro, BV-2 cells were pretreated with 1000 µM IAA, 10 µM CH223191, 50 mM D-ribose or 100 μm PDTC 4 h prior to LPS stimulation. For the FPS-zm1 treatment experiment, the BV-2 cells were pretreated with FPS-ZM1 (20 µM) for 2 h and then exposed to D-ribose (50 mM) for 24 h. The administration method and dosage of IAA [27, 59], CH223191 [59], D-ribose [28], FPS-zm1 [60] and PDTC [61, 62] were based on previous studies.
BV-2 culture and LPS stimulation model
The BV-2 murine microglia cell line was purchased from Cellcook Biotech Co.,Ltd (Guangzhou, China) and was cultured at 37 °C in a 5% CO2 humidifed incubator using Dulbecco’s Modified Eagle Medium (DMEM) (Gibco, Franklin Lakes, NJ, USA) supplemented 4.5 g/L D-Glucose, 10% fetal bovine serum (FBS) and 1% penicillin/streptomycin. For RNA and protein extraction, LPS (100 ng/ml, sigma) was administered after drug administration for 4 hours, and the cells were harvested after a further 4 hours; for the preparation of conditioned medium, the culture medium was replaced 4 hours after LPS administration and the cells were incubated for another 24 h. Cell viability was assessed using a CCK-8 assay kit (Yeasen, Shanghai, China). Briefly, BV-2 cells were seeded in 96-well culture plates at a density of 1 × 10⁴ cells per well and incubated in DMEM supplemented with 10% FBS containing varying concentrations of IAA for 24 h. After incubation, the culture medium was removed, and 10% CCK-8 solution was added to each well. The cells were then incubated at 37 °C for 3 h, followed by measurement of the absorbance at 450 nm using a microplate reader.
SiRNA
The siRNA sequence was synthesized by Genomeditech (Shanghai). For siRNA-lipid complexes preparation, 50 nM AhR-targeting siRNA was diluted in Opti-MEM medium and mixed with Lipofectamine™ 3000 (also diluted with 50 µL Opti-MEM), followed by incubation at room temperature for 20 min. The siRNA complexes were then added dropwise to the wells and incubated for 24 h. After transfection, quantitative PCR was employed to assess the silencing efficiency, followed by subsequent experiments according to the designed groups.
Scratch wound healing assay
The scratch test references previous study [63]. BV-2 cells were seeded in 6-well plates to achieve 80% confluence and were then scratched with a sterile pipette with 200 µl tip followed by PBS washing to clean debris and dead cells. The cells were then divided into control, LPS, and LPS + IAA groups. Images were taken with a microscope at 0 h and 24 h, and cell migration was analyzed with imageJ.
Fecal microbiota transplantation experiment
The FMT procedure followed methods established in prior studies [64]. Stool samples from healthy controls and glaucoma patients (n = 5) were randomly selected and mixed in equal weights. The samples were then homogenized in pre-reduced phosphate-buffered saline. After vortexing for 5 min, the mixture was allowed to stand for another 5 min to allow larger particles to settle at the bottom of the tube. Mice pretreated with a broad-spectrum antibiotic cocktail were weight-matched and divided into two groups. Each group was administered 200 µl of the supernatant via oral gavage once daily for one week to establish colonization.
Histology and morphometric analysis
At 14 or 28 days after MB-induced ocular hypertension injury, mice were perfused with saline for 5 min to remove blood cells in the blood vessels, followed by fixation with 4% paraformaldehyde for 15 min. The eyeballs were immersed overnight with FAS eyeball fixture (Servicebio, Wuhan, China). The eyeballs were embedded in paraffin or optimal cutting temperature compound and cut into 10 μm slices, after which hematoxylin and eosin (H&E) staining was performed to analyze changes in retinal structure and the number of cells in GCL. The number of cells in 5 consecutive fields of retinal GCL was counted, averaged, and normalized with con group. The thickness of RNFL and inner plexiform layer (IPL) were measured at the same distance from the optic nerve head of each retina by ImageJ software. To explore the safety of B. fragilis or IAA, the heart, liver, spleen, lung and kidney tissues of mice were taken for paraffin embedding, section and H&E staining, and their structure changes were analyzed. Each group contained at least 3 samples.
Neurodegeneration evaluation
Neuronal degeneration was assessed by counting RGCs number at 14 days or 28 days after MB-induced ocular hypertension injury. Whole-mount retinas were obtained as previous reported [65]. Briefly, retinas were immersed in 4% PFA for 2 h and then dissected to flat-mount. Retinas were fixed with 4% PFA for 15 min followed by 0.3% Triton x-100 in PBS for permeabilization, and blocked with 5% goat serum (Boster, CA, USA) in 0.3% triton x-100 in PBS for 2 h at room temperature. Next, flat-mounts were incubated with primary antibody against βIII-tubulin (1:1000; Abcam, Cambridge, UK) overnight at 4℃ to label RGCs, followed by Alexa Fluor 594 anti-mouse secondary antibody (1:200; Abbkine, CA, USA) for 2 h at room temperature. Flat-mounts were photographed with confocal microscope (Nikon, Tokyo, Japan). A total of 8 visual fields in the middle and peripheral parts of the retina were obtained and counted using imageJ according to previous reported [66]. The average was calculated and standardized by control group.
Quantitative RT-PCR (qPCR)
Total RNA was extracted from retinal tissues using TRIzol (Invitrogen, CA, USA) and BV-2 cells using RNA extraction kit ((TaKaRa, Tokyo, Japan) as previous methods [59]. The concentration and purity of RNA was measured using Nanodrop (THERMO FISHER, USA) and reverse transcription was performed with PrimeScript RT reagent Kit (Takara, Kyoto, Japan). And fecal DNA of mice was extracted by MolPure Stool DNA Kit (Yeasen, Shanghai, China). LightCycler 480 II (Roche, Switzerland) with UNICON qPCR SYBR Green Master Mix (Yeasen, Shanghai, China) was used for gene expression quantitation. The primers used in this study refer to PrimerBank and were produced by Tsingke (Beijing, China). Primer sequences were list in Table S8. For gene expression analysis, beta-actin was used as endogenous control. For analysis of B.fragilis 16 S gene copies number in feces, 16 S rRNA was used as endogenous control. The fold changes were calculated by the 2−Δ(ΔCT) comparative method.
Western blot
Proteins were extracted from retinas or cells by RIPA (Sangon, Shanghai, China), and the concentration was measured using BCA Protein Assay Kit (Beyotime, Shanghai, China). Proteins were separated in the 10% SDS-PAGE and transferred to the polyvinylidene fluoride membranes. Then the membranes were blocked by 5% non-fat milk in Tris-buffered saline containing Tween-20. The membranes were incubated overnight at 4℃ with Primary antibodies as follows: TNFα (1:1000; Proteintech, Chicago, IL, USA), IL-1β (1:1000; Proteintech, Chicago, IL, USA), IL-6 (1:1000; Proteintech, Chicago, IL, USA), iNOS (1:1000; Abclonal, Wuhan, China), NFκB (1:1000; Proteintech, Chicago, IL, USA), p-NFκB (1:1000; Abcam, Cambrige, UK), RAGE (1:1000; Abmart, Shanghai, China), Tubulin (1:1000; Abmart, Shanghai, China), Cleaved Caspase-3 (1:1000; CST, USA), cleaved Caspase-9 (1:1000; Abclonal, Wuhan, China). Next, the secondary antibodies against rabbit (1:1000; Beyotime, Shanghai, China) or mouse (1:1000; Beyotime, Shanghai, China) were used to incubate the membranes at room temperature for 1 h. Blots were visualized by Tanon viewer system (Shanghai, China) with BeyoECL Moon (Beyotime, Shanghai, China) and quantified by ImageJ.
Immunofluorescence
For immunofluorescence, mice were perfused with saline for 5 min and followed by 4% PFA for 15 min to immobilize in situ. The eyeballs were removed and fixed in FAS eyeball fixture overnight before solidified in optimal cutting temperature compound. 10 μm slices were cut from the frozen eyeballs and permeabilized with 0.3% triton x-100 in PBS for 15 min at room temperature followed by 5% goat serum (Boster, CA, USA) in 0.3% triton x-100 in PBS for 1.5 h. The sections were incubated overnight at 4℃ with primary antibodies as follows: TNFα (1:200; Proteintech, Chicago, IL, USA), IL-1β (1:200; Proteintech, Chicago, IL, USA), IL-6 (1:200; Proteintech, Chicago, IL, USA), iNOS (1:200; Abclonal, Wuhan, China), RAGE (1:200; Abmart, Shanghai, China), Iba1; 1:100; Servicebio, Wuhan, China). Next, Alexa Fluor 488 anti-rabbit or Alexa Fluor 594 anti-mouse secondary antibodies (1:200; Abbkine, CA, USA) were used to incubate sections at room temperature for 1 h. The nuclear was stained by DAPI (Invitrogen, CA, USA). Then, the slices were photographed by confocal microscopy (Nikon, Tokyo, Japan). Each group included at least 3 samples. For the identification of microglial activation, Iba + cells number and integral optical density (IOD) were quantificated from five random fields of view of each retina and averaged, and each group contained 6 samples. For the identification of RAGE expression on retinas, IOD was quantificated from 5 consecutive fields of retinal sections and averaged. Results were analyzed by imageJ and normalized to controls.
ELISA
Mice blood, fecal and retinal samples as well as patient blood samples were collected for the detection of IAA levels using IAA research Elisa Kit (Abmart, Shanghai, China). Blood was collected using tubes free of heat and endotoxins, and serum was separated by centrifugation at 3000 rpm for 10 min. The fecal samples were added into normal saline, thoroughly crushed, and then centrifuged at 3000 rpm for 10 min to obtain the supernatant. Retinal samples were mashed in PBS and performed ultrasound and then centrifuged at 3000 rpm for 10 min to obtain the supernatant. The ELISA kit was allowed to equilibrate to for 60 min before use. Sampling and incubation were then carried out according to the ELISA kit’s instructions under room temperature. OD values at a wavelength of 450 nm were measured within 15 min after completion of the incubation steps, and standard curves were generated.
RNA sequencing
Mice retinas were collected 14 days after MB, with each group containing 3 samples and TRIzol was used to extract RNA from samples as previous manuscript. RNA was inspected using Fragment Analyze and Standard Sensitivity RNA Analysis Kit (15 nt) (DNF-471), and all samples met the requirements of database construction. Sequencing was performed by BGI (Beijing Genomic Institute, ShenZhen, China) [67]. In brief, 9 samples were sequenced with BGISEQ platform, averagely generating about 1.18G Gb bases per sample. The average mapping ratio with reference genome was 94.16%, the average mapping ratio with gene was 75.20%; 18,926 genes were identified. We used HISAT (v2.0.4) and Bowtie2 (v2.2.5) to align the clean reads to the reference genome followed by reads filtering. Mus_musculus from source of NCBI served as reference species, and reference genome version is GCF_000001635.26_GRCm38.p6. Clustering heat map, KEGG (Kyoto Encyclopedia of Genes and Genomes), and GO (Gene Ontology) were analyzed under identified by DEGseq. The results of RNA sequencing have been submitted to the NCBI database (accession number: PRJNA1171984).
Visual Cliff test
This experiment was based on the method of the previous report [68, 69]. An acrylic box (60 × 60 cm square×15 cm high) was placed on the edge of the bench with half extending over the edge to form a cliff side (90 cm above ground level) and half remained on the table to form a table side. A transparent platform (10 × 7 cm square×2 cm high) was placed in the center of the box. The table and the floor were covered with alternating black and white patterns of 2 cm in length to help the mice form depth vision. Light sources were placed 30 cm from the table and 30 cm from the ground to illuminate the experiment area. At the beginning of the experiment, the mouse was placed on the platform. The time it took for the mice to begin moving (recorded as the time of latency to dismount the platform) and their choice of direction (cliff side or table side, with the number of mice first placing a foot on the cliff side recorded) were noted. The total time of mice spent over the cliff in the first two minutes was also recorded. Each mouse was tested only once, and the platform and box were thoroughly cleaned after each test.
Isolation and treatment of primary retinal neurons
Primary retinal neurons culture was prepared based on previous studies [70]. Briefly, the retinas of postnatal day 1 (P1) rats were dissected and dissociated with papain (4 mg/mL) with DNase I (1 mg/mL). Then the tissues were filtered into single cell suspension using a 40-µm filter. The primary retinal neurons were then seeded (1.5 × 10⁶/well for 6-well plate; 5 × 10⁵/well for 24-well plate) in poly-L-lysine-coated (Gibco, Rockville, MD, USA) plate and cultured in a Neurobasal-A medium (Gibco, Rockville, MD, USA) supplemented with 2% B27 (Invitrogen, CA, USA), 2 mM L-glutamine (Beyotime, Shanghai, China) and 1% penicillin/streptomycin. RGCs were identified using βIII-tubulin. The neurons were cultured for 3 days and then incubated with BV2-conditioned medium for 24 h to conduct Western blot and live/dead assay. For the live/dead assay, the primary retinal neurons were incubated with calcein-AM/propidium iodide (Beyotime, China) for 30 min. Live and dead neurons were examined using a fluorescence microscope and counted in a total of eight fields at a standardized location at 10× magnification in a masked manner.
Statistical analysis
Data were expressed as mean ± SEM, and analyzed by Graphpad 8.0. The t-test was used to perform statistical analysis between two groups, and the one-way ANOVA followed by a Turkey’s test was used for multiple groups. P-value < 0.05 was regarded as statistically significant.

Comments (0)