
Remember me
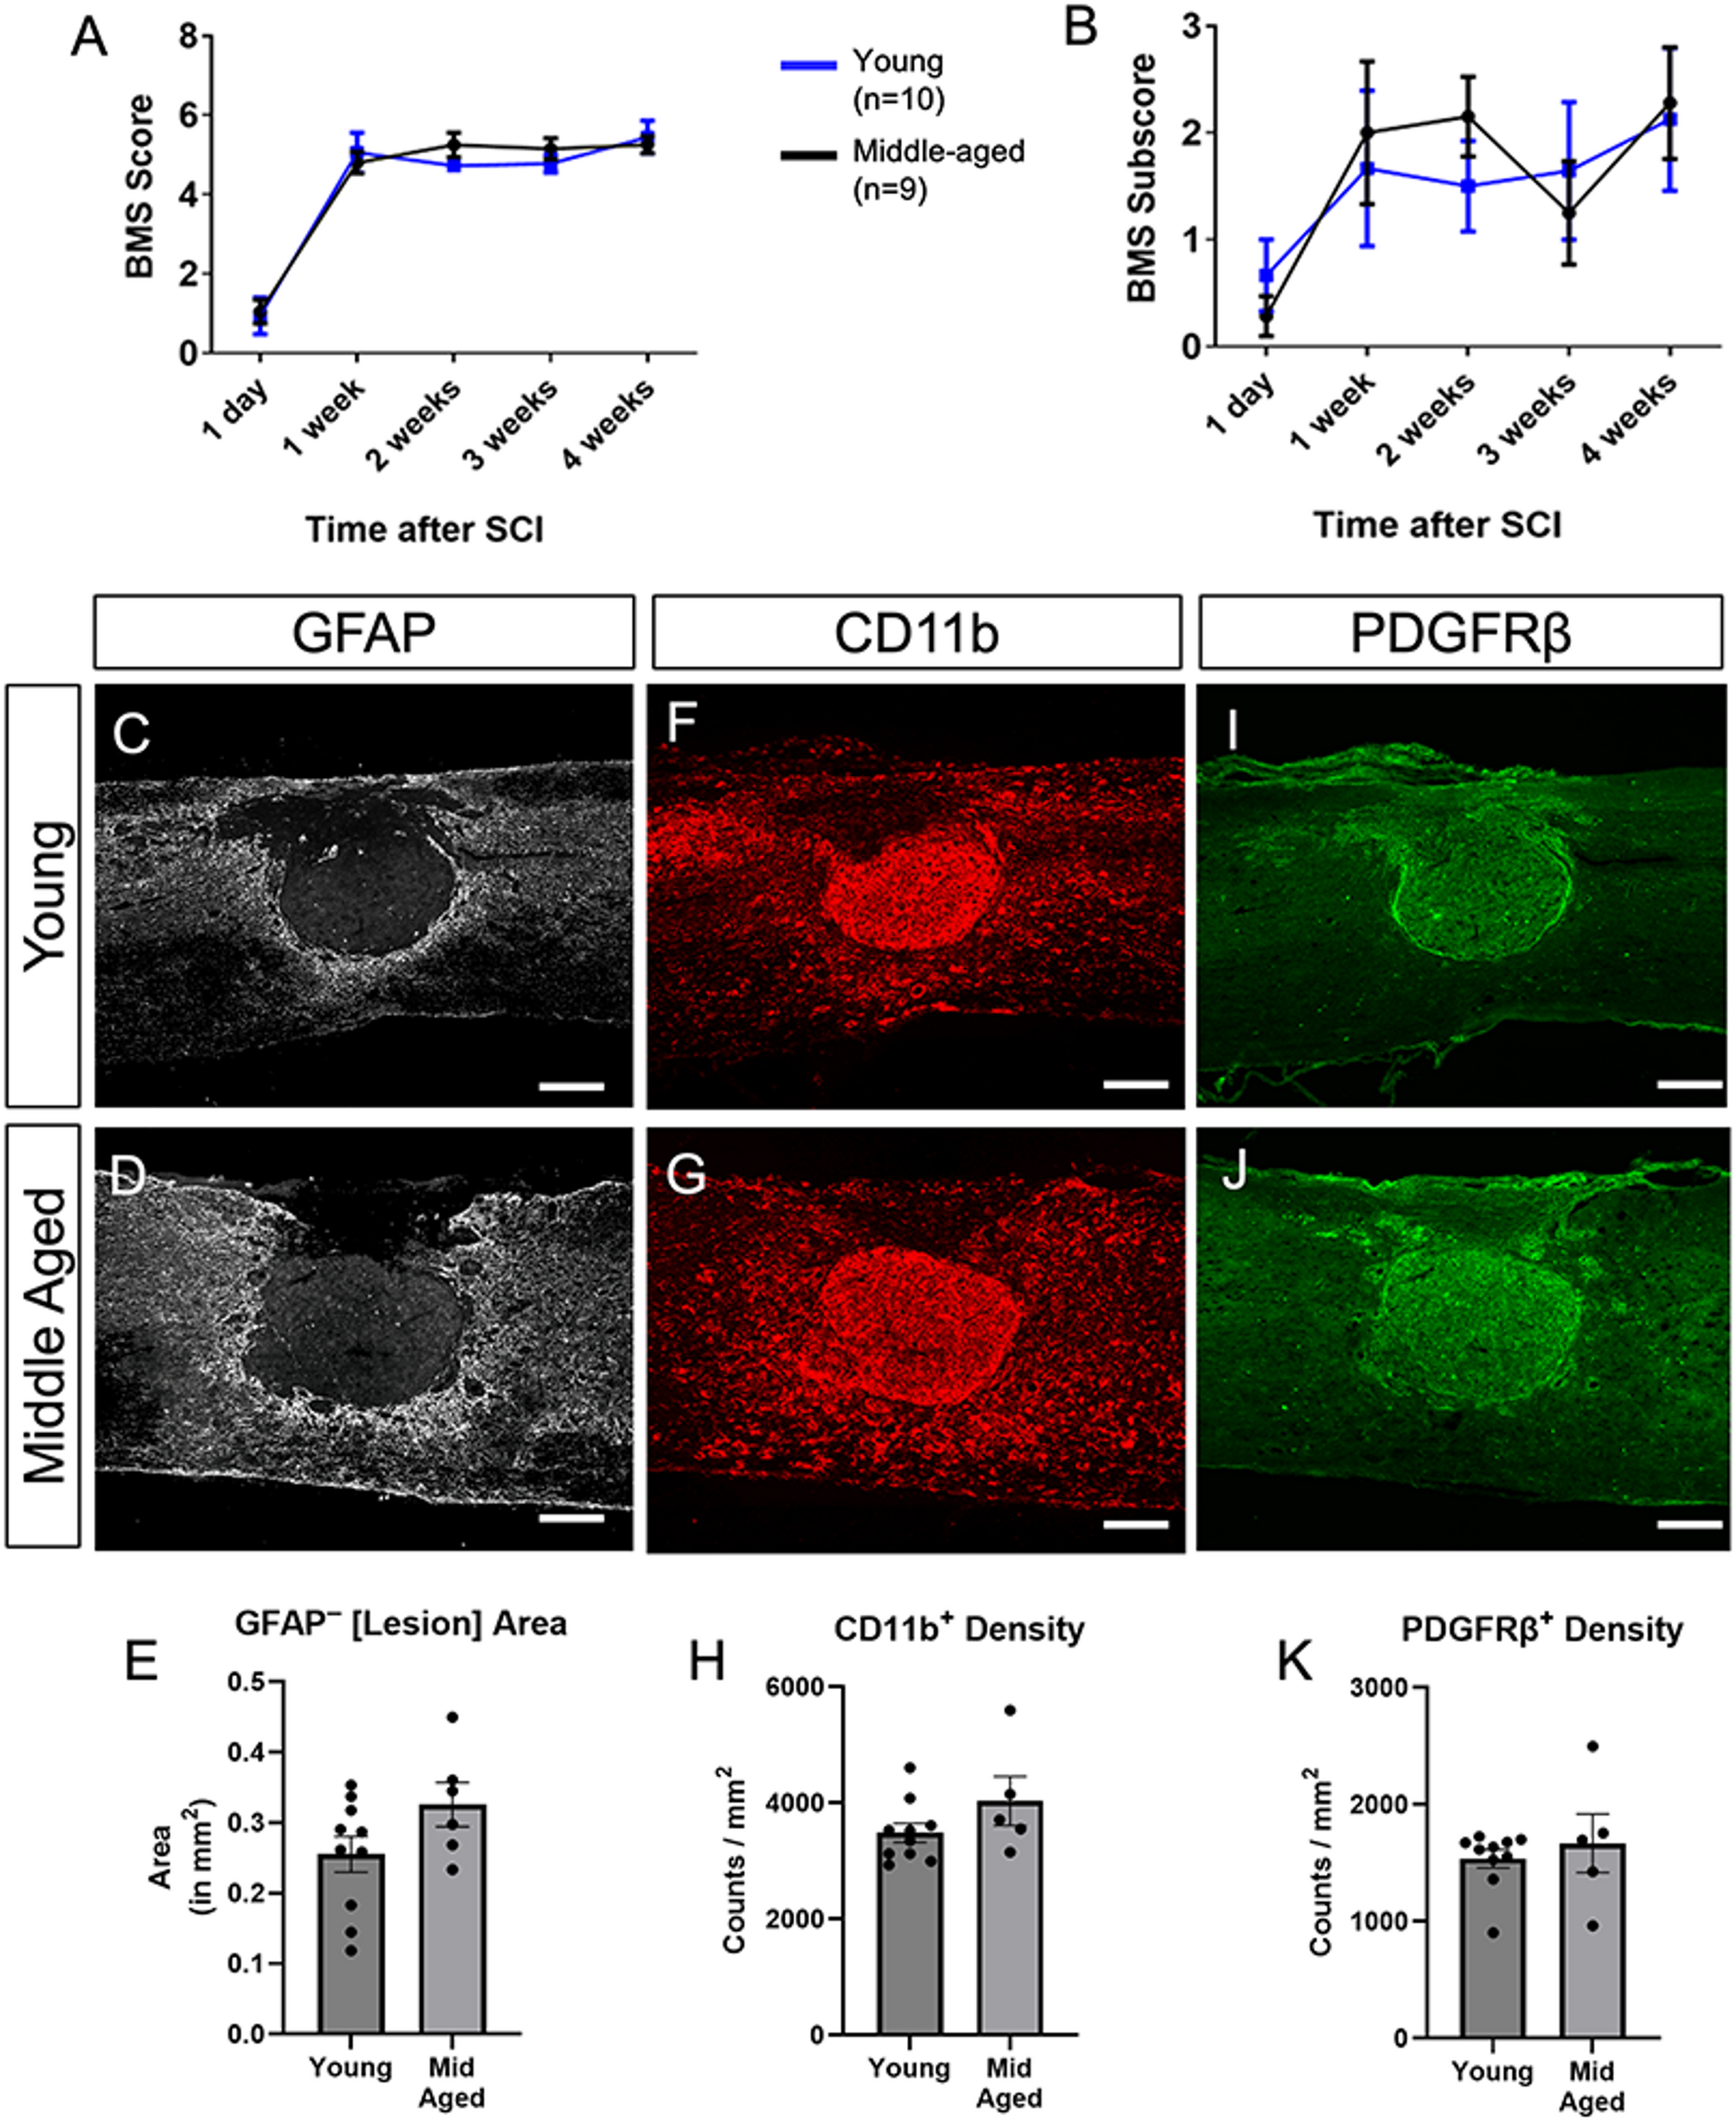
We first evaluated locomotor recovery using the BMS scale at 1, 7, 14, 21, and 28 dpi. Both young and middle-aged cohorts exhibited pronounced hind-limb paralysis acutely after injury, with incremental recovery over time. Importantly, there were no statistical differences between the two age groups at any timepoint on either the main BMS score (Fig. 1A) or the subscore (Fig. 1B) during the first month post-injury. We also compared the histopathology at 28 dpi between the two age groups by immunostaining for GFAP (astrocytes), CD11b (macrophages-myeloid cells), and PDGFRβ (fibroblasts). Our results show that the lesion size (as determined by the GFAP-negative area) was similar between the two age groups (Fig. 1C-E). In addition, the density of macrophages (Fig. 1F-H) as well as fibroblasts (Fig. 1I-K) were also similar between young and middle-aged injury sites. Taken together, our data indicate that locomotor recovery and histopathology between young and middle-aged mice are similar chronically after contusive SCI.
Fig. 1
Young and middle-aged mice show similar locomotor recovery and lesion pathology at 4 weeks after SCI. (A) Basso Mouse Scale (BMS) scores and (B) subscores of young (n=10) and middle-aged (n=9) mice over a 4-week period post-spinal cord injury (SCI). Two-way repeated measures ANOVA with Bonferroni post-test (n=10 young and n=9 middle aged mice). Representative images of GFAP+ (gray C, D), CD11b (red F, G), and PDGFRβ (green, I, J) immunostaining in spinal cord lesion areas of young and middle-aged mice. (E) Quantification of the GFAP-negative lesion area did not show differences between the two groups. (n=10 young and n=6 middle aged mice) (H) Quantification of the density of CD11b+ myeloid cells in the lesion area did not show differences between the two groups. (n=10 young and n=5 middle aged mice) (K) Quantification of the density of PDGFRβ+ fibroblasts in the lesion area did not show differences between the two groups. (n=10 young and n=5 middle aged mice) Data are presented as mean ± SEM. Unpaired Student's t-test, each data point is a biological replicate. Scale bar = 200 µm.
To assess whether cell proliferation at the injury site is affected in middle-aged mice, we injected EdU at 3 dpi to label proliferating cells and histologically assessed the injury site at 4 dpi. By co-immunostaining for EdU and GFAP, CD11b, or PDGFRβ, we quantified the number of proliferating astrocytes (Fig. 2A-C), macrophages (Fig. 2D-F), and fibroblasts (Fig. 2G-I) respectively. Our data did not show any differences between young and middle-aged mice in the proliferation of any of the three cell types examined. In addition, similar to our findings in the 28 dpi tissue above, the lesion size as well as the total number of macrophages and fibroblasts were not different between the two age groups even at this acute time point (Fig. 2J-L). Taken together, our data indicate that neither the proliferation of nor the number of astrocytes, macrophages or fibroblasts are different between young and middle-aged SCI mice.
Fig. 2
Young and middle-aged mice show similar cell proliferation and lesion pathology acutely after SCI. (A, B) Representative images of CD11b + myeloid cells (green) co-stained with EdU (magenta) in young (A) and middle-aged (B) mice at 4dpi. (C) Quantification of CD11b+/EdU + cells as a percentage of all CD11b + cells within the GFAP-negative lesion area. (n = 7 young and n = 8 middle-aged mice) (D, E) Representative images of PDGFRβ + fibroblasts (green) co-stained with EdU (magenta) in young (D) and middle-aged (E) mice at 4 dpi. (F) Quantification of PDGFRβ+/EdU + cells as a percentage of all PDGFRβ + cells within the GFAP-negative lesion area (n = 6 young and n = 7 middle-aged mice). (G, H) Representative images of GFAP + astrocytes (green) co-stained with Edu (magenta) in young (G) and middle-aged (H) mice at 4 dpi. (I) Quantification of GFAP+/Edu + cells as a percentage of all GFAP + cells within the perilesional region (250 µM region bordering the lesion) (n = 6 young and n = 7 middle-aged mice). (J, K) Density of CD11b + myeloid cells (J) or PDGFRβ + fibroblasts (K) within the lesion area in young and middle-aged mice (n = 7 young and n = 8 middle-aged mice). (L) Area of the GFAP-negative lesion in young and middle-aged mice (n = 6 young and n = 8 middle-aged mice). All counted cells were DAPI+ (nucleus in blue). Error bars = SEM. Each data point is a biological replicate. Unpaired Student’s t-test. Boxed region is enlarged in the adjacent image on the right. Scale bar = 400 μm for low magnification images, and 100 μm for high magnification images
Spatial transcriptomics shows similar injury site domains between young and middle-aged mice acutely after SCITo gain a much more comprehensive insight into the molecular histopathology of young and middle-aged mice after SCI, we performed spatial transcriptomics using the 10X Visium platform on two young and two middle-aged 3 dpi mice. Clustering of the barcoded spots pertaining to each tissue section resulted in 8 domains that defined the injury site and the surrounding spared tissue. The injury site domains were defined as the infiltrating injury core, necrotic, scar interface, and stromal layer. The surrounding spared tissue domains were defined as white matter, dorsal horn, gray matter, and ventral motor neurons (Fig. 3A, Supp. Figure 2B). To identify these regions, we used a combination of annotated genes, gene ontology terms based on top differentially expressed genes, as well as their spatial location (Fig. 3B, C). Notably, the injury-associated layers were more similar to each other in their broad transcriptional profiles (Pearson Correlation Coefficient, 2000 genes, Δr > 0.5) than compared to the spared tissue domain, likely due to their non-neural nature.
Fig. 3
Spatial transcriptomics identifies distinct domains in and around the injury site that are similar between young and middle-aged mice. (A) 10X Visium spatial transcriptomic spots were clustered based on gene expression and mapped on the injury site to identify eight distinct spatial domains that were named based on a combination of marker genes, Gene Ontology terms, and spatial location. (B) Heatmap of top differentially expressed genes for each spatial domain. The color corresponds to the level of gene expression by z-score. (C) Top Gene Ontology Biological Process terms for each spatial layer ranked according to log-adjusted p-value. Dashed line represents the threshold for logP = 0.05. Bars are colored by the total number of differentially expressed genes in each term. (D) Volcano plots of differentially expressed genes between young (left side) and middle-aged (right side) mice for each spatial domain. Genes were filtered by avg_log2FC < 0.5 and p_val_adj > 1e-3. Genes that passed both thresholds are colored according to their spatial domains. n = 2 for young and n = 2 for middle-aged mice, with one n being a single section per-animal
Consistent with its location between the spared tissue and injury site epicenter, the scar interface region was characterized by expression of both white matter genes, such as Plp1 and Trf, and immune cell genes such as Cd36, Spp1, and Cd63 (Fig. 3B). Gene Ontology (GO) Biological Processes associated with the scar interface included wound healing as well as antigen processing and presentation (Fig. 3C). The necrotic and the infiltrating injury core regions were characterized by high expression of leukocyte-associated genes such as Cd36, Thbs1, Pf4, and Ctsd (Fig. 3B), but the necrotic region had significantly lower gene counts compared to other regions. The infiltrating injury core region was characterized by biological process associated with translation, myeloid leukocyte migration, and phagocytosis, whereas the necrotic region was associated with translation (Fig. 3C). The stromal layer showed the most distinct gene expression profile, being enriched for collagens, such as Col1a1 and Col8a1, and other genes associated with fibrosis such as Smoc2 (Fig. 3B). Accordingly, the stromal region was associated with the biological processes extracellular matrix organization, collagen fibril organization, and translation. This layer was present in the most superficial portion of the dorsal spinal cord, including regions that resemble the meninges, consistent with previous studies showing that fibrosis is not prevalent at 3 days post-SCI [29]. Spatial regions were then pseudobulked by region and age group, and each region was compared in gene expression between young and middle-aged mice. This comparison revealed very few genes (no more than six) that were differentially expressed between the two age groups (Fig. 3D).
scRNA-seq reveals similar broad cell types between young and middle-aged mice acutely after SCITo investigate the effect of middle-age on transcriptional changes and heterogeneity at the cellular level, we performed single cell RNA-seq (scRNA-seq) in young and middle-aged mouse injury sites at 3 dpi. These data were combined with our previous dataset [19] at the matching time points for a total of 4 young uninjured, 3 middle-aged uninjured, 3 young SCI, and 3 middle-aged SCI biological replicates in the combined dataset. There was a total of 71,794 cells, including 6,945 macrophages, 3,830 monocytes, 19,838 microglia, 12,940 endothelial cells, 1,304 tip cells, and 2,028 astrocytes (Supp. Figure 6A). Dimensional reduction analysis of all the cells using UMAP showed distinct clusters that were uniquely identified using SingleR as well as manual annotation (Fig. 4A). We captured all major cell types as in our previous study except for oligodendrocytes. As we did not get middle-aged oligodendrocytes, they could not be compared with young oligodendrocytes and were excluded from further analyses. UMAP also showed that cells from young and middle-aged groups overlapped quite well, even without correcting for age or sample, indicating that the broad cell types are globally quite similar in gene expression profiles between the two age groups (Fig. 4B). As expected, there were clear separations in pre- and post-injury clusters (Fig. 4C). To confirm the identities of these broad cell clusters, we assessed the expression level of the top differentially expressed genes (DEGs) and annotated marker genes for each group (Fig. 4D). The 17 different cell types expressed the expected canonical marker genes. Many were unique to each cell type, but some were overlapping especially between myeloid cells that share similar lineage. The expression profile of most marker genes was similar between young and middle-aged groups except for proliferation genes (e.g. Mki67, Top2a) in the Dividing Myeloid cluster that were higher in the middle-aged group. However, as noted above, this difference did not result in differences in myeloid proliferation histologically between the two groups (Fig. 1A-C, Supp. Figure 3A, C). After identification of each broad cell type using annotated marker genes, we separated them into myeloid, neural, and vascular categories for further subpopulation analysis.
Fig. 4
Single cell RNAseq analysis of the injury site from young and middle-aged mice show similar clustering and marker genes for general cell populations. (A) UMAP representing all cells from uninjured and 3 dpi spinal cords of young and middle-aged mice, colored by cell type. A total of 4 young uninjured, 3 middle-aged uninjured, 3 young SCI, and 3 middle-aged SCI biological replicates represent the combined dataset for a total of 71,794 cells, including 6,945 macrophages, 3,830 monocytes, 19,838 microglia, 12,940 endothelial cells, 1,304 tip cells, and 2,028 astrocytes (see Supp. Fig. 6 for full list). Cells are annotated using canonical markers and alignment with other single cell references using SingleR. UMAP of all cells colored by age (B) or injury condition (C). Cells are shuffled in depth to show the distribution and density in localization in the UMAP. (D) Dotplot of marker genes used to annotate the general cell types. Circle size corresponds to the percentage of cells in the group which express at least one count of the gene. The color of the circle corresponds to the level of gene expression by z-score. Each of the 13 biological replicates represents one unenriched and one astrocyte-enriched 8mm section of spinal cord centered on T8.
Fig. 5
Single cell RNA-seq analysis of myeloid subpopulations in young and middle-aged mice after acute SCI. (A) UMAP of leukocyte subpopulations present in uninjured and 3 dpi spinal cords of young and middle-aged mice. Subpopulations are annotated using canonical markers and alignment with other single cell references using SingleR. (B) UMAP of leukocyte subpopulations separated by age (B) or injury condition (C). Cells are shuffled in depth to visualize the distribution and density in localization in the UMAP. Boxplots of microglia (D), monocyte/macrophages (F), neutrophil (H) subpopulation proportions that are shown as a percentage of all myeloid cells per-sample. Percentages are individually calculated for each sample and each spot represents one biological replicate. Boxplots are split by cell subtype with independent Y axes. Cell type proportions were statistically compared with ANOVA and Tukey’s post-test using a threshold of p<0.05. Gene Ontology Biological Processes terms based on differentially expressed genes between the noted subpopulations of microglia (E), monocytes/macrophages (G), and neutrophils (I) within their respective age groups. Micro-B was compared to Micro-Homeo, Macro-A and Macro-B were compared to monocytes, and Neutro-Activated was compared to Neutro-Homeo all within their respective age groups. Terms which are unique to each age group within a cellular response are bolded. Circle size represents the odds ratio, and color represents the number of genes which map to each term. Volcano plots of DEG results are in supplemental figure 3. Abbreviations - Micro-Homeo, Homeostatic Microglia; Micro-A, Microglia-A; Micro-B, Microglia-B; Micro-Ifn, Interferon-associated microglia; Micro-Div, Dividing Microglia; BAM, Border-associated Macrophages; Macro-A, Macrophage-A; Macro-B, Macrophage-B; Neutro-Activated, Activated Neutrophils; Neutro-Homeo, Homeostatic Neutrophils
scRNA-seq shows a different macrophage and neutrophil response in middle-aged miceAs one of the major pathobiology in acute spinal cord injury, we first investigated subpopulation differences in immune cells and their transcriptional changes at the single-cell level. UMAP of the myeloid cells showed three large clusters pertaining to microglia, monocytes/macrophages, and neutrophils (Fig. 5A, Supp. Figure 3A). Microglia were further clustered into homeostatic, and two types of SCI-induced microglia, Microglia-A (Micro-A) and Microglia-B (Micro-B). Monocytes gave rise to two macrophage populations, Macrophage-A (Macro-A) and Macrophage-B (Macro-B). This monocyte/macrophage cluster was also closely associated with dendritic cells, dividing myeloid cells, and border-associated macrophages (BAMs). The neutrophil cluster was comprised of homeostatic and activated subpopulations as noted by their presence in the uninjured and injured tissue respectively. Since an uninjured spinal cord does not normally contain neutrophils, this small population in our single cell data likely represents residual leukocytes in the vasculature and/or the leptomeninges after transcardial perfusion with artificial CSF. Without correction for age or batch effect the populations are visually well-integrated and evenly dispersed in lower-dimensional space indicating high homogeneity between the two age groups (Fig. 5B). As expected, there were injury-specific myeloid clusters (Fig. 5C). After injury, there is a reduction in the number of homeostatic microglia with a concomitant increase in Microglia-A and Microglia-B subpopulations in both young and middle-aged mice (Fig. 5D, Supp. Figure 3B). Geno Ontology (GO) Biological Processes terms based on DEGs comparing young homeostatic microglia and young Microglia-A (Supp. Figure 3C) were similar to those comparing the middle-aged counterparts (Fig. 5E). The top GO Biological Processes in Microglia-A from both age groups pertained to ATP synthesis, electron transport chain, and oxidative phosphorylation. Thus, the acute effects of SCI on microglia state seemed to be similar between young and middle-aged mice.
Fig. 6
Single cell RNA-seq analysis of glial subpopulations in young and middle-aged mice after acute SCI. (A) UMAP of glial subpopulations present in uninjured and 3 dpi spinal cords of young and middle-aged mice. Subpopulations are annotated using canonical markers and alignment with other single cell references using SingleR. (B) UMAP of glial subpopulations separated by age (B) or injury condition (C). Cells are shuffled in depth to visualize the distribution and density in localization in the UMAP. Boxplots of ependymal cell subpopulations (D) and their Gene Ontology Biological Processes based on DEG comparing combined ependymal cells A and B to the astroependymal A subpopulation (E) or the astroependymal B subpopulation (F). Boxplots of astrocyte subpopulations (G) and their Gene Ontology Biological Processes based on DEG comparing homeostatic and reactive astrocytes (H). Boxplots of oligodendrocyte progenitor cell (OPC) subpopulations (I) and their Gene Ontology Biological Processes based on DEG comparing OPC-a2 and OPC-b (J). Boxplot percentages are individually calculated for each sample and each spot represents one biological replicate. Boxplots are split by cell subtype with independent Y axes. Cell type proportions were statistically compared with ANOVA and Tukey’s post-test with p<0.05. GO terms are from comparisons of cell types within their respective age group. Terms which are unique to each age group within a cellular response are bolded. Circle size represents the odds ratio, and color represents the number of genes which map to each term. Volcano plots of DEG results are in supplemental figure 4. Abbreviations– Astroepen. Astroependymal; Astroepen-Div, Astroependymal-Dividing; Astrocyte-Homeo, Astrocyte-Homeostatic; Neuron-CSF, Cerebrospinalfluid-contacting Neurons; Neuron-SstExc, Sst positive and Excitatory Neurons; Neuron-Inhib, Inhibitory Neurons; OPC, Oligodendrocyte Precursor Cell; OPC-Div, Oligodendrocyte Precursor Cell- Dividing
Monocytes also gave rise to two macrophage populations, with Macrophage-A being the larger of the two (Fig. 5F). Interestingly, both Macrophage-A (p < 0.05) and Macrophage-B subpopulations were reduced in middle-aged mice, although the latter failed to reach statistical significance (Supp. Figure 3B). GO Biological Processes based on DEGs between young monocytes and young Macrophage-A were largely like those comparing the middle-aged counterparts. The top GO Biological Processes terms in Macrophage-A from both age groups pertained to lipid and organic acid metabolism (Fig. 5G). However, young Macrophage-A were more associated with lipid metabolism while middle-aged Macrophage-A were more associated with organic acid metabolism. In addition, N-acetylneuraminate and N-acetylglucosamine metabolism were processes unique to middle-aged Macrophage-A subpopulation. GO terms for Macrophage-B were also different between young and middle-aged mice. While PI3K signaling was the major biological process in young Macrophage-B, it did not appear among the terms in middle-aged Macrophage-B, which was characterized by terms associated with catabolic and metabolic processes (Fig. 5G). Thus, the acute effects of SCI on monocyte-derived macrophages seem to be different between young and middle-aged mice.
Of the myeloid cells, neutrophils showed perhaps the starkest differences in GO Biological Processes between young and middle-aged mice. While comparison of young homeostatic neutrophils and young activated neutrophils resulted in GO Biological Processes pertaining to protein catabolism and transport, the corresponding comparison in middle-aged neutrophils resulted in terms associated with leukocyte migration and chemotaxis (Fig. 5I). This difference may explain the greater percentage of activated neutrophils observed in middle-aged mice, although it was not statistically significant (Fig. 5H). Taken together, scRNA-seq analysis of myeloid cells shows subpopulation-specific effects in macrophages and neutrophils, but not microglia, in middle-aged mice acutely after SCI.
scRNA-seq shows an increased reactive OPC response in middle-aged miceUMAP of neural cells showed three large clusters of ependymal cells, astrocytes, and oligodendrocyte progenitor cells (OPCs) (Fig. 6A). The few neurons that survived the dissociation procedure were classified as inhibitory, excitatory, and CSF-contacting neurons. Oligodendrocytes were mostly from our previous dataset [19] and were not present in the current experiment. Thus, neurons and mature oligodendrocytes were not analyzed further. UMAP showed three types of ependymal subclusters (A, B, and UK), but their marker gene expression showed few differences (Supp. Figure 4A), so they were combined into one group in downstream analysis. These ependymal cells were the predominant subcluster in the uninjured spinal cord, whereas SCI gave rise to astroependymal-A and astroependymal-B subclusters, whose proportions were not significantly different between young and middle-aged mice (Fig. 6D, Supp. Figure 4B). GO Biological Processes terms based on DEGs comparing young ependymal cells and young astroependymal-A cells were similar to those comparing the middle-aged counterparts (Fig. 6E). The top GO Biological Processes in astroependymal-A from both age groups pertained to complement activation and humoral immune response activation. GO Biological Process in astroependymal-B cells were also similar in young and middle-aged mice, except for young mice showing enrichment for genes related to mitochondrial function (Fig. 6F).
The astrocyte cluster was comprised of a subcluster predominant in uninjured spinal cord (i.e. homeostatic) and a subcluster predominant in the injured spinal cord (i.e. reactive), which likely represents the progression of astrocytes during astrogliosis (Fig. 6C). Although 3 dpi is toward the early phase of astrogliosis, the scRNA-seq analysis was able to identify a reactive subpopulation characterized by increased expression of Gfap and Osmr (Supp. Figure 4A). However, the proportion of the two subpopulations as well as the biological processes defining their transition from homeostatic to reactive astrocytes were similar between young and middle-aged mice (Fig. 6G-H). Most of the top biological processes that pertained to reactive astrogliosis at this early time point were related to translation and ribosomal assembly.
The OPC cluster was comprised of a homeostatic subpopulation (OPC-A) predominant in the uninjured spinal cord, and two subpopulations that appeared after SCI, one of which we classified as dividing OPCs (OPC-div) due to their unique expression of cell cycle genes (Fig. 6A-C, Supp. Figure 4A). The other injury-specific OPC subpopulation (OPC-B) that likely represents a reactive phenotype was significantly higher (p < 0.05) in the middle-aged group seemingly at the expense of the homeostatic OPC-A subpopulation (Fig. 6I). In addition, biological processes comparing OPC-A and OPC-B subpopulations from the respective age groups showed interesting differences. Whereas young reactive OPCs (OPC-B) were characterized by inflammatory responses compared to young homeostatic OPCs (OPC-A), these inflammatory processes were largely absent in the middle-aged OPCs (Fig. 6J). One biological process that was common to both ages groups was response to wounding. Taken together, at 3 days post-SCI, astrocyte and OPC lineage cells seem to display similar response to SCI in both young and middle-aged mice, but reactive OPCs seem to be greater in proportion as well as less inflammatory in middle-aged mice.
Vascular cell activation after SCI is broadly comparable between young and aged miceUMAP of vascular cells displayed four large clusters comprised of an endothelial cluster, pericyte/vascular smooth muscle cell (VSMC) cluster, and two distinct fibroblasts clusters (Fig. 7A-C). The endothelial cluster was comprised of arterial, venous, capillary, and tip cell subpopulations. All subpopulations expressed classic endothelial markers such as Pecam1 and Cldn5 (Supp. Figure 5A). The three capillary groups appear to broadly represent a gradient in transition from arterial to venous populations, however, these three groups did not strongly express unique genes or ontologies and so were combined for downstream analyses. Arterial cells were greatly reduced after injury in both middle-aged and young populations, comprising a primarily homeostatic population, whereas venous cells increased after injury (Fig. 7D), expressing elevated levels of multiple cell adhesion molecules (Vcam1, Selp, etc.). The GO Biological Processes terms for the injured arterial cells showed immune response in young mice, but cell adhesion and vascular development in middle-aged mice (Fig. 7E). Tip cells were almost exclusively dominated by proliferation-associated genes in both groups, with younger tip cells having mitochondrial translation and mitochondrial gene expression as the top two terms (Fig. 7E).
Fig. 7
Single cell RNA-seq analysis of vascular subpopulations in young and middle-aged mice after acute SCI. (A) UMAP of vascular subpopulations present in uninjured and 3 dpi spinal cords of young and middle-aged mice. Subpopulations are annotated using canonical markers and alignment with other single cell references using SingleR. UMAP of vascular subpopulations separated by age (B) or injury condition (C). Cells are shuffled in depth to visualize the distribution and density in localization in the UMAP. Boxplots of endothelial subpopulations (D) and their Gene Ontology Biological Processes based on DEG comparing arterial uninjured and injured or capillary to tip cells (E). Boxplots of fibroblast subpopulations (F) and their Gene Ontology Biological Processes based on DEG comparing fibroblast-3 to fibroblast-2 or uninjured fibroblast-1 to injured fibroblast-1 (G). Boxplot percentages are individually calculated for each sample and each spot represents one biological replicate. Boxplots are split by cell subtype with independent Y axes. Cell type proportions were statistically compared with ANOVA and Tukey’s post-test using a threshold of p < 0.05. GO terms are from comparisons of cell types within their respective age group. Terms which are unique to each age group within a cellular response are bolded. Circle size represents the odds ratio, and color represents the number of genes which map to each term. Volcano plots of DEG results are in supplemental Figs. 5. Abbreviations– Endoth, Endothelial; Cap, Capillary; VSMC, Vascular Smooth Muscle Cell
The fibroblast populations consisted of three groups split between two clusters in the UMAP, with group 2 and 3 forming one cluster and group 1 forming another. Group 3 consisted of mostly uninjured fibroblasts and expressed the highest levels of genes associated with homeostatic perivascular fibroblasts (Dcn, Lum) while group 2 consisted mostly of injured fibroblasts with reduced homeostatic markers (Supp. Figure 5A). Both groups showed an increase in populations in response to injury, with group 2 contributing to about 15% of the vascular population in the aged group, and 5% in the young group (Fig. 7F; Supp. Figure 5B). Fibroblast group 1 expressed the highest level of collagens and Postn, associated with fibroblast activation and ECM deposition (Supp. Figure 5A, C). Interestingly, group 1 also was enriched in various solute channels, a marker of human meningeal fibroblasts in a recent study [30]. Group 1 also showed the most dramatic increase with a significant difference between age groups (Supp. Figure 5B). For fibroblast group 1, only the middle-aged group showed significant GO biological terms with their differentially expressed genes when comparing uninjured to 3 dpi cells (Fig. 7G). These terms were primarily related to ECM organization. Fibroblast-2 was compared to Fibroblast-3 because they clustered together on the UMAP with the former present in the injured tissue, and the latter present in the uninjured tissue, suggesting that Fibroblast-2 was arising from Fibroblast-3 after SCI (Fig. 7B-C; Supp. Figure 5B). Fibroblast-2 GO terms in the young were associated with oxidative phosphorylation and ATP synthesis, whereas GO terms in the middle-aged were associated with mitochondrial membrane, ECM assembly, and SMAD signaling (Fig. 7G). Taken together, although we did not find vascular subpopulations unique to young or middle-aged mice, the transcriptional responses for many subpopulations were different between the two age groups.
Direct comparison of young and middle-aged subpopulationsOur analyses described above were based mostly on comparisons between the homeostatic and injured states within the same age group. We also performed additional analysis directly comparing the two age groups for each subpopulation before and after injury since some subpopulations do not have a corresponding homeostatic state (Fig. 8). There were very little differences between young and middle-aged subpopulations before injury, but several subpopulations showed distinct differences in gene expression between the two age groups after injury (Fig. 8A and B). The most notable were tip cells, which showed the highest number of differentially expressed genes in both the young and middle-aged groups. Many GO terms related to genes higher in young tip cells compared to those in the middle-aged were related to TGF-beta signaling, revealing potential differences in molecular signaling between young and middle-aged tip cells. GO terms for middle-aged tip cells were mostly related to apoptosis and programmed cell death, perhaps suggesting the vulnerability of tip cells with age after SCI (Fig. 8C). The subpopulation with the biggest difference in differentially expressed genes (DEG) between the two age group was OPC-B. Young OPC-B had more DEG compared to middle-aged OPC-B, and the associated GO terms were related to wound healing and cell migration, suggesting that these functions are more active in young OPCs.
Fig. 8
A direct comparison between young and middle-aged cell subpopulations. (A) heatmap of how many genes were differentially expressed in young (top left split) and middle-aged mice (bottom right split) for each timepoint (x axis) and cell subtype (y axis). Genes were obtained using DESeq2 and regressing out batch metadata. All genes passing padj < 0.05 are counted. Groups are not plotted or are greyed out when there were fewer than three samples with > 5 cells per group available for testing, or no DEGs passing in any group. (B) Volcano plots of selected groups from figure A. Horizontal line indicates padj < 0.05, vertical lines represent a log2FC +/- 0.5. All genes passing padj < 0.5 are plotted. The top 20 DEGs are labeled in each group. (C) Gene ontology terms which mapped to differentially expressed genes between ages for cell subtypes at each timepoint. All genes passing padj < 0.05 were processed per-group. Circle size represents the odds ratio, and color represents the number of genes which map to each term. Vertical line at X intercept represents padj = 0.05
Comments (0)