Mice
All experimental procedures were approved by the Animal Experiment Ethics Committee at the University of Tokyo (approval numbers: P29-10, P29-11, and P4-4) and conducted in accordance with the University of Tokyo’s guidelines for the care and use of laboratory animals. C57BL/6J mice, CR3KO mice, and Aldh1l1-gfp mice were used in the experiments, which were conducted on postnatal days 1, 7, 11, and 14 (P1, P7, P11, and P14). C57BL/6J mice were obtained from Japan SLC. CR3KO mice were originally obtained from The Jackson Laboratory (JAX strain #003991). Frozen sperm from the MMRRC (MMRRC stock # 011015-UCD) was obtained, and Aldh1l1-gfp mice were bred by the University of Tokyo Developmental Engineering Service. All the mice were maintained in a temperature-controlled (23–25 °C) and light-controlled (12-hour light/dark cycle) environment with ad libitum access to food and water. For the behavioral experiments, only male mice were used. For other experiments, both male and female mice were used. Different experimental groups of pups were housed together in the same cage until weaning at P21, and individual identification was achieved using a combination of left and right ear notches.
Primary cortical glial culture and astrocyte isolation
Primary glial cultures were prepared from P1 male and female C57BL/6J wild-type mice as previously described [24]. Mice were anesthetized on ice, and brains were quickly removed and transferred into ice-cold Hank’s balanced salt solution (HBSS). Cortices were separated from the meninges under a dissection microscope, collected in HBSS, and kept on ice. The tissue was minced with scalpels and incubated in 0.25% trypsin (Nacalai, #35555-54) and 0.01% DNase I (Roche, #10104159001) at 37 °C for 40 min. Trypsinization was stopped by adding fetal bovine serum (FBS; Gibco, #10437028), and the suspension was centrifuged at 136 × g for 10 min at room temperature. Cells were dissociated in culture medium containing 10% FBS and 1% penicillin–streptomycin (Nacalai, #09367-34) in Dulbecco’s Modified Eagle Medium (DMEM; Gibco, #10569010), filtered through a 100-µm-pore cell strainer, and plated into poly-D-lysine (PDL; 10 µg/mL, Sigma, #P6407)-coated T75 flasks (Falcon, #353136). Cultures were maintained at 35 °C in 5% CO₂, with the medium changed the day after plating and every 3 days thereafter.
Astrocyte isolation was performed from cortical glial cultures at DIV14. Cultures were rinsed twice with 10 mL of pre-warmed Phosphate-buffered saline (PBS) (35 °C), followed by gentle agitation in 10 mL PBS for 3 min to loosen adherent cells. After PBS removal, fresh culture medium was added, and the flasks were returned to the incubator. To detach astrocytes, 5 mL of trypsin-EDTA was added and incubated for 5 min at 35 °C. Cells were then gently scraped, and 5 mL of medium was added to stop trypsinization. The cell suspension was centrifuged at 1,000 rpm for 5 min, and the pellet was resuspended in medium and replated into PDL-coated T75 flasks using the same medium composition as for the glial culture. The astrocyte cultures were maintained at 35 °C in 5% CO₂ for 24 h.
Injection of non-biogenic NPs
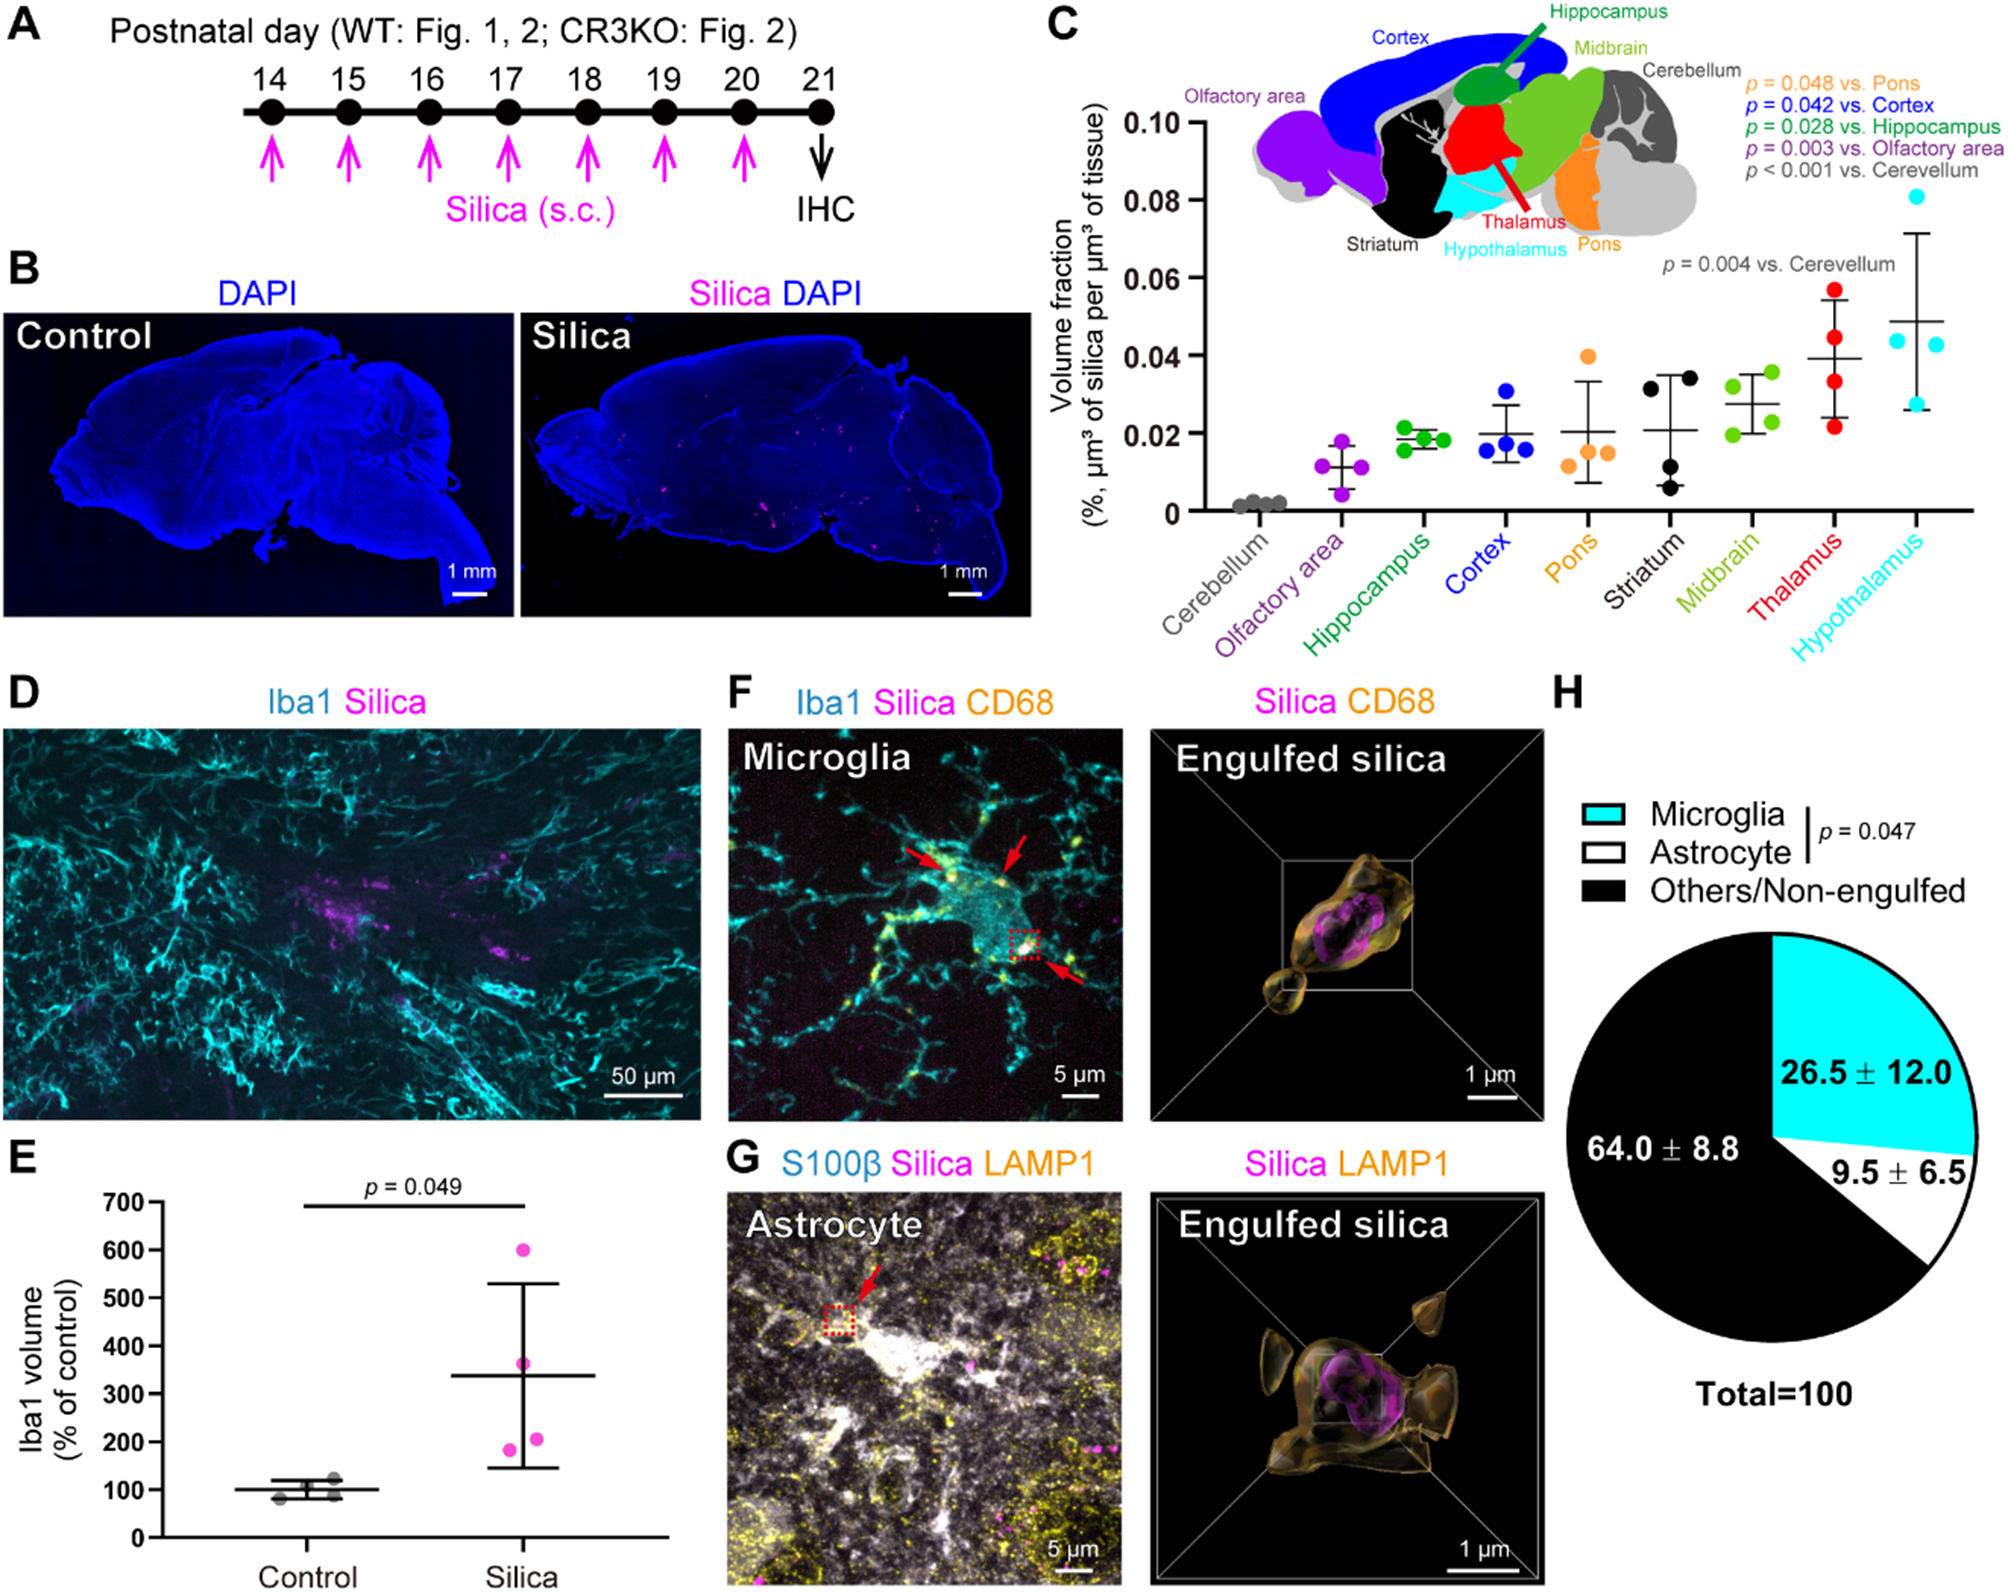
To investigate the effects of non-biogenic NPs on brain cells, we used fluorescent silica NPs (25 nm ultrasonicable fluorescent silica nanobeads, lyophilized, Sigma‒Aldrich, #797901) and fluorescent polystyrene NPs (30 nm, Thermo Fisher Scientific, #G25) for immunohistochemical analysis. Additionally, silica NPs (30 nm, Micromod Partikeltechnologie GmbH, #43-00-301) were employed in behavioral experiments. These NPs were suspended in saline (for silica) or Milli-Q water (for polystyrene) at a concentration of 0.1 mg/mL. To prevent NP agglomeration, the suspensions were ultrasonicated for at least 30 min prior to administration.
The selected concentration and duration of NP exposure were based on estimated human environmental exposure levels. According to the World Health Organization (2019), the global average concentration of PM2.5 is 32.9 µg/m³. Based on this value and the average respiratory rate of a human infant (approximately 0.6 m³/kg/day), the estimated daily PM2.5 exposure is 19.74 µg/kg/day. Over a 5-year period (from ages one to five), the cumulative exposure would total approximately 36,025.5 µg/kg.
In our study, we administered 0.01 mg/day (1,000 µg/kg/day) of silica NPs to P14 C57BL/6J wild-type or CR3KO mice for 7 consecutive days. With an average body weight of 6.5 g during the P14 to P20 period, this corresponds to a cumulative dose of 7,000 µg/kg [25]. Although this daily exposure dose in our model exceeds typical environmental exposure levels in humans, the total cumulative dose is within the range of long-term human exposure. Therefore, our exposure paradigm serves as a relevant model for studying the neuroimmune consequences of chronic environmental NP exposure.
Furthermore, comparative studies of brain development across species suggest that the first two postnatal weeks in rodents correspond to the late gestational and early postnatal period in humans [26]. Given that key neuronal and glial interactions undergo significant development during this timeframe, our model provides insights into early-life NP exposure effects during a critical neurodevelopmental window.
The NP suspensions were administered using two different methods: subcutaneous injection and transpulmonary administration. For subcutaneous injection, P14 mice received daily subcutaneous injections of 100 µL for seven consecutive days. For transpulmonary administration, designed to simulate real-world pulmonary exposure, 100 µL of the NP suspension was administered daily at P14 using a fine particle sprayer (FPS-050-A1, TORAY, Japan).
Plasmid construction and design of single guide RNAs (sgRNA)
CC chemokine receptor 4 (CCR4) was knocked out via a single adeno-associated virus (AAV) vector containing Cas9 and a sgRNA [27]. A plasmid expressing SaCas9 downstream of an astrocyte-specific promoter (GfaABC1D-SaCas9-U6-sgRNA) was generated from the template pAAV-FLEX-SaCas9-U6-sgRNA (Addgene; #124844). The plasmid was digested with XhoI and KpnI to remove CMV-FLEX-SaCas9. The GfaABC1D promoter and SV40 polyA were amplified via polymerase chain reaction (PCR) using GfaABC1D-hM3D-mCherry (Addgene; #92284). SaCas9 was amplified from pAAV-FLEX-SaCas9-U6-sgRNA via PCR. PCR amplicons were cloned at the XhoI and KpnI cleavage sites via In-Fusion® Snap Assembly Master Mix (TaKaRa Bio, Inc.; #638947) to obtain the target plasmids. The sgRNA targeting CCR4 was designed according to Hunker et al. [27]. The exon 2 sequence was uploaded to CHOPCHOP (crispor.tefor.net) as the most upstream coding exon of CCR4. We tested the CCR4 knockout efficiency in primary cultured astrocytes for three candidate sgRNAs, and the sgRNA sequences were as follows: CCR4 sgRNA#15’-cggagcgcgacgattccaaag-3’, CCR4 sgRNA#2 5’-gggctactacgccgccgacca-3’, CCR4 sgRNA#3 5’-cgtcgtcgagttgaccgagta-3’. To integrate CCR4 sgRNA#1, which had the highest KO efficiency, into the plasmid, GfaABC1D-SaCas9-U6-sgRNA was cleaved with KpnI and NotI to remove the U6 promoter and scaffold sequence. The U6-sgCCR4 scaffold with additional sgRNA was amplified via PCR, and in-fusion cloning was performed at the Notl and KpnI cleavage sites to obtain GfaABC1D-SaCas9-U6-sgCCR4.
AAV production and virus injection
Recombinant AAVs were prepared according to Morikawa et al. [28]. Briefly, AAVdj-cap, pHelper (Cell Biolabs, Inc.; #VPK-400-DJ), and a transfer plasmid (GfaABC1D-SaCas9-U6-sgRNA or GfaABC1D-SaCas9-U6-sgCCR4) were triple transfected into the AAV293 cell line (Cell Biolabs, Inc.; #AAV-100) using PEI-MAX (Polysciences, Inc.; #24765). AAV was purified using the AAVpro Purification Kit All Serotypes (Takara Bio, Inc.; #6666). Virus titers were measured using pAAV2 ITR primers (forward: 5’-ggaacccctagtgatggagtt-3’, reverse: 5’-cggcctcagtgagcga-3’), Luna Universal qPCR Master Mix (New England Biolabs; #M3003S), and the LightCycler qPCR 2.0 system (Roche; #DX400;). For intracerebroventricular (i.c.v.) injections, P7 C57BL/6J wild-type mice were cryoanesthetized for 1–2 min. A 1 µL volume of AAV (AAVDJ-GfaABC1D-SaCas9-U6-CCR4 sgRNA, 1.3 × 10¹⁰ vg/mL; AAVDJ-GfaABC1D-SaCas9-U6 control sgRNA, 1.9 × 10¹² vg/mL) was administered via a microsyringe coupled to a Hamilton syringe. The syringe was then withdrawn slowly after injection.
Administration of reagents
To inhibit CCR4 activation, C-021 dihydrochloride (Tocris, #3581) was administered to P11 C57BL/6J wild-type via subcutaneous injection once daily for 10 consecutive days. The compound was prepared at a concentration of 0.1 mg/mL in sterile saline, and 100 µL of the solution was injected per day.
Sample Preparation and immunostaining
The mice were anesthetized with isoflurane and perfused with cold 0.1 M phosphate-buffered saline (PBS) followed by 4% paraformaldehyde (PFA). The brains were subsequently postfixed in 4% PFA for 24 h at 4 °C. Coronal Sect. (100 μm thick) were cut with a Zero-1 vibratome (Dosaka). The sections were washed three times with PBS and blocked in PBS with 0.3% Triton X-100 and 10% goat serum or bovine serum albumin (BSA) for 30 min at room temperature. They were then incubated with primary antibodies in PBS containing 0.3% Triton X-100 and 10% goat or BSA at room temperature overnight. After primary antibody incubation, the sections were washed and incubated with secondary antibodies in PBS containing 0.3% Triton X-100 and 5% goat serum or BSA for 24 h. Finally, the sections were washed and imaged using a Spin SR10 confocal microscope (Olympus).
For C-C motif chemokine 17 (CCL17) and CCR4 immunostaining, the procedure was similar until secondary antibody incubation. Biotin-labeled secondary antibodies were used, followed by incubation in PBS with 3.3% H2O2 and 30% methanol to block endogenous peroxidases. After washing, the sections were incubated in a mixture of reagents A and B in PBS (Vector, #PK-4001), followed by washes with PBS and Tris HCl. The sections were then incubated with fluorescein tyramide (Tocris, #6456/1) or cyanine 3 amplification reagent (Perkin Elmer, #FP1170) in amplification diluent and imaged using a Spin SR10 confocal microscope (Olympus).
For C3 immunostaining, antibody buffer (150 mM NaCl, 50 mM Tris base, 1% BSA, 100 mM L-lysine, 0.04% azide, pH 7.4) and blocking buffer (antibody buffer containing 0.2% Triton-X and 5% BSA) were prepared. The sections were first incubated in blocking buffer, followed by overnight incubation with primary antibodies in a mixture of antibody and blocking buffer. After washing, the sections were incubated with secondary antibodies and imaged as described above.
Antibodies for immunohistochemistry
The following primary antibodies were used: rabbit anti-Iba1 (1:500; Wako, #019-19741), guinea pig anti-Iba1 (1:500; Synaptic Systems, #234004), chicken anti-Iab1 (1:500; Synaptic Systems, #234009), rat anti-CD68 (1:500; Bio-Rad, #MCA1957GA), rabbit anti-C3d (1:200; Dako, #A0063), mouse anti-S100β (1:500; Sigma‒Aldrich, #S2532), rat anti-CD31 (1:300; BD Pharmigen, #550274), rabbit anti-CCL17 (1:500; Invitrogen, #PA5-34515), goat anti-CCR4 (1:500; Abcam, #1669), chicken anti-GFP (1:1000; Abcam, #ab13970), mouse anti-tyrosine hydroxylase (1:500; EMD Millipore, #MAB318), rabbit anti-cleaved caspase3 (1:500; Cell Signaling Technology, #9661), and rabbit anti-phospho-p44/42 MAPK (Erk1/2) (1:250; Cell Signaling Technology, #9101S), mouse anti-HA (1:500; Nacalai Tesque, #06340-96), and rabbit anti-LAMP1 (1:500; Abcam, #ab24170).
The secondary antibodies used included goat anti-rabbit IgG (H + L) Alexa Fluor 488 (1:500; Thermo Fisher Scientific, #A11034), goat anti-rat IgG (H + L) Alexa Fluor 647 (1:500; Thermo Fisher Scientific, #A21247), goat anti-rat IgG (H + L) Alexa Fluor plus 405 (1:500; Thermo Fisher Scientific, #A48261), goat anti-guinea pig IgG (H + L) Alexa Fluor 647 (1:500; Thermo Fisher Scientific, #A21450), goat anti-mouse IgG (H + L) Alexa Fluor plus 647 (1:500; Thermo Fisher Scientific, #A21236), and goat anti-mouse IgG (H + L) Alexa Fluor plus 405 (1:500; Thermo Fisher Scientific, #A48255).
Image acquisition and analysis
Sagittal section images were captured with a BZ-X810 (Keyence) at 10× (NA = 0.45), and other images were captured with a SpinSR10 (Olympus) confocal system at 40× (NA = 0.95), 60× (NA = 1.3), and 100× (NA = 1.35) objectives. Images of sagittal brain sections were captured with a BZ-X810 microscope. Z-series images were acquired at 0.25 μm intervals for a total of 21 sections for C3 analysis, at 0.33 μm intervals for 31 sections for CCR4 expression analysis, and at 0.25 μm intervals for 41 sections for other analyses. For silica detection with SpinSR10, a super resolution disc SoRa was used. C3 tagging was manually verified. The number of NeuN cells was manually counted. Perivascular astrocytes and perivascular microglia were manually defined as astrocytes or microglia in direct contact with CD31+ blood vessels. When assessing CCL17 levels, the area from the vessel circumference to its periphery, equidistant from the vessel diameter, was classified as the perivascular area, and the remaining areas were designated non-perivascular areas. The silica, Iba1, C3, CCL17, CCR4, and pERK1/2 levels were analyzed via Sync Measure 3D in ImageJ software (NIH) after image thresholding. Images were processed and analyzed via ImageJ. 3D reconstruction images of microglia and astrocytes in surface generation mode were generated using Imaris software (Carl Zeiss Vision GmbH).
Cytokine array
A Mouse XL Cytokine Array Kit (R&D Systems, # ARY028) precoated with 111 cytokine/chemokine antibodies was used. Each assay was performed according to the manufacturer’s instructions using a mixture of 100 µL of protein samples extracted from the whole brain of one mouse from six control, silica NP-, or polystyrene NP-treated mice. The samples were homogenized in lysis buffer containing protease and phosphatase inhibitors and centrifuged at 13,500 × g for 15 min at 4 °C, after which the supernatants were collected. Protein concentrations were determined using the Bradford method.
CCL17 treatment and C3 ELISA
Isolated astrocyte cultures were treated with CCL17 (5 ng/mL) for 24 h. The supernatants were collected for C3 quantification using a mouse C3 ELISA kit (Abcam, #ab263884) according to the manufacturer’s instructions.
Western blotting
Western blotting was performed using the Jess Simple Western System (Protein Simple, #004-650) with the Anti-Rabbit Detection Module for Jess, Wes, Peggy Sue or Sally Sue (Protein Simple, DM-001) and Anti-Goat Detection Module for Jess, Wes, Peggy Sue or Sally Sue (Protein Simple, DM-006). The total protein concentration was determined by the BCA method. The primary antibodies used included rabbit anti-GAPDH (1;500; Sigma-Aldrich, #G9545), rabbit anti-Iba1 (1:500; Wako, #019-19741), rabbit anti-GFAP (1:500; Sigma-Aldrich, #G9269), and goat anti-CCR4 (1:10; Abcam, #1669) antibodies, and the secondary antibody used was the one supplied with the kit.
Open field test (OFT)
The OFT was conducted using a square white polystyrene box (W30 × D30 × H34.5 cm) with an open top. The arena included a center zone measuring 18 × 18 cm. Each mouse was placed in the arena for 15 min, and movement was recorded at 2 frames per second (FPS). All tested mice were C57BL/6J wild-type, regardless of injection or treatment conditions. Total travel distance and time spent in the center zone were calculated using the original macro in ImageJ (NIH, Bethesda, MD, USA).
Elevated plus maze (EPM)
C57BL/6J wild-type mice that did not undergo the OFT were subjected to the elevated plus maze (EPM) test. Each mouse was placed at the center of a plus-shaped maze consisting of two open and two closed arms (25 cm × 8 cm), elevated 25 cm above the floor, and allowed to explore freely for 15 min. The floorboard was made of white plastic, and the walls were made of opaque gray plastic. The movements of the mice during a period of 15 min were recorded by a camera positioned above the center of the maze. Manual scoring was performed to quantify protected (body in the closed arm) versus unprotected (body in the open arm) areas as a measure of risk assessment.
Quantification and statistical analysis
Data were subjected to parametric or nonparametric tests and are presented as the means ± standard deviations (SDs). MATLAB, Imaris, and Prism software were used for analysis and graph generation. The data are presented as the means ± SDs and were analyzed in a blinded manner to the experimental conditions, with statistical details, including the specific analyses used, described in each figure legend. For unpaired Student’s t tests, p values are noted for two-tailed tests.

Comments (0)