
Remember me

This study was conducted in accordance with the ARRIVE 2.0 guidelines, specifically the ARRIVE Essential Checklist [25]. This study was approved by the Animal Experimentation Committee of Toyo University (Tokyo, Japan; Approval No. 2022-11). Throughout the study, strict hygiene management was maintained for both the experimenters and the laboratory to minimize the risk of infection.
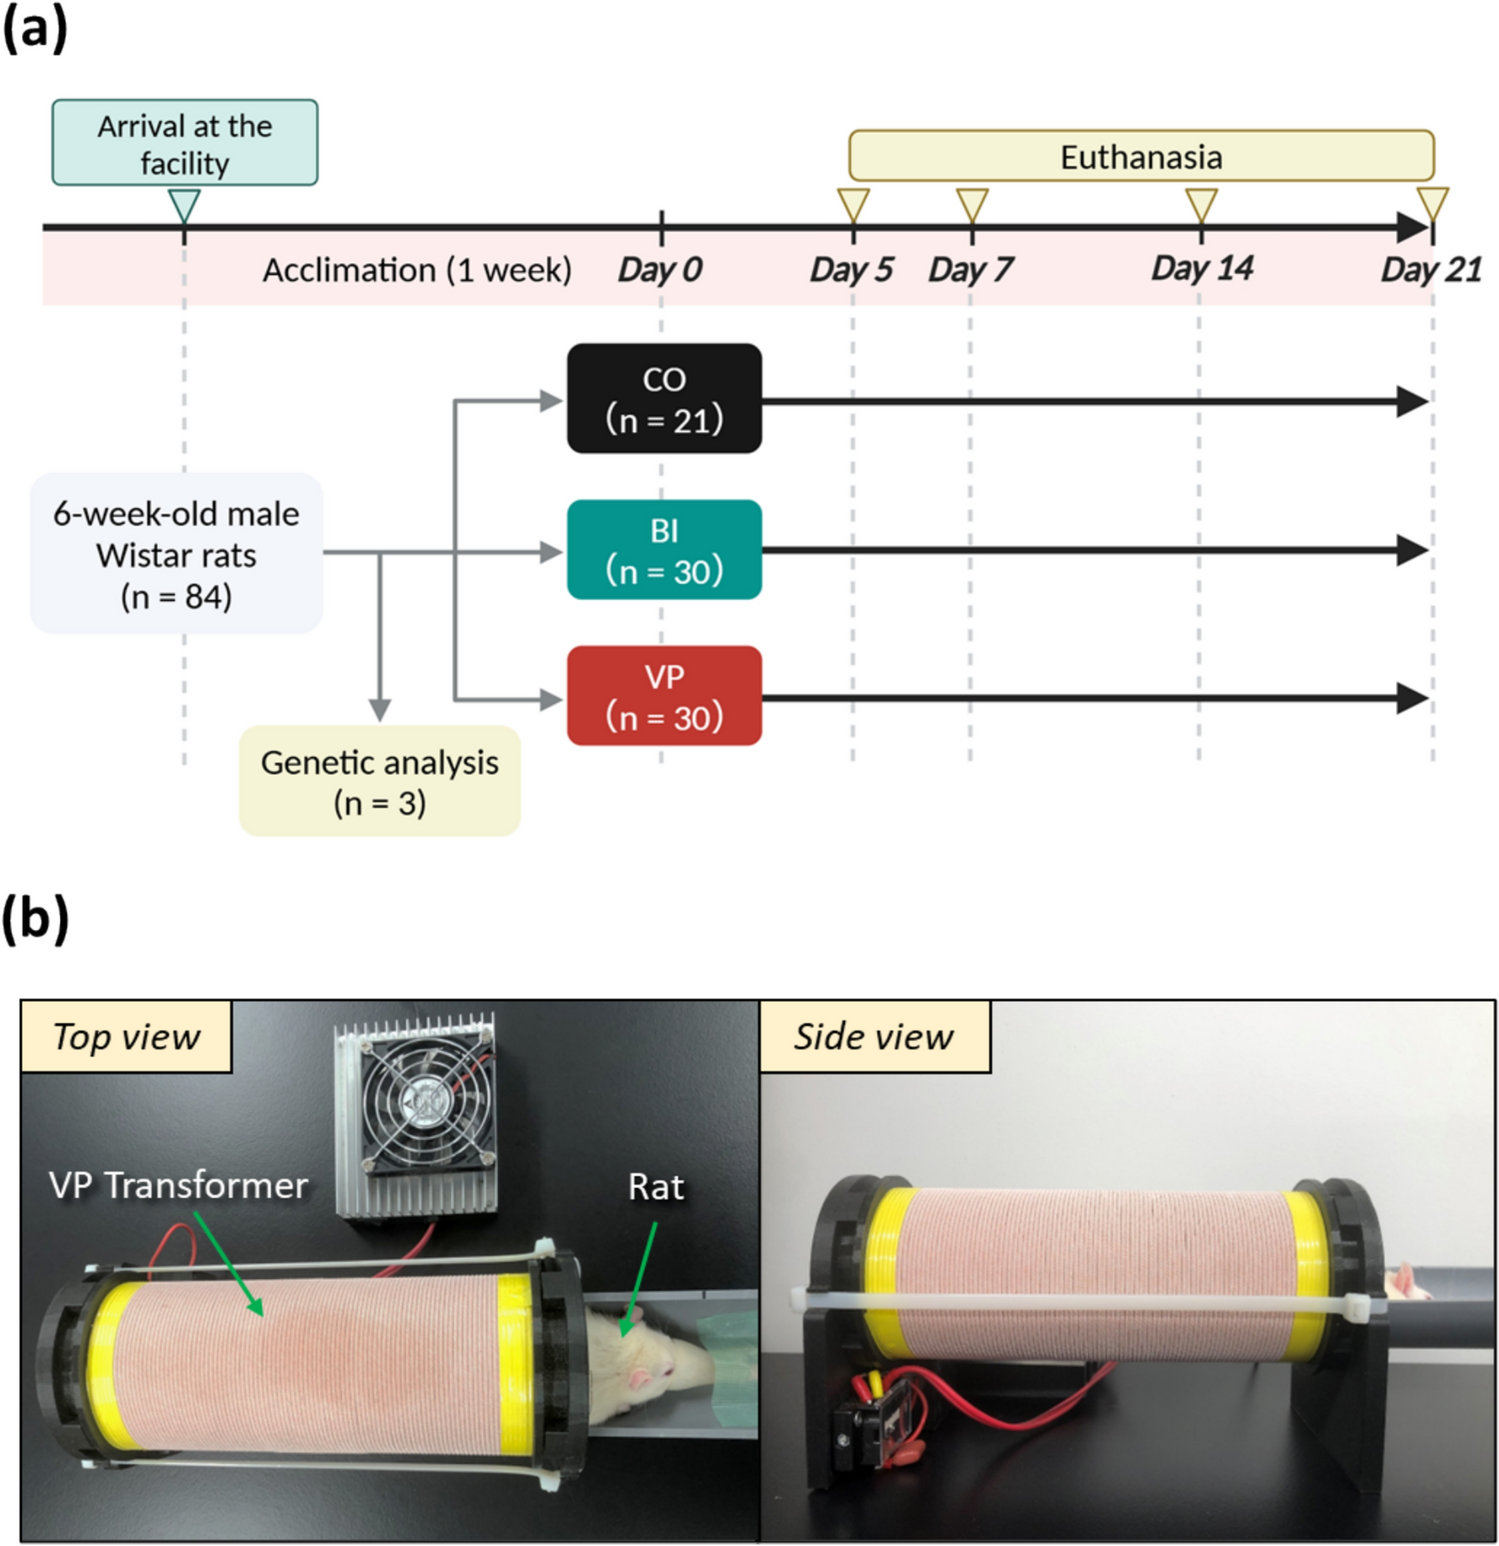
Study designSix-week-old male Wistar rats (n = 84; body weight, 130–150 g; Nippon Bio-Supp. Center; Tokyo, Japan) were used as experimental animals. The rats were delivered as specific pathogen-free and housed under controlled conditions with a temperature of 24 ± 2 °C, humidity of 50 ± 5%, and a 12-h light/dark cycle, with a maximum of four rats per cage. The rats had free access to water and solid food (Oriental Yeast, Tokyo, Japan). After a 1-week acclimation period, the rats, excluding three used for genetic analysis (n = 3), were divided into three groups: the control group (CO, n = 21), the bone injury group (BI, n = 30), in which a drill-hole injury was created, and the group receiving non-contact electrical stimulation via a VP transformer after bone injury (VP, n = 30) (Fig. 1a). In the VP group, rats were anesthetized by isoflurane inhalation (flow rate: 1 L/min, induction concentration: 4%, maintenance concentration: 2%), and VP stimulation (200 kHz, 30 min/day, 7 days/week) was applied using a VP transformer (Sumida Inc., Miyagi, Japan) (Fig. 1b). All rats were euthanized by CO2 inhalation on days 5, 7, 14, and 21 after the experiment and tibial samples were collected (CO: n = 3 on day 5 and n = 6 on days 7, 14, and 21; BI and VP: n = 6 on day 5 and n = 8 on days 7, 14, and 21). The experimental results were shared among the eight co-authors under blinded conditions, and comprehensive interpretations were obtained.
Fig. 1
Study design. a Flowchart. CO Control, BI: Bone injury, VP Vector-Potential. Rats in each group were euthanized by CO₂ inhalation on days 5, 7, 14, and 21 after the start of the experiment. b VP transformer intervention. The hind limb of the anesthetized rat was fully inserted into the VP transformer for stimulation. VP Vector-potential
Preparation of drill-hole injury modelsA standardized drill-hole injury model was created under direct visual observation to ensure surgical simplicity and experimental reproducibility, following previous studies [26]. For general anesthesia, medetomidine hydrochloride (0.375 mg/kg; 907220, Nippon Zenyaku Kogyo, Tokyo, Japan), midazolam (2 mg/kg; 614243022, Sandoz, Tokyo, Japan), and butorphanol tartrate (2.5 mg/kg; 88957, Meiji Animal Health, Tokyo, Japan) were administered via intraperitoneal injection. Once deep anesthesia was confirmed, the skin over the central tibia was shaved and incised, and the space between the gracilis muscle (proximal) and semitendinosus muscle (distal) was widened to expose the tibial cortical bone. A 2.0-mm diameter drill hole was then created in the upper-middle third of both tibiae using a drill bar (89365, Meisinger, Neuss, Germany). After drilling, the surrounding area was rinsed with saline, and the skin was sutured to complete the procedure. Postoperatively, anesthesia was reversed with atipamezole hydrochloride (0.75 mg/kg; 006030, Nippon Zenyaku Kogyo), and analgesia was provided via intraperitoneal injection of buprenorphine (0.3 mg/kg; 5L77L3, Otsuka Pharmaceutical, Tokyo, Japan).
Micro-computed tomography (µCT) analysisThe extracted samples (n = 6) were scanned using µCT (Sky Scan 1276, Bruker, Kontich, Belgium). The scanning conditions were set at 70 kV voltage, 57 µA current, 360° full rotation, and 0.20° rotation step. The acquired scan data were analyzed using 3D image processing software integrated into the Sky Scan system.
Based on a previous study [27], the drill-hole was divided into two distinct regions: the defect region, corresponding to the height of the existing cortical bone, and the intramedullary region, representing the deeper area at the level of the bone marrow cavity (Fig. 2). The bone volume (BV) and bone mineral density (BMD) of the new bone were assessed in the defect region, whereas BV was measured in the intramedullary region.
Fig. 2
Overview of the drill-hole injury and its observation regions. The portion of the drill-hole injury corresponding to the height of the cortical bone was defined as the defect region, while the deeper portion at the level of the bone marrow cavity was defined as the intramedullary region. Scale bar = 1 mm
Tissue processingFor macroscopic and histological analysis, the samples were allocated as follows: macroscopic observation (n = 2), resin-embedded polished sections (CO: n = 4; BI and VP: n = 5), and decalcified paraffin-embedded sections (n = 3).
The tibiae for macroscopic observation were treated with a 3% sodium hypochlorite solution (195-02206, Wako, Osaka, Japan) to remove soft tissue before observation.
The tibiae for resin-embedded polished sections were embedded in a mixed resin of Rigolac 2004 (3801, Nisshin EM, Tokyo, Japan) and Rigolac 70F (380, Nisshin EM). After embedding, the blocks were polished and sliced into longitudinal sections of approximately 150 µm thickness, followed by toluidine blue staining (209-14545, Wako).
The tibiae for decalcified paraffin-embedded sections were decalcified in 8% EDTA (348-01355, Dojindo, Tokyo, Japan) for 3 weeks, embedded in paraffin (166-18964, Wako), and sliced into longitudinal sections of approximately 4 µm thickness using a microtome.
Hematoxylin and eosin (HE) staining, tartrate-resistant acid phosphatase (TRAP) stainingDecalcified paraffin sections were deparaffinized with letrozole and alcohol, followed by H&E staining (Mayer’s hematoxylin: 517-28-2, Sigma, Tokyo, Japan; eosin: E4382-25G, Sigma).
Additional sections were stained with TRAP staining solution prepared with naphthol AS-MX phosphate (N5000-1G, Sigma), Fast Red Violet LB Salt (F3381-500MG, Sigma), sodium hydrogen carbonate (191-01305, Wako), and L (+)-tartaric acid (207-00055, Wako) at 37 °C for 15 min. Methyl green (134-13901, Wako) was used as a counterstain for TRAP staining.
Immunohistochemical analysisDeparaffinized sections were blocked with a blocking reagent (PK-4001; Vector Laboratories, Burlingame, CA, USA) for 60 min to inhibit endogenous enzyme activity. The sections were then incubated overnight at 4 °C with primary antibodies against biglycan (×100; bs-7552R-TR, BIS, Massachusetts, USA) or osteocalcin (×100; OSTCLN-101AP, Invitrogen, Massachusetts, USA). Biglycan was detected using a secondary antibody (30 min) and ABC reagent (30 min) from the VECTASTAIN ABC Rabbit IgG Kit (PK-4001, Vector) and DAB (SK-4100, Vector) for visualization. Osteocalcin was detected using goat anti-rabbit IgG H&L (Alexa Fluor 488; ×200, ab150077, Abcam, Cambridge, UK), followed by mounting with DAPI (ab104139, Abcam).
Gene expression analysisThe extracted samples (CO: n = 3; BI and VP: n = 6) were homogenized under sterile conditions, and total RNA was extracted using TRIzol reagent (15596018, Invitrogen). Total RNA was reverse-transcribed into cDNA using an iScript™ gDNA Clear cDNA Synthesis Kit (1725034, Bio-Rad, Tokyo, Japan). The cDNA was mixed with various TaqMan probes and analyzed using qRT-PCR. TaqMan probes were used for Gapdh (Rn01775763_g1, Invitrogen) as the housekeeping gene, and Bglap (encoding osteocalcin, Rn00566386_g1, Invitrogen) and Ctsk (encoding cathepsin K, Rn00580723_m1, Invitrogen) as target genes. Quantitative real-time polymerase chain reaction (qRT-PCR) analysis was performed using a CFX96 Touch Real-Time PCR Detection System (47153; Bio-Rad), and the Ct values for all samples were calculated. The relative expression levels were calculated using the ΔΔCt method [28].
Statistical analysisAll data were analyzed using IBM SPSS Statistics software ver. 29 (IBM Corp., Armonk, New York, USA). First, the Shapiro–Wilk test was performed to confirm whether the data from each group followed a normal distribution. Unpaired t-tests were performed to compare BI and VP groups. A one-way analysis of variance followed by Tukey’s test was used to compare multiple groups among the CO, BI, and VP groups. Statistical significance was defined as p < 0.05.
Comments (0)