
Remember me

One hundred twenty-six male Sprague-Dawley rats (8 weeks old, 160–230 g) were used. All animals were treated and cared for in accordance with the National Institutes of Health Guide for the Care and Use of Laboratory Animals (Revised, 1996). All protocols were approved by the Institutional Animal Care and Use Committee of Nanfang Hospital, Southern Medical University (Ethics [2021] 001).
Model EstablishmentRats were anesthetized via intraperitoneal injection of pentobarbital sodium (50 mg/kg). Endotracheal intubation and surface electrocardiogram monitoring (lead II) were performed. The LAD was occluded using a 5-0 silk thread for 30 min. Myocardial ischemia was confirmed by ST segment elevation on the electrocardiogram and local cyanosis in the ischemic myocardial region. The ligature was then released to restore arterial circulation for either 2 or 24 h.
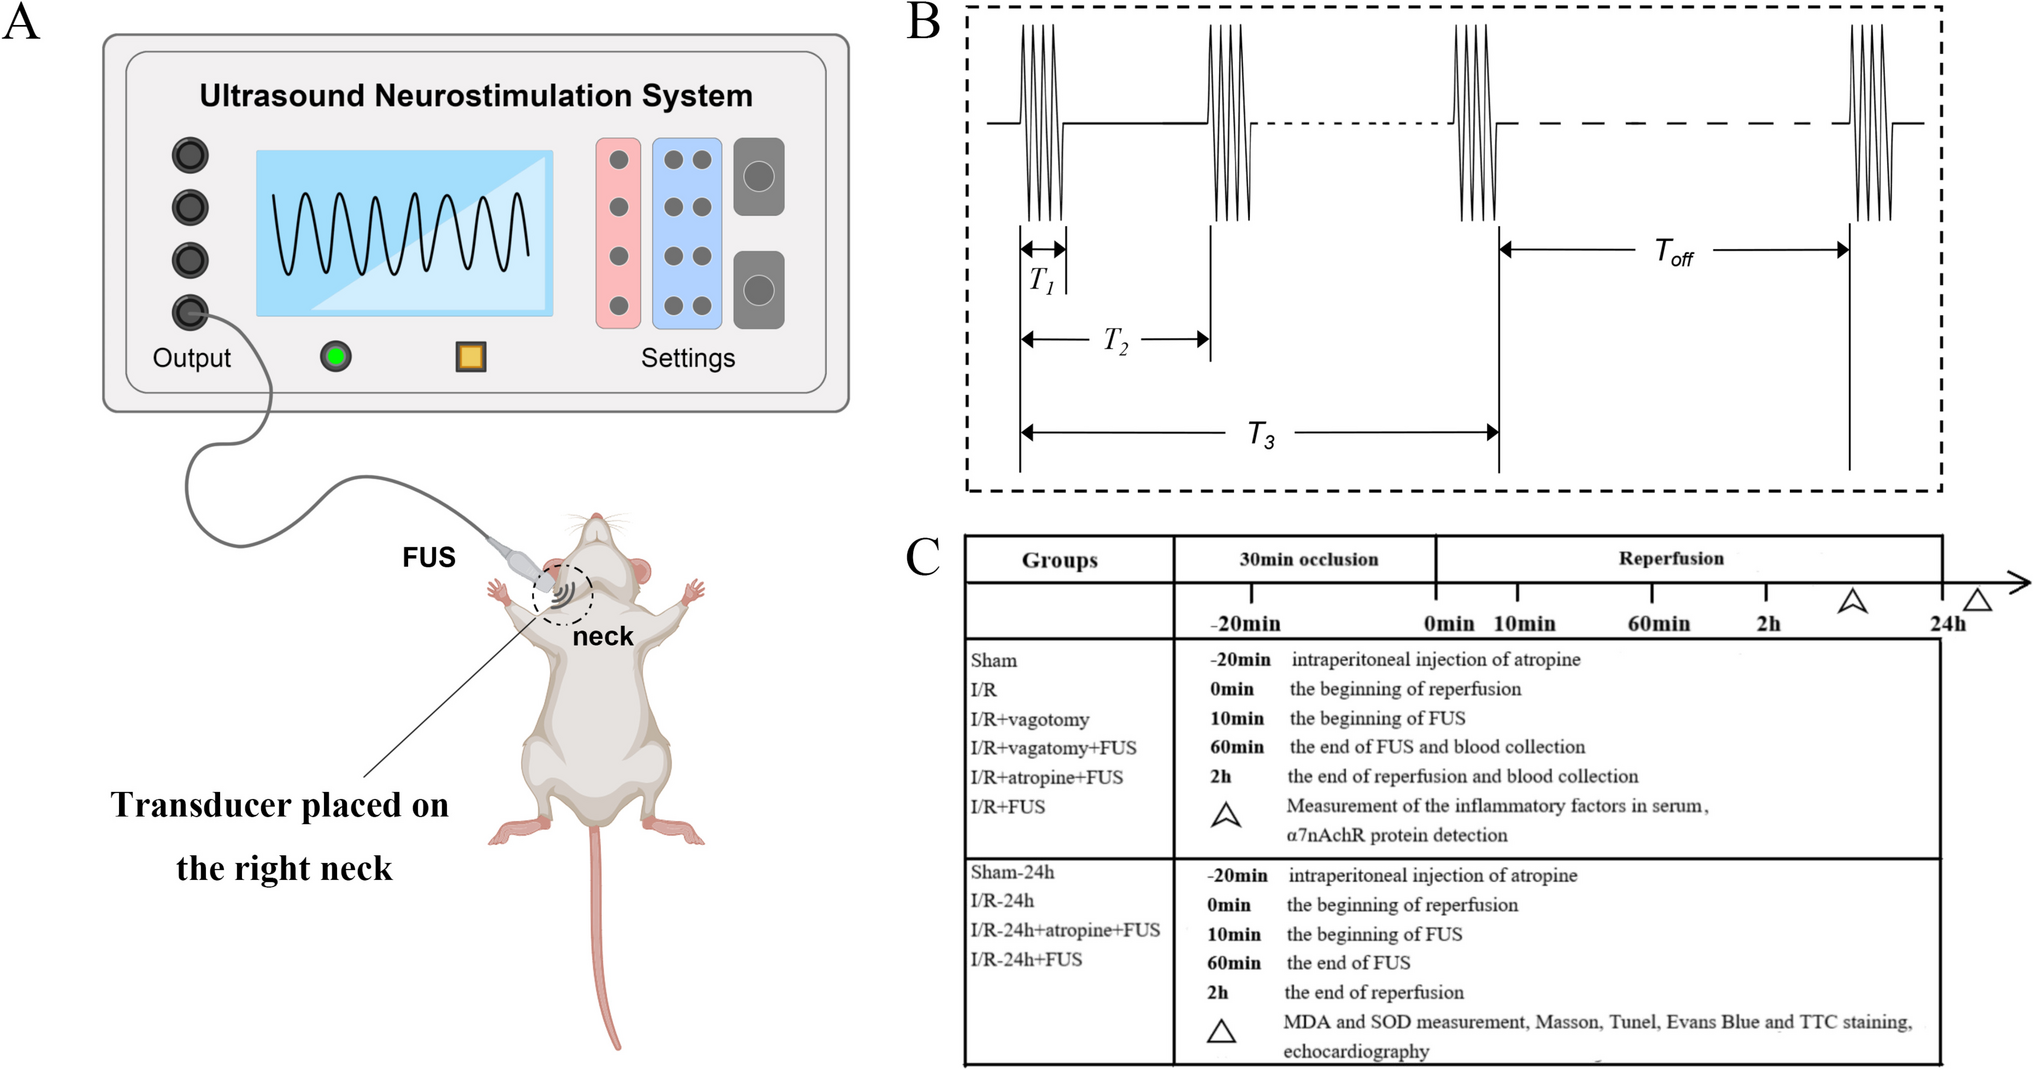
Vagus Nerve Targeting with Focused UltrasoundIn the vagotomy groups, the vagus nerve was surgically exposed and its pathway was verified before performing the vagotomy. For the non-vagotomy groups, anatomical maps of the rat cervical region were used to precisely target the vagus nerve within the carotid sheath at the C5–C6 level. A high-frequency ultrasound probe was employed to identify the common carotid artery, which lies alongside the vagus nerve within the carotid sheath. The probe was positioned transversely to visualize the artery, and the skin was marked perpendicularly to estimate the vagus nerve’s location. As shown in Fig. 1A, the ultrasound probe was positioned on the neck surface based on this anatomical mapping. A portable ultrasound neurostimulation system [13] developed by the Shenzhen Institutes of Advanced Technology, Chinese Academy of Sciences, was used for this study. The system features a miniaturized transducer made from a PMN-PT 1-3 composite single crystal, enabling neurostimulation with adjustable ultrasound parameters, including amplitude, frequency, pulse width, and stimulus duration, to ensure safe and effective application. To minimize potential interference with sympathetic nerve pathways, particularly the superior cervical ganglion, a noninvasive ultrasound approach was employed. This careful positioning of the transducer ensured effective vagus nerve stimulation while reducing the risk of inadvertently stimulating adjacent sympathetic nerves. Electrocardiographic monitoring was employed to observe heart rate changes during the procedure, and the probe position was adjusted as needed to optimize vagus nerve stimulation.
Fig. 1
Experimental protocol for focused ultrasound-mediated vagus nerve stimulation. (A) Schematic diagram illustrating the noninvasive vagus nerve stimulation procedure in rats using a portable ultrasound neurostimulation system. A miniaturized transducer is positioned at the anatomical location of the vagus nerve in the right cervical region to enable targeted neurostimulation. (B) Diagram of the FUS stimulation parameters: T1, continuous pulse duration; T2, pulse repetition period; T3, stimulation duration; Toff, off time between pulses. These parameters were adjusted for optimal vagus nerve stimulation during the experiments. (C) Overview of the experimental protocol, including the experimental groups, the interventions applied (e.g., FUS, vagotomy, atropine administration), and the measurements taken for evaluating outcomes, such as heart rate, arrhythmia incidence, myocardial infarct size, and inflammatory markers
FUS ParametersThe FUS system was positioned on the right side of the rats’ neck. The following stimulation parameters were tested: frequency (0.5, 0.62, 0.74, 1, 1.71, 3 and 5 MHz), amplitude (25, 50, and 100%), continuous pulse duration T1 (0.2, 0.4, 1, 3, 5 and 10 ms), pulse repetition period T2 (1, 2, 5, 10, 25 and 100 ms), stimulation duration T3 (0.2, 0.4, 10, 30, 180, and 360 s), and off-time Toff (Fig. 1B).
The baseline stimulation parameters were set as follows: 0.5 MHz frequency, 25% amplitude, T1 of 0.2 ms, T2 of 1 ms, and T3 of 0.2 s, applied for 6 min. Stimulation was deemed effective when the heart rate decreased by more than 30%. Adjustments were made if stimulation was ineffective.
Study DesignIn the first part of the study, 54 rats were assigned to six groups, with nine rats in each group: (1) sham group: thoracotomy without ligation of the LAD; (2) I/R group: LAD ligation for 30 min followed by 2 h of reperfusion; (3) I/R + vagotomy group: bilateral peripheral vagotomy in addition to I/R; (4) I/R + vagotomy + FUS group: bilateral peripheral vagotomy in addition to I/R and FUS applied to the right vagus nerve for 50 min after 10 min of reperfusion; (5) I/R + atropine + FUS group: I/R and atropine (1 mg/kg, intraperitoneal) administration after 10 min of ischemia, followed by FUS; (6) I/R + FUS group: I/R and FUS. Hearts were harvested for hematoxylin and eosin (H&E) staining, light microscopy observation, and measurement of α7 nicotinic acetylcholine receptor (α7nAChR) expression. In this part, the sample size of nine rats per group was determined on the basis of preliminary power calculations to ensure sufficient statistical power for mechanistic analyses such as histopathological assessment and α7nAChR detection.
(1)In the second part of the study, 72 rats were divided into four groups, with 18 rats in each group: (1) sham-24h group: thoracotomy without LAD ligation.
(2)I/R-24h group: LAD ligation for 30 min followed by 24 h of reperfusion.
(3)I/R-24h + atropine + FUS group: atropine (1 mg/kg, intraperitoneal) administered after 10 min of ischemia, followed by 50 min of FUS after 10 min of reperfusion and 24 h of reperfusion.
(4)I/R-24h + FUS group: 50 min of FUS after 10 min of reperfusion and 24 h of reperfusion. Each group was subdivided into three experimental subgroups (n = 6 per subgroup) to facilitate the parallel evaluation of myocardial fibrosis (Masson’s trichrome staining), infarct size (Evans Blue/triphenyltetrazolium chloride [TTC] staining), and oxidative stress biomarkers.
This subgroup design ensured adequate sample sizes for each assay and enhanced data reliability. The overall study design is summarized in Fig. 1C.
Electrocardiographic Parameters and Incidence of Ventricular ArrhythmiasContinuous electrocardiographic monitoring was performed during the first part of the experiment to measure heart rate, PR interval, QRS duration, and QT interval. Electrocardiographic signals were recorded and analyzed using Labchart Reader software (ADInstruments, Australia), which provides high-resolution, millisecond-level accuracy. This software is designed to capture and quantify QRS duration and detect subtle changes as small as 1 to 2 ms, ensuring reliable evaluation of electrocardiographic parameters during both ischemia and reperfusion across all experimental groups. Baseline parameters were determined from the average of 20 sinus beats before anesthesia. Mean parameters during the I/R period were analyzed from the average of 20 consecutive beats before the end of occlusion and reperfusion, respectively.
The incidence and duration of ventricular arrhythmias were recorded. Ventricular arrhythmias were classified according to the Lambeth diagnostic convention criteria, with modifications: premature ventricular contractions, ventricular tachycardia (>6 consecutive premature ventricular contractions), and ventricular fibrillation (loss of electrocardiographic synchronicity) [14]. Arrhythmia scores were assigned for the entire 30-min ischemia period and 2-h reperfusion period based on the scoring system described by Curtis and Walker [15]: 0: <50 premature ventricular contractions, 1: 50-499 premature ventricular contractions, 2: >500 premature ventricular contractions and/or one episode of spontaneously reverting ventricular tachycardia/ventricular fibrillation, 3: >1 episode of spontaneously reverting ventricular tachycardia/ventricular fibrillation (<1 min total combined duration), 4: 1–2 min of total combined ventricular tachycardia/ventricular fibrillation, 5: >2 min of ventricular tachycardia/ventricular fibrillation.
Echocardiographic MeasurementsMyocardial function, including left ventricular end-systolic diameter, end-diastolic diameter, left ventricular fractional shortening, and left ventricular ejection fraction, was measured using short-axis B-mode images obtained by echocardiography (MS250 probe, Vevo 2100, VisualSonics, USA) after 24 h of reperfusion.
Inflammatory Factors in the SerumBlood samples were collected through the right jugular vein after thoracotomy at 90 and 150 min in the sham group, and after reperfusion at 60 and 120 min in the remaining five groups. ELISA kits (Meimian Industrial Co., Ltd., Jiangsu, China) were used according to the manufacturer’s instructions to measure the levels of C-reactive protein, interleukin-1, interleukin-6, high mobility group box protein-1, troponin T, intracellular adhesion molecule-1, tumor necrosis factor-alpha, and acetylcholine in serum.
Evans Blue and TTC StainingFollowing myocardial I/R injury in rats, the chest was reopened, and the LAD was ligated at the original site using a 5-0 silk suture. Then, 2 ml of 0.5% Evans Blue dye was injected into the inferior vena cava, staining the nonischemic myocardial tissue blue. The heart was sectioned perpendicularly to its long axis into four 1–2 mm slices from the apex to the ligation site. These slices were incubated in 1.0% TTC solution in a 37 °C water bath, protected from light, for 30 min. Nonischemic myocardium appeared blue (Evans Blue), ischemic myocardium appeared red (TTC), and infarcted tissue remained white. Using the method described by Shinlapawittayatorn et al. [16], the infarcted area relative to the area at risk was quantified using ImageJ software. The infarct size was expressed as the ratio of the infarcted area to the area at risk, calculated as “Infarct size/Area at risk (%)”.
Immunohistopathological AnalysisMyocardial tissue below the ligature was harvested, and paraffin sections were prepared and stained with H&E. Neutrophil granulocyte infiltration was observed under a light microscope at ×200 magnification. Myocardial fibrosis was assessed by Masson’s trichrome staining, also examined at ×200 magnification. The expression of α7nAChR was determined by identifying positive brown granules using Image Pro Plus 6.0 software, and the immunohistochemical cumulative optical density value of immunohistochemical staining was analyzed. Myocardial apoptosis was evaluated by TUNEL staining. Apoptotic cells were stained brown, and the total number of cardiomyocyte nuclei per high-power field was counted using ImageJ software (NIH, Bethesda, MD, USA).
Biomarkers of Pro-Oxidative Stress and AntioxidantsMalondialdehyde (MDA) and superoxide dismutase (SOD) levels in myocardial tissue were measured using a colorimetric assay (Shenzhen TopBiotech Co., Ltd., Guangdong, China).
Statistical AnalysisAll continuous variables were tested for normality using the Kolmogorov–Smirnov test. For variables that did not follow a normal distribution, nonparametric tests (Kruskal–Wallis test) were used. Homogeneity of variances was assessed using Levene’s test before conducting one-way ANOVA. If the assumption of homogeneity was satisfied, post hoc comparisons were performed using the least significant difference (LSD) test. All data were expressed as mean ± standard deviation (x̄ ± s). A two-sided p value of <0.05 was considered statistically significant. Statistical analyses were performed using SPSS software version 22.0 (IBM Corp., Armonk, NY, USA) and GraphPad Prism version 8.0.1 (GraphPad Software, San Diego, CA, USA).
Comments (0)